73822 E Nf-20e Lot 8 · Rhododendron, OR
Flood risk 6/10 · Moderate
- FEMA flood zone
- X (unshaded)
- Chance of flooding over 30 yrs
- 0.27%
- Est. flood insurance / yr
- $507 – $1,088
Fire risk 3/10 · Minor
- Est. fire insurance / yr
- $498 – $926
Heat risk 1/10 · Minimal
- Hot days now (above 84°F)
- 8 days/yr
- Hot days in 30 yrs
- 17 days/yr
Wind risk 1/10 · Minimal
- Chance of severe wind over 30 yrs
- —
Air-quality risk 9/10 · Severe
- Unhealthy air days now
- 12 days/yr
- Unhealthy air days in 30 yrs
- 14 days/yr
Risk factors via First Street. Map © Google.
Why this score? — see what drove the B grade
The composite is a weighted blend of 9 inputs, each scored 0–100. Each bar is that input's sub-score; the figure is the points it added to the 100-point composite (weight × sub-score).
- Cash flow +30.0/30.0
- 1% rule +10.0/10.0
- DSCR +10.0/10.0
- ARV discount +7.5/15.0
- Schools +5.0/10.0
- Rent growth +2.5/5.0
- Livability +2.5/5.0
- Condition / age +2.5/5.0
- Appreciation +0.0/10.0
$110,000
🖨 Deal sheet 📄 Offer letter ✓ Due diligence
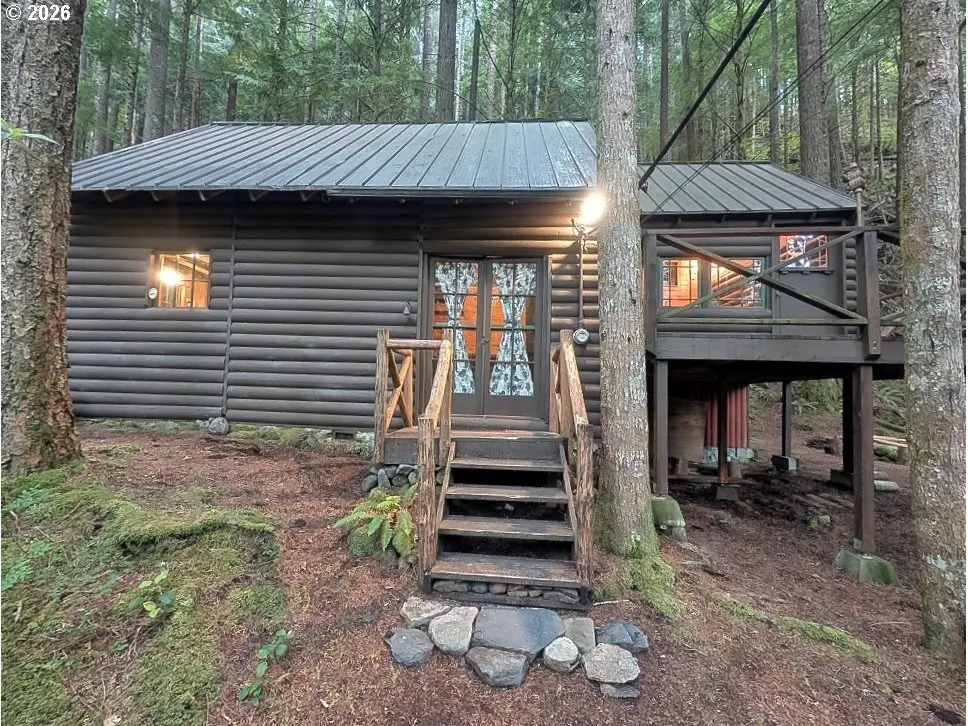
Listing remarks
Step back in time with this rustic half-log cabin tucked away in the Mt. Hood National Forest near the Zig Zag River. Located on leased forest land, this open-concept two story getaway offers the classic hard to find mountain cabin feel buyers look for but rarely find at this price point. Towering fir and cedar trees surround the cabin with natural beauty, . This is the perfect basecamp for hiking, skiing, fishing, biking, and year-round recreation just minutes from Mt. Hood amenities. You can walk to the Zig Zag River, hiking trails nearby, and Still Creek a short distance away to watch the spawning salmon in the fall. Inside the two story cabin you’ll find vaulted open-beam ceilings
Key facts
- Hiking trails nearby
- 0.37 acre lot
- Built 1950
Tags
Property features AI
Finance
- Other: Property located on leased land; zoning listed as leased
- Financial info: Land lease in place (lease expires December 31, 2028)
- HOA & community: Annual lot/association fee of $2,500 (land lease payment)
Exterior
- Parking: Driveway
- Utilities: Electricity and wood burning fuel sources; Water: Other; Sewer: Other
- Home design: Single-family residence (resale); View of trees/woods
- Construction: Built in 1950; Pillar/post/pier foundation; Metal roof
- Exterior features: Deck; Fire pit; Log and wood siding exterior; Level, wooded lot (leased land); Gravel road access
Interior
- Kitchen: Kitchen with wood floors
- Bedrooms: Primary bedroom on upper level with vaulted ceiling and wood floors; Second bedroom on upper level with wood floors; Bonus room on main level
- Flooring: Wood floors throughout main living areas and bedrooms
- Bathrooms: One bathroom (includes a partial bath on the main level)
- Heating & cooling: Wall furnace; Wood stove; No central cooling
- Interior features: Furnished; High ceilings; Vaulted ceilings; Wood floors; Wood-framed windows; Wood-burning fireplace (1)
Neighborhood map
What this means for you Summary
Snapshot
- This is a 2-bed/1.0-bath single-family listed at $110k.
Deal economics
- At list price, monthly cash flow is $473 ($6k/yr) — positive.
- The deal already cash-flows at list — no discount required.
- Meets the 1% rule at list price ($2k rent vs $110k).
Location & tenants
- Location reads: area grade B — affects rentability + tenant quality, not the cash-flow math above.
- Oregon Trail SD 46 (town): math 47% / reading 64% proficiency, ranked #12 of 183 in OR (top 7%) — acceptable for families but not a draw, mixed tenant base, ~2y average lease.
- Zoned schools: Welches Elementary School (190 students, 42% FRL); Welches Middle School (89 students, 44% FRL); Sandy High School (1,440 students, 32% FRL) — zoned schools at 39% FRL track the district average.
- Market conditions: 45 active listings in the ZIP; 946 units permitted in Clackamas County in 2024 (188 in 5+ unit buildings).
Forward outlook
- Local home prices are declining (-3.0%/yr); year-one equity from $761 of loan paydown is wiped out by about $3k of value loss. Plan a longer hold.
- Clackamas County population projected at +25% by 2050 — long-run rental-demand tailwind backs the buy-and-hold thesis.
- At projected returns (-3.0% appreciation + 3.0% rent growth), your $31k cash investment doubles in ~7 years — after that, you're playing with house money.
Negotiation context
- Only 10 days on market — expect competitive offers; lowballing is unlikely to land.
- Current owner paid $14k; list at $110k implies a 659% gain — meaningful room to come down on a strong offer.
Risks & watch-outs
- Watch-outs: built in 1950 — expect roof / HVAC / electrical / plumbing capex.
- Climate carrying-cost: major flood risk — expect insurance premiums to compound above CPI over the hold.
Questions for the listing agent
- Built in 1950 — when were the roof, HVAC, electrical panel, plumbing, and water heater last replaced?
- What does the HOA fee cover, when was the last increase, and are there any pending special assessments or reserve-fund shortfalls?
- Is there a deadline driving the sale (1031 exchange, divorce, estate, relocation)? That informs how much negotiation room exists.
- What's the average days-on-market for RENTAL listings here right now (not sales)? A rising rental-DOM trend means longer vacancies and softer asking-rent achievability than the comps imply.
- What's the recent tenant-quality profile in this submarket — average credit score on applications, eviction rate, late-payment / NSF rate, and stable-employment percentage? A property-management company in the area should have these aggregated.
- How much new for-sale + rental construction is in the pipeline within 1–3 miles? Heavy new supply typically softens prices + rents 12–24 months out; constrained supply supports both.
Investment metrics
- 1% rule
- 1.58% ✓
- Cap rate
- 11.45%
- Cash-on-cash
- 18.41%
- DSCR
- 1.82
- GRM
- 5.3
CMA / ARV
No comps found within radius.
Projected returns pro-forma
-3.0% appreciation · 3.0% rent growth · sell at horizon
- IRR
- 10.2%
- Equity multiple
- 1.40×
- Total profit
- $12,383
- Equity at exit
- $16,401
- IRR
- 19.3%
- Equity multiple
- 2.62×
- Total profit
- $49,995
- Equity at exit
- $9,511
Cash invested: $30,800 (down + closing). Projections, not guarantees.
Landlord ↔ Tenant lean methodology
- Overall (STATE)
- 28 Tenant-Leaning
- State Oregon
- 28 Tenant-Leaning · D+6
- County
- — inherits STATE
- City
- — inherits STATE
ZIP-level market 97049
- Home prices YoY
- -28.4%
- Active inventory
- 45
- Price-to-rent
- 5.3×
Monthly cashflow live
- Estimated rent
- $1,740 medium interval (Pro) →
- Mortgage (P&I)
- −$577
- Tax from tax record
- −$72 /mo · $858/yr
- Insurance
- −$46
- HOA
- −$208
- Vacancy / Maint / Mgmt
- −$365
- Net cashflow
- $473
Break-even live
UW: 25.0% down · 7.5% · 30yr · 1.5% tax · 5.0% vac · 8.0% maint · 8.0% mgmt
Financing live
Cash to close
- Down payment
- $27,500
- Closing costs
- $3,300
- Reserves months
- —
- Total cash needed
- —
Loan-product check · same deal, 3 products live
Conventional
25% down · 7.5% · 30yr
- Down + closing
- —
- Monthly P&I
- —
- Monthly cashflow
- —
- DSCR
- —
- Eligible?
- —
Personal DTI + credit; lowest rate.
DSCR
20% down · 8.5% · 30yr
- Down + closing
- —
- Monthly P&I
- —
- Monthly cashflow
- —
- DSCR
- —
- Eligible?
- —
No personal income docs; deal must DSCR.
Hard money
10% down · 12.0% · 12mo
- Down + closing
- —
- Monthly P&I
- —
- Monthly cashflow
- —
- DSCR
- —
- Eligible?
- —
Short-term bridge; refi at stabilization.
HOA detail
- Monthly dues
- $208 · $2,496/yr
Listing history 8 events
-
2026-06-18days on market $110,000 Active 10 DOM
-
2026-06-17days on market $110,000 Active 9 DOM
-
2026-06-16days on market $110,000 Active 8 DOM
-
2026-06-15days on market $110,000 Active 7 DOM
-
2026-06-13days on market $110,000 Active 5 DOM
-
2026-06-13days on market $110,000 Active 4 DOM
-
2026-06-09remarks 693-char remark
-
2026-06-09$110,000 Active 1 DOM
ⓘ Source: listings_history table (triggers on properties + properties_extension) + one-shot
backfill from property_details.listing_events for pre-trigger history.
Tax reassessment forecast OR · Resets to sale price
- Current annual tax
- $858 · $72/mo
- Projected year-2 tax
- $1,067 · $89/mo
- Expected delta
- +$209/yr (+$17/mo · 24.4%)
ⓘ Screening estimate from a state-policy table — verify with the county assessor before closing.
Climate risk First Street
- Flood 6/10 Major FEMA zone X (unshaded) · 27% chance over 30 yrs
- Wildfire 3/10 Moderate
- Heat 1/10 Low 8 d/yr ≥84°F today · 17 d/yr by 30 yrs out
- Wind 1/10 Low
- Air quality 9/10 Extreme 12 unhealthy d/yr today · 14 by 30 yrs out
Nearby sold comps map
Loading sold comps map…
Walkable amenities ~0.75 mi
Loading nearby amenities…
Taxation est. · year 1
- Rental income
- $20,881
- − Mortgage interest
- −$6,162
- − Property taxes
- −$858
- − Insurance
- −$550
- − Repairs & maintenance
- −$1,671
- − Management
- −$1,671
- − HOA
- −$2,496
- − Depreciation
- −$3,200
- Taxable income
- $4,275
- Est. tax owed @ 24.0%
- −$1,026
- After-tax cash flow
- $4,644/yr
For passive investors: Depreciation is non-cash, so a rental often shows a tax loss while cash-flowing — sheltering income. Rental losses are passive: they offset passive income freely, and up to $25,000/yr can offset ordinary (W-2) income if you actively participate and your MAGI is under $100k (phasing out to $0 by $150k); unused losses carry forward. On sale, claimed depreciation is recaptured at up to 25%, and gains may owe capital-gains tax (a 1031 exchange can defer both). Figures are a year-1 estimate at your 24.0% rate — not tax advice; consult a CPA.
Schools (NCES district)
- District
- Oregon Trail SD 46
- NCES district ID
- 4110890
- Math proficiency
- 47% ▬ 0.00%
- Reading proficiency
- 64% ▲ 1.00%
- Median HH income
- $61,406
- Composite
- 50.19/100
- National rank
- #4075
- State rank
- #12 of 183 in OR
Livability — Rhododendron
No livability data for this city. (Only ~50 U.S. cities are tracked.)
Census & demographics
- Census place
- Rhododendron, OR
- Population (ZIP)
- 2,015
Population outlook (Clackamas County) Hauer SSP2
- Today (2025)
- 458,456 people
- By 2030
- 485,185 · +5.8%
- By 2040
- 532,932 · +16.2%
- By 2050
- 574,445 · +25.3%
- By 2075
- 665,497 · +45.2%
- By 2100
- 697,488 · +52.1%
Race, ethnicity, and origin ACS 2023
- Neighborhood character
- Predominantly White (91%)
- Race & ethnicity
- White 91% Two or more races 6% Hispanic / Latino 4% Asian 1%
- Common ancestry
- Slovak 4% Scottish 3% Italian 3%
- Foreign-born
- 2% · China
- Languages at home
- 96% English-only · Spanish 1% Russian/Polish/Slavic 1% Chinese 1%
Political lean MEDSL · Clackamas
- 2024 margin
- Lean D (+9.7) · D 53.4% · R 43.6% · Other 3.0%
- 2008→2024 swing
- -0.6pp no change · 2008: 10.4pp · 2024: 9.7pp
- All cycles
- 2024: D+9.7 2020: D+11.1 2016: D+6.1 2012: D+3.5 2008: D+10.4
Not yet ingested
- Civics
- —
Market trends
- HPI YoY
- ▼ -118.02%
- Current HPI
- 297.7871
- Rent YoY
- —
- Metro
- —
- State GDP YoY
- ▲ 2.05%
- F500 in state
- 2
Industry mix (Fortune 500 HQ in OR)
| Industry | F500 HQs | Revenue |
|---|---|---|
| Consumer Goods | 1 | $51B |
|
||
Price history
+658.6% since first listed2 events — show timeline
- 2026-06-08 Listed $110,000 RMLS
- 1996-03-04 Sold (Public Records) $14,500 Public Records
Property tax history
+3.7%/yrLatest (2025): $858 · +10.5% YoY. Source: county tax records.
Cash-flow waterfall
monthlySold comps — $/sqft
last 12 mo · ≤1 miLoading sold comps…