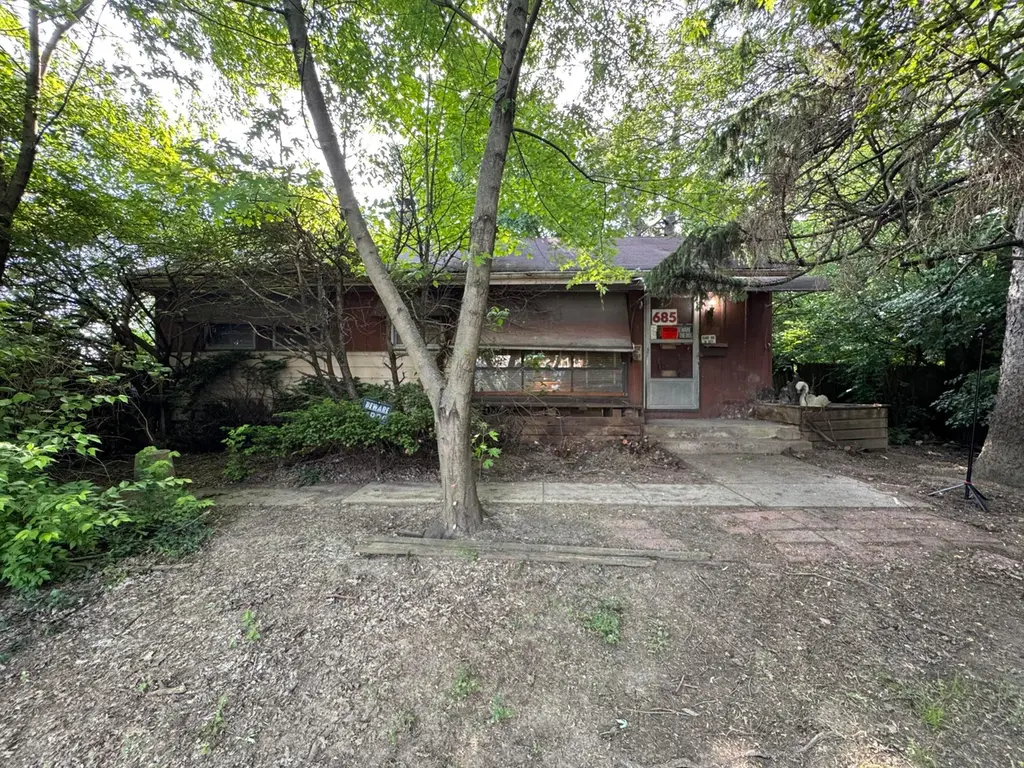
685 S James Rd · Columbus, OH
Flood risk 1/10 · Minimal
- FEMA flood zone
- X (unshaded)
- Chance of flooding over 30 yrs
- 0.0%
- Est. flood insurance / yr
- $473 – $860
Fire risk 1/10 · Minimal
- Est. fire insurance / yr
- $713 – $1,323
Heat risk 4/10 · Minor
- Hot days now (above 99°F)
- 7 days/yr
- Hot days in 30 yrs
- 18 days/yr
Wind risk 2/10 · Minimal
- Chance of severe wind over 30 yrs
- 1.0%
Air-quality risk 2/10 · Minimal
- Unhealthy air days now
- 1 days/yr
- Unhealthy air days in 30 yrs
- 3 days/yr
Risk factors via First Street. Map © Google.
Why this score? — see what drove the C+ grade
The composite is a weighted blend of 9 inputs, each scored 0–100. Each bar is that input's sub-score; the figure is the points it added to the 100-point composite (weight × sub-score).
- Cash flow +25.3/30.0
- 1% rule +9.2/10.0
- DSCR +8.3/10.0
- ARV discount +7.5/15.0
- Livability +4.0/5.0
- Rent growth +3.1/5.0
- Condition / age +2.5/5.0
- Schools +1.7/10.0
- Appreciation +0.0/10.0
$79,900
🖨 Deal sheet (PDF) 📄 Offer letter ✓ Due diligence
Listing remarks
Investor special with off street parking. Next door lot will be listed as well with the option to purchase both together for a total of . 3 acres. Basement was previously finished, and offers additional bedrooms, bathroom and a secondary kitchen. Minutes from Bexley and downtown Columbus. No curb offers will be accepted, bring your contractor!
Key facts
- 6,534 sq ft lot
- Garage
- Built 1951
Property features AI
Exterior
- Parking: Detached garage (1 car)
- Utilities: Public water; Public sewer
- Home design: Single-family home; One story; Built in 1951; No shared/common walls
- Construction: Built 1951; Block foundation
- Exterior features: Block foundation; Lot about 0.15 acre (approx. 6,534 sq ft)
Interior
- Bedrooms: 2 main-level bedrooms
- Bathrooms: 2 full bathrooms; 1 half bathroom (2.5 total)
- Interior features: Full basement
Neighborhood map
What this means for you Summary
Snapshot
- This is a 2-bed/2.5-bath single-family listed at $80k.
Deal economics
- At list price, monthly cash flow is $182 ($2k/yr) — positive.
- The deal already cash-flows at list — no discount required.
- Meets the 1% rule at list price ($1k rent vs $80k).
- Cap rate 9.0% vs local median 3.8% in Columbus — top-decile yield for the area; either an underpriced asset or a hidden risk that comps aren't pricing in. Stress-test before assuming the spread holds.
Location & tenants
- Location reads 81/100 on livability (#97 in OH, #1,491 nationally) — a professional / high-income tenant draw. Strengths: commute A+, cost of living A+, housing A+; Watch: employment C-, crime F.
- Columbus City School District (urban): math 15% / reading 26% proficiency, ranked #626 of 656 in OH (top 95%) — low school quality limits family demand, transient renter base, plan for 1-2y turnover; 72% free/reduced lunch — lower-income household profile, screen leases tightly.
- Zoned schools: Indianola Informal K-8 School (math 43% / reading 58%, grade D+, #896 of 1,584 statewide, top 57%, 684 students, 0% FRL); Arts Impact Middle School (Aims) (math 17% / reading 25%, grade F, #608 of 654 statewide, top 93%, 532 students, 0% FRL); Columbus Alternative High School (math 27% / reading 74%, grade D+, #380 of 781 statewide, top 49%, 758 students, 0% FRL) — zoned schools average 0% FRL vs 72% district-wide (72 pts lower); this property's tenant base skews higher-income than the district average.
- Zoned-school proficiency averages 41% at this address vs 20% district-wide (+20 pts) — the actual schools serving this property are materially stronger than the Columbus City School District average implies; a family-tenant draw the district grade alone would hide.
- Market conditions: Rents rising (+2.3%/yr); 67 active listings in the ZIP; 40 comparable units currently listed for rent nearby; rentals lingering (median 45d on market — plan ~5-8 weeks vacancy on turnover, expect pricing pressure); 50% of comp listings sitting > 30 days — soft ceiling on asking rent; 8,139 units permitted in Franklin County in 2024 (5,940 in 5+ unit buildings).
Forward outlook
- Local home prices are declining (-3.0%/yr); year-one equity from $552 of loan paydown is wiped out by about $2k of value loss. Plan a longer hold.
- Franklin County population projected at +34% by 2050 — long-run rental-demand tailwind backs the buy-and-hold thesis.
Negotiation context
- Only 3 days on market — expect competitive offers; lowballing is unlikely to land.
Risks & watch-outs
- Watch-outs: property tax is 3.9% of price; built in 1951 — expect roof / HVAC / electrical / plumbing capex.
Questions for the listing agent
- Built in 1951 — when were the roof, HVAC, electrical panel, plumbing, and water heater last replaced?
- Property tax is high relative to price — has the assessment been appealed recently, and will the sale trigger a re-assessment?
- Is there a deadline driving the sale (1031 exchange, divorce, estate, relocation)? That informs how much negotiation room exists.
- Crime grade is F in this area — have there been break-ins, vandalism, or insurance claims at this property in the last 3 years? What carrier currently insures it and at what premium?
- What's the average days-on-market for RENTAL listings here right now (not sales)? A rising rental-DOM trend means longer vacancies and softer asking-rent achievability than the comps imply.
- What's the recent tenant-quality profile in this submarket — average credit score on applications, eviction rate, late-payment / NSF rate, and stable-employment percentage? A property-management company in the area should have these aggregated.
- How much new for-sale + rental construction is in the pipeline within 1–3 miles? Heavy new supply typically softens prices + rents 12–24 months out; constrained supply supports both.
Investment metrics
- 1% rule
- 1.42% ✓
- Cap rate
- 9.03%
- Cash-on-cash
- 9.77%
- DSCR
- 1.43
- GRM
- 5.9
CMA / ARV
- ARV (median comp)
- $163,478
- List price
- $79,900
- Delta
- -51.12%
- Verdict
- UNDERPRICED
- Comps
- 20 within 1.0 mi
Show comp detail 12 sales within ~0.75 mi
| Address | Dist | Beds/Ba | Sqft | Sold | Price | $/sf | Match |
|---|---|---|---|---|---|---|---|
| 824 S Ashburton Rd | 0.21mi | 3/2.0 (+1) | 925 (+5%) | 1mo | $165,000 | $178 | 75 |
| 892 Ruby Ave | 0.52mi | 2/2.0 | 884 (0%) | 3mo | $108,000 | $122 | 72 |
| 891 S Hampton Rd | 0.33mi | 3/1.0 (+1) | 864 (-2%) | 3mo | $120,000 | $139 | 67 |
| 857 S Waverly St | 0.34mi | 3/1.0 (+1) | 850 (-4%) | 3mo | $127,000 | $149 | 64 |
| 470 S Weyant Ave | 0.55mi | 2/1.0 | 888 (+0%) | 6mo | $64,000 | $72 | 62 |
| 957 S Ashburton Rd | 0.39mi | 3/1.0 (+1) | 864 (-2%) | 6mo | $104,100 | $120 | 62 |
| 1042 S Hampton Rd | 0.53mi | 3/1.0 (+1) | 864 (-2%) | 3mo | $144,000 | $167 | 58 |
| 845 S Hampton Rd | 0.29mi | 3/1.0 (+1) | 979 (+11%) | 1mo | $120,000 | $123 | 57 |
| 711 S Waverly St | 0.29mi | 3/2.0 (+1) | 984 (+11%) | 6mo | $221,875 | $225 | 56 |
| 450 S Waverly St | 0.52mi | 3/1.5 (+1) | 966 (+9%) | 2mo | $140,000 | $145 | 50 |
| 3353 Towers Ct S | 0.66mi | 3/1.0 (+1) | 900 (+2%) | 6mo | $134,000 | $149 | 50 |
| 647 S Napoleon Ave | 0.44mi | 3/1.0 (+1) | 979 (+11%) | 6mo | $175,000 | $179 | 45 |
Match score weights: distance 35% · size 25% · config 20% · recency 20%. Top-matched comps best support the ARV.
Projected returns pro-forma
-3.0% appreciation · 2.29% rent growth · sell at horizon
- IRR
- -2.4%
- Equity multiple
- 0.91×
- Total profit
- $-2,038
- Equity at exit
- $11,913
- IRR
- 6.4%
- Equity multiple
- 1.46×
- Total profit
- $10,378
- Equity at exit
- $6,908
Cash invested: $22,372 (down + closing). Projections, not guarantees.
Landlord ↔ Tenant lean methodology
- Overall (STATE)
- 73 Landlord-Friendly
- State Ohio
- 73 Landlord-Friendly · R+6
- County
- — inherits STATE
- City
- — inherits STATE
ZIP-level market 43213
- Rents YoY
- 2.3%
- Active inventory
- 67
- Price-to-rent
- 5.9×
Monthly cashflow live
- Estimated rent
- $1,135 high interval (Pro) →
- Mortgage (P&I)
- −$419
- Tax from tax record
- −$262 /mo · $3,144/yr
- Insurance
- −$33
- HOA
- −$0
- Vacancy / Maint / Mgmt
- −$238
- Net cashflow
- $182
Break-even live
Sensitivity live
| Price | -10% $227 | -5% $205 | +0% $182 | +5% $159 | +10% $137 |
|---|---|---|---|---|---|
| Rent | -10% $92 | -5% $137 | +0% $182 | +5% $227 | +10% $272 |
| Rate | -1.0pp $222 | -0.5pp $202 | base $182 | +0.5pp $161 | +1.0pp $140 |
UW: 25.0% down · 7.5% · 30yr · 1.5% tax · 5.0% vac · 8.0% maint · 8.0% mgmt
Financing live
Cash to close
- Down payment
- $19,975
- Closing costs
- $2,397
- Reserves months
- —
- Total cash needed
- —
Loan-product check · same deal, 3 products live
Conventional
25% down · 7.5% · 30yr
- Down + closing
- —
- Monthly P&I
- —
- Monthly cashflow
- —
- DSCR
- —
- Eligible?
- —
Personal DTI + credit; lowest rate.
DSCR
20% down · 8.5% · 30yr
- Down + closing
- —
- Monthly P&I
- —
- Monthly cashflow
- —
- DSCR
- —
- Eligible?
- —
No personal income docs; deal must DSCR.
Hard money
10% down · 12.0% · 12mo
- Down + closing
- —
- Monthly P&I
- —
- Monthly cashflow
- —
- DSCR
- —
- Eligible?
- —
Short-term bridge; refi at stabilization.
Rent comps 40 comps
| Address | Beds | Baths | Sqft | Rent | $/sqft | DOM | Units | Dist |
|---|---|---|---|---|---|---|---|---|
| 694-696 S Everett Ave Columbus, OH | 2.0 | 1.0 | 896 | $1,195 | $1.33 | 45d | 1 | 0.13mi |
| 3023 Darfield Pl Columbus, OH | 1.0 | 1.0 | 822 | $799 | $0.97 | 25d | 1 | 0.17mi |
| 857 S Waverly St Columbus, OH | 3.0 | 1.0 | 850 | $1,250 | $1.47 | 45d | 1 | 0.32mi |
| 925 S Ashburton Rd Columbus, OH | 3.0 | 1.0 | 963 | $1,500 | $1.56 | 25d | 1 | 0.32mi |
| 3287 E Mound St Columbus, OH | 2.0 | 1.5 | 1100 | $1,300 | $1.18 | 22d | 1 | 0.37mi |
| 461 Eastmoor Blvd Columbus, OH | 2.0 | 1.0 | 1100 | $1,295 | $1.18 | 18d | 1 | 0.38mi |
| 914 S Weyant Ave Columbus, OH | 3.0 | 1.5 | 1089 | $1,099 | $1.01 | 18d | 1 | 0.42mi |
| 849 Byron Ave Columbus, OH | 3.0 | 1.5 | 936 | $1,400 | $1.50 | 9d | 1 | 0.42mi |
| 802 Ruby Ave Columbus, OH | 3.0 | 2.0 | 1004 | $1,875 | $1.87 | 45d | 1 | 0.48mi |
| 892 Ruby Ave Columbus, OH | 2.0 | 2.0 | 1100 | $1,500 | $1.36 | 45d | 1 | 0.51mi |
| 371 Mayfair Blvd Columbus, OH | 1.0 | 1.0 | 680 | $775 | $1.14 | 45d | 1 | 0.54mi |
| 1079 S James Rd Columbus, OH | 2.0 | 1.0 | 768 | $995 | $1.30 | 45d | 1 | 0.56mi |
| 345 Mayfair Blvd Unit A Columbus, OH | 1.0 | 1.0 | 730 | $775 | $1.06 | 25d | 1 | 0.57mi |
| 3540 E Main St Columbus, OH | 2.0 | 1.0 | 914 | $1,074 | $1.18 | 4d | 5 | 0.59mi |
| 902 Kenwick Rd Unit D Columbus, OH | 1.0 | 1.0 | 800 | $899 | $1.12 | 45d | 1 | 0.60mi |
| 323 Mayfair Blvd Columbus, OH | 1.0 | 1.0 | 730 | $775 | $1.06 | 45d | 1 | 0.60mi |
| 416 S Weyant Ave Columbus, OH | 2.0 | 1.0 | 720 | $1,149 | $1.60 | 25d | 1 | 0.62mi |
| 3060 E Livingston Ave Columbus, OH | 1.0 | 1.0 | 772 | $825 | $1.07 | 45d | 3 | 0.62mi |
| 299 Mayfair Blvd Columbus, OH | 1.0 | 1.0 | 680 | $775 | $1.14 | 45d | 1 | 0.64mi |
| 3566 E Main St Unit A15 Whitehall, OH | 1.0 | 1.0 | 575 | $795 | $1.38 | 25d | 1 | 0.64mi |
| 3566 E Main St Whitehall, OH | 1.0 | 1.0 | 575 | $795 | $1.38 | 45d | 1 | 0.64mi |
| 3566 E Main St Whitehall, OH | 1.0 | 1.0 | 575 | $795 | $1.38 | 46d | 1 | 0.64mi |
| 931 Kenwick Rd Apt B Columbus, OH | 1.0 | 1.0 | 700 | $950 | $1.36 | 45d | 1 | 0.65mi |
| 393 Barnett Rd Columbus, OH | 2.0 | 1.5 | 840 | $975 | $1.16 | 25d | 1 | 0.72mi |
| 3103 Clairpoint Ct Columbus, OH | 2.0 | 1.0 | 1000 | $1,060 | $1.06 | 45d | 1 | 0.77mi |
| 301 S Napoleon Ave Unit D Columbus, OH | 2.0 | 1.0 | 860 | $1,000 | $1.16 | 45d | 1 | 0.79mi |
| 301 S Napoleon Ave Unit D Columbus, OH | 2.0 | 1.0 | 860 | $1,000 | $1.16 | 25d | 1 | 0.79mi |
| 281 S Napoleon Ave Columbus, OH | 2.0 | 1.0 | 850 | $900 | $1.06 | 9d | 1 | 0.81mi |
| 3341 E Livingston Ave Columbus, OH | 1.0 | 1.0 | 640 | $1,098 | $1.71 | 45d | 1 | 0.87mi |
| 1303 Barnett Rd Unit 1303 Columbus, OH | 2.0 | 1.0 | 1020 | $1,150 | $1.13 | 13d | 1 | 0.92mi |
| 1317 Barnett Rd Columbus, OH | 3.0 | 1.0 | 1057 | $1,299 | $1.23 | 13d | 1 | 0.94mi |
| 51 Mayfair Blvd Columbus, OH | 2.0 | 1.0 | 869 | $1,232 | $1.42 | 4d | 6 | 0.97mi |
| 1256 Rand Ave Columbus, OH | 2.0 | 1.0 | 967 | $1,299 | $1.34 | 45d | 1 | 1.04mi |
| 3438-3448 E Broad St Columbus, OH | 2.0 | 1.0 | 975 | $800 | $0.82 | 45d | 1 | 1.13mi |
| 3600 Cushing Dr Unit C Columbus, OH | 2.0 | 1.0 | 810 | $900 | $1.11 | 45d | 1 | 1.19mi |
| 57-59 N Waverly St Columbus, OH | 2.0 | 1.0 | 1000 | $1,000 | $1.00 | 22d | 1 | 1.22mi |
| 1246 Arkwood Ave Columbus, OH | 3.0 | 1.0 | 1094 | $1,740 | $1.59 | 45d | 1 | 1.22mi |
| 59 N Waverly St Columbus, OH | 2.0 | 1.0 | 1000 | $1,000 | $1.00 | 22d | 1 | 1.22mi |
| 59 N Waverly St Columbus, OH | 2.0 | 1.0 | 1000 | $1,000 | $1.00 | 9d | 1 | 1.22mi |
| 59 N Waverly St Columbus, OH | 2.0 | 1.0 | 1000 | $1,000 | $1.00 | 21d | 1 | 1.22mi |
Listing history 1 events
-
2026-05-14historical $79,900 345-char remark
ⓘ Source: listings_history table (triggers on properties + properties_extension) + one-shot
backfill from property_details.listing_events for pre-trigger history.
Tax reassessment forecast OH · Partial reset (capped growth)
- Current annual tax
- $3,144 · $262/mo
- Projected year-2 tax
- $3,144 · $262/mo
- Expected delta
- $0/yr ($0/mo · 0.0%)
ⓘ Screening estimate from a state-policy table — verify with the county assessor before closing.
Climate risk First Street
- Flood 1/10 Low FEMA zone X (unshaded) · 0% chance over 30 yrs
- Wildfire 1/10 Low
- Heat 4/10 Moderate 7 d/yr ≥99°F today · 18 d/yr by 30 yrs out
- Wind 2/10 Low 100% chance of damaging wind over 30 yrs
- Air quality 2/10 Low 1 unhealthy d/yr today · 3 by 30 yrs out
Nearby sold comps map
Loading sold comps map…
Walkable amenities ~0.75 mi
Loading nearby amenities…
Taxation est. · year 1
- Rental income
- $13,616
- − Mortgage interest
- −$4,476
- − Property taxes
- −$3,144
- − Insurance
- −$400
- − Repairs & maintenance
- −$1,089
- − Management
- −$1,089
- − Depreciation
- −$2,324
- Taxable income
- $1,094
- Est. tax owed @ 24.0%
- −$263
- After-tax cash flow
- $1,923/yr
For passive investors: Depreciation is non-cash, so a rental often shows a tax loss while cash-flowing — sheltering income. Rental losses are passive: they offset passive income freely, and up to $25,000/yr can offset ordinary (W-2) income if you actively participate and your MAGI is under $100k (phasing out to $0 by $150k); unused losses carry forward. On sale, claimed depreciation is recaptured at up to 25%, and gains may owe capital-gains tax (a 1031 exchange can defer both). Figures are a year-1 estimate at your 24.0% rate — not tax advice; consult a CPA.
Schools (NCES district)
- District
- Columbus City School District
- NCES district ID
- 3904380
- Math proficiency
- 15% ▼ -17.00%
- Reading proficiency
- 26% ▼ -12.00%
- Median HH income
- $38,483
- Composite
- 17.19/100
- National rank
- #9105
- State rank
- #626 of 656 in OH
Livability — Columbus
- Score
- 81/100
- State rank
- #97
- US rank
- #1491
Category grades
Schools grade is shown separately in the Schools card above.
Census & demographics
- Census place
- Columbus, OH
- County
- Franklin County · 1,351,780 people
- City population
- 612,189
- Metro
- Columbus, OH
- Population (ZIP)
- 36,273
- Household income
- $54,704
- Rent vs Own
- Severe rent burden
- 2583.0
Population outlook (Franklin County) Hauer SSP2
- Today (2025)
- 1,456,139 people
- By 2030
- 1,556,890 · +6.9%
- By 2040
- 1,757,349 · +20.7%
- By 2050
- 1,950,539 · +34.0%
- By 2075
- 2,376,171 · +63.2%
- By 2100
- 2,636,796 · +81.1%
Race, ethnicity, and origin ACS 2023
- Neighborhood character
- Diverse neighborhood (Simpson 0.66)
- Race & ethnicity
- Black 45% White 36% Hispanic / Latino 10% Two or more races 9% Asian 3%
- Hispanic origin (detail)
- Mexican 4% Puerto Rican 2%
- Common ancestry
- Romanian 2% Slovak 1% Lithuanian 1%
- Foreign-born
- 15% · Canada, China
- Languages at home
- 79% English-only · Spanish 8% Other Indo-European 1% French/Haitian/Cajun 1%
Political lean MEDSL · Franklin
- 2024 margin
- Strong D (+28.4) · D 63.7% · R 35.3% · Other 1.0%
- 2008→2024 swing
- +7.7pp toward D · 2008: 20.7pp · 2024: 28.4pp
- All cycles
- 2024: D+28.4 2020: D+31.4 2016: D+25.9 2012: D+21.7 2008: D+20.7
Not yet ingested
- Civics
- —
Market trends
- HPI YoY
- ▼ -243.35%
- Current HPI
- 198.5072
- Rent YoY
- ▲ 2.29%
- Metro
- Columbus, OH
- State GDP YoY
- ▲ 1.98%
- F500 in state
- 48
Industry mix (Fortune 500 HQ in OH)
| Industry | F500 HQs | Revenue |
|---|---|---|
| Insurance | 3 | $145B |
|
||
| Industrial Machinery | 3 | $49B |
|
||
| Financial Services | 3 | $24B |
|
||
| Consumer Goods | 2 | $93B |
|
||
| Aerospace / Defense | 2 | $47B |
|
||
| Utilities | 2 | $33B |
|
||
Price history
+0.0% since first listed5 events — show timeline
- 2026-06-08 Sold (MLS) $79,900 CBRMLS
- 2026-05-23 Pending — CBRMLS
- 2026-05-19 Listed $79,900 CBRMLS
- 2026-05-15 Sold (Public Records) $44,500 Public Records
- 2026-05-14 Coming Soon $79,900 CBRMLS
Property tax history
+14.4%/yrLatest (2024): $3,144 · +7.9% YoY. Source: county tax records.
Cash-flow waterfall
monthlySold comps — $/sqft
last 12 mo · ≤1 miLoading sold comps…