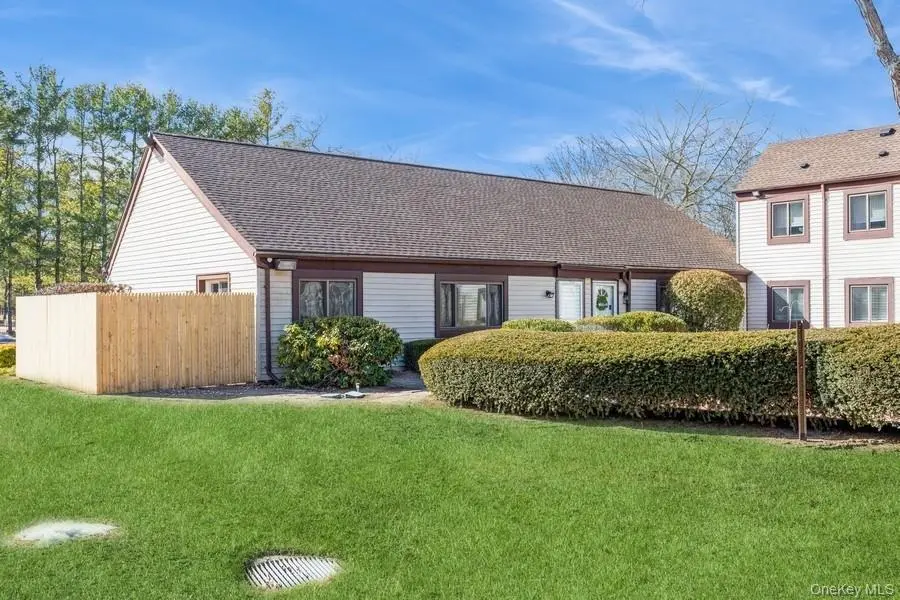
524 Picasso Way #524 · Middle Island, NY
Flood risk No data
- FEMA flood zone
- —
- Chance of flooding over 30 yrs
- —
- Est. flood insurance / yr
- —
Fire risk No data
- Est. fire insurance / yr
- —
Heat risk No data
- Hot days now (above threshold)
- —
- Hot days in 30 yrs
- —
Wind risk No data
- Chance of severe wind over 30 yrs
- —
Air-quality risk No data
- Unhealthy air days now
- —
- Unhealthy air days in 30 yrs
- —
Risk factors via First Street. Map © Google.
Why this score? — see what drove the C- grade
The composite is a weighted blend of 9 inputs, each scored 0–100. Each bar is that input's sub-score; the figure is the points it added to the 100-point composite (weight × sub-score).
- Cash flow +19.7/30.0
- ARV discount +8.7/15.0
- DSCR +6.2/10.0
- 1% rule +5.2/10.0
- Schools +5.2/10.0
- Condition / age +4.0/5.0
- Livability +3.2/5.0
- Rent growth +2.5/5.0
- Appreciation +0.0/10.0
$239,000
🖨 Deal sheet 📄 Offer letter ✓ Due diligence
Listing remarks MLS
This is a Fannie Mae Homepath Property! Totally renovated 1 bedroom 1 bath co-op. New kitchen, bath, paint, carpet and appliances. Move in ready. CAC, side fenced patio. Community offers pool, clubhouse, recreation facilities and tennis. Close to restaurants and shopping.
Key facts
- New bath
- New kitchen
- Side fenced patio
Tags
Neighborhood map
What this means for you Summary
Snapshot
- This is a 1-bed/1.0-bath condo listed at $239k. Condition is rated good.
Deal economics
- At list price, monthly cash flow is $278 ($3k/yr) — positive.
- The deal already cash-flows at list — no discount required.
- Meets the 1% rule at list price ($2k rent vs $239k).
- Recommended offer: $225k (6.0% below list) — sets the bar for market timing.
- Cap rate 7.7% vs local median 3.3% in Middle Island — top-decile yield for the area; either an underpriced asset or a hidden risk that comps aren't pricing in. Stress-test before assuming the spread holds.
Location & tenants
- Location reads 65/100 on livability (#703 in NY) — a middle-class / working-renter tenant base. Strengths: employment A+, housing A+; Watch: crime C-, amenities F, commute F.
- Longwood Central School District (rural): math 61% / reading 55% proficiency, ranked #235 of 590 in NY (top 40%) — acceptable for families but not a draw, mixed tenant base, ~2y average lease.
- Market conditions: 122 active listings in the ZIP; 7 comparable units currently listed for rent nearby; rentals lingering (median 44d on market — plan ~5-8 weeks vacancy on turnover, expect pricing pressure); 100% of comp listings sitting > 30 days — soft ceiling on asking rent; 1,366 units permitted in Suffolk County in 2024 (216 in 5+ unit buildings).
Forward outlook
- Local home prices are declining (-3.0%/yr); year-one equity from $2k of loan paydown is wiped out by about $7k of value loss. Plan a longer hold.
- Suffolk County population projected to shrink 5% by 2050 — rents likely to lag national; underwrite the cash flow, not the appreciation.
Negotiation context
- It's been on market 63 days — a 6% lower offer ($225k) is reasonable based on typical stale-listing flexibility.
- 4 sale attempts since 4y ago; this cycle's ask has dropped $36k (13%) from the opening price — seller is motivated, your offer sets the floor, not the list.
- Current owner paid $175k; 37% above their basis — modest negotiation headroom, anchor on the comps not their cost.
Questions for the listing agent
- It's been on market 63 days. Have you received any prior offers? Is the seller open to a 6% concession, seller financing, or rate buy-down credit?
- Built in 1974 — when were the roof, HVAC, electrical panel, plumbing, and water heater last replaced?
- Any open or pending special assessments — roof, HVAC, plumbing, elevator, façade? What's the per-unit balance and payoff schedule, and is the seller paying it off at close or rolling it to the buyer?
- Why hasn't it sold? Are there any deal-killer items the seller is aware of (foundation, flood, title, zoning, code violations)?
- Is there a deadline driving the sale (1031 exchange, divorce, estate, relocation)? That informs how much negotiation room exists.
- Schools are B-rated — typically a magnet for longer-tenancy family renters. What's the average tenant stay here, and is there a school-zone premium baked into asking?
- What's the average days-on-market for RENTAL listings here right now (not sales)? A rising rental-DOM trend means longer vacancies and softer asking-rent achievability than the comps imply.
- What's the recent tenant-quality profile in this submarket — average credit score on applications, eviction rate, late-payment / NSF rate, and stable-employment percentage? A property-management company in the area should have these aggregated.
- How much new apartment / multifamily construction is in the pipeline within 1–3 miles? Heavy new supply (>2% of stock underway) typically softens rents 12–24 months out; light construction supports rent growth.
Investment metrics
- 1% rule
- 1.02% ✓
- Cap rate
- 7.69%
- Cash-on-cash
- 4.99%
- DSCR
- 1.22
- GRM
- 8.2
CMA / ARV
- ARV (median comp)
- $245,697
- List price
- $239,000
- Delta
- -2.73%
- Verdict
- FAIR
- Comps
- 20 within 1.0 mi
Projected returns pro-forma
-3.0% appreciation · 3.0% rent growth · sell at horizon
- IRR
- -8.5%
- Equity multiple
- 0.69×
- Total profit
- $-20,980
- Equity at exit
- $35,636
- IRR
- 1.0%
- Equity multiple
- 1.07×
- Total profit
- $4,686
- Equity at exit
- $20,664
Cash invested: $66,920 (down + closing). Projections, not guarantees.
Landlord ↔ Tenant lean methodology
- Overall (STATE)
- 15 Strongly Tenant-Friendly
- State New York
- 15 Strongly Tenant-Friendly · D+10
- County
- — inherits STATE
- City
- — inherits STATE
ZIP-level market 11953
- Home prices YoY
- -20.2%
- Active inventory
- 122
- Price-to-rent
- 8.2×
Monthly cashflow live
- Estimated rent
- $2,443 high interval (Pro) →
- Mortgage (P&I)
- −$1,253
- Tax est. 1.5%
- −$299 /mo · $3,585/yr
- Insurance
- −$100
- HOA
- −$0
- Vacancy / Maint / Mgmt
- −$513
- Net cashflow
- $278
Break-even live
UW: 25.0% down · 7.5% · 30yr · 1.5% tax · 5.0% vac · 8.0% maint · 8.0% mgmt
Financing live
Cash to close
- Down payment
- $59,750
- Closing costs
- $7,170
- Reserves months
- —
- Total cash needed
- —
Loan-product check · same deal, 3 products live
Conventional
25% down · 7.5% · 30yr
- Down + closing
- —
- Monthly P&I
- —
- Monthly cashflow
- —
- DSCR
- —
- Eligible?
- —
Personal DTI + credit; lowest rate.
DSCR
20% down · 8.5% · 30yr
- Down + closing
- —
- Monthly P&I
- —
- Monthly cashflow
- —
- DSCR
- —
- Eligible?
- —
No personal income docs; deal must DSCR.
Hard money
10% down · 12.0% · 12mo
- Down + closing
- —
- Monthly P&I
- —
- Monthly cashflow
- —
- DSCR
- —
- Eligible?
- —
Short-term bridge; refi at stabilization.
Rent comps 7 comps
| Address | Beds | Baths | Sqft | Rent | $/sqft | DOM | Units | Dist |
|---|---|---|---|---|---|---|---|---|
| 135 Lake Pointe Ct Unit 135 Middle Island, NY | 1.0 | 1.0 | 695 | $2,405 | $3.46 | 43d | 1 | 0.27mi |
| 130 Lake Pointe Ct Unit 130 Brookhaven, NY | 2.0 | 1.0 | 740 | $2,435 | $3.29 | 43d | 1 | 0.28mi |
| 465 Lake Pointe Dr Unit 465 Middle Island, NY | 1.0 | 1.0 | 695 | $2,405 | $3.46 | 43d | 1 | 0.32mi |
| 463 Lake Pointe Dr Unit 463 Middle Island, NY | 1.0 | 1.0 | 695 | $2,555 | $3.68 | 44d | 1 | 0.33mi |
| 356 Lake Pointe Dr Unit 356 Middle Island, NY | 2.0 | 1.0 | 740 | $2,435 | $3.29 | 44d | 1 | 0.36mi |
| 444 Lake Pointe Dr Unit 444 Middle Island, NY | 2.0 | 1.0 | 740 | $2,435 | $3.29 | 43d | 1 | 0.40mi |
| 462 Lake Pointe Dr Unit 462 Middle Island, NY | 2.0 | 1.0 | 740 | $2,435 | $3.29 | 43d | 1 | 0.41mi |
HOA detail condo
- Monthly dues
- $0 · $0/yr
- Likely covers
- pool
- Assessments
- None detected in remarks — confirm with the listing agent.
Listing history 25 events
-
2026-06-18days on market $239,000 Active 63 DOM
-
2026-06-17days on market $239,000 Active 62 DOM
-
2026-06-16pricedays on market $239,000 Active 61 DOM
-
2026-06-15days on market $255,000 Active 60 DOM
-
2026-06-13days on market $255,000 Active 58 DOM
-
2026-06-13days on market $255,000 Active 57 DOM
-
2026-06-09days on market $255,000 Active 54 DOM
-
2026-06-08days on market $255,000 Active 53 DOM
-
2026-06-07days on market $255,000 Active 52 DOM
-
2026-06-04days on market $255,000 Active 49 DOM
-
2026-06-03days on market $255,000 Active 48 DOM
-
2026-06-02days on market $255,000 Active 47 DOM
-
2026-06-01days on market $255,000 Active 46 DOM
-
2026-05-31days on market $255,000 Active 45 DOM
-
2026-05-15price $255,000 272-char remark
Show marketing remark (272 chars)
This is a Fannie Mae Homepath Property! Totally renovated 1 bedroom 1 bath co-op. New kitchen, bath, paint, carpet and appliances. Move in ready. CAC, side fenced patio. Community offers pool, clubhouse, recreation facilities and tennis. Close to restaurants and shopping.
-
2026-04-16$275,000 Active 272-char remark
Show marketing remark (272 chars)
This is a Fannie Mae Homepath Property! Totally renovated 1 bedroom 1 bath co-op. New kitchen, bath, paint, carpet and appliances. Move in ready. CAC, side fenced patio. Community offers pool, clubhouse, recreation facilities and tennis. Close to restaurants and shopping.
-
2025-04-24historical
-
2025-04-14status Active
-
2025-03-23status Pending
-
2025-03-05$275,000 Active
-
2022-06-30soldstatus $175,000 Closed
-
2022-04-19status Pending
-
2022-04-09historical
-
2022-03-26$149,990 Active
-
2022-03-21historical $149,990
ⓘ Source: listings_history table (triggers on properties + properties_extension) + one-shot
backfill from property_details.listing_events for pre-trigger history.
Nearby sold comps map
Loading sold comps map…
Walkable amenities ~0.75 mi
Loading nearby amenities…
Taxation est. · year 1
- Rental income
- $29,313
- − Mortgage interest
- −$13,388
- − Property taxes
- −$3,585
- − Insurance
- −$1,195
- − Repairs & maintenance
- −$2,345
- − Management
- −$2,345
- − Depreciation
- −$6,953
- Taxable loss
- −$498
- Est. tax savings @ 24.0%
- +$119
- After-tax cash flow
- $3,456/yr
For passive investors: Depreciation is non-cash, so a rental often shows a tax loss while cash-flowing — sheltering income. Rental losses are passive: they offset passive income freely, and up to $25,000/yr can offset ordinary (W-2) income if you actively participate and your MAGI is under $100k (phasing out to $0 by $150k); unused losses carry forward. On sale, claimed depreciation is recaptured at up to 25%, and gains may owe capital-gains tax (a 1031 exchange can defer both). Figures are a year-1 estimate at your 24.0% rate — not tax advice; consult a CPA.
Condition & rehab AI · 12 photos
This fully renovated 1-bedroom 1-bath condo is move-in ready with a fresh paint job, new kitchen and bathroom, and a well-maintained exterior. It offers a good return on investment with potential for further updates to increase its value.
Value-add opportunities
- Both Painting the exterior and interior walls — Fresh paint can enhance curb appeal and interior aesthetics
- Both Replacing carpet with hardwood or tile flooring — Hardwood or tile flooring can increase both resale and rental value
- Both Upgrading the kitchen appliances — Modern appliances can attract more buyers and renters
- Both Adding a smart home system — Smart home features can increase both resale and rental value
Renovation cost estimate screening
Value-add ROI direction
- Both Painting the exterior and interior walls — Fresh paint can enhance curb appeal and interior aesthetics ↑
- Both Replacing carpet with hardwood or tile flooring — Hardwood or tile flooring can increase both resale and rental value ↑
- Both Upgrading the kitchen appliances — Modern appliances can attract more buyers and renters ↑
- Both Adding a smart home system — Smart home features can increase both resale and rental value ↑
ⓘ Cost ranges are severity-bucket heuristics (US national rule-of-thumb). Get contractor quotes + a written scope before underwriting a rehab budget.
Schools (NCES district)
- District
- Longwood Central School District
- NCES district ID
- 3619230
- Math proficiency
- 61% ▬ 0.00%
- Reading proficiency
- 55% ▼ -1.00%
- Median HH income
- $72,748
- Composite
- 51.63/100
- National rank
- #1703
- State rank
- #235 of 590 in NY
Livability — Middle Island
- Score
- 65/100
- State rank
- #703
- US rank
- #13264
Category grades
Schools grade is shown separately in the Schools card above.
Census & demographics
- Census place
- Middle Island, NY
- City population
- 13,383
- Population (ZIP)
- 13,383
Population outlook (Suffolk County) Hauer SSP2
- Today (2025)
- 1,505,262 people
- By 2030
- 1,498,318 · -0.5%
- By 2040
- 1,471,101 · -2.3%
- By 2050
- 1,424,848 · -5.3%
- By 2075
- 1,337,157 · -11.2%
- By 2100
- 1,217,720 · -19.1%
Race, ethnicity, and origin ACS 2023
- Neighborhood character
- Majority White (65%)
- Race & ethnicity
- White 65% Hispanic / Latino 16% Black 15% Two or more races 7%
- Hispanic origin (detail)
- Mexican 2% Puerto Rican 6% Dominican 3%
- Common ancestry
- Romanian 4% Hispanic 2% Scotch-Irish 1%
- Foreign-born
- 12% · Canada, Jamaica, China
- Languages at home
- 87% English-only · Spanish 7% Russian/Polish/Slavic 2% French/Haitian/Cajun 2%
Political lean MEDSL · Suffolk
- 2024 margin
- Lean R (+10.0) · D 45.0% · R 55.0%
- 2008→2024 swing
- -16.0pp toward R · 2008: 6.0pp · 2024: -10.0pp
- All cycles
- 2024: R+10.0 2020: R+0.0 2016: R+8.2 2012: D+2.9 2008: D+6.0
Not yet ingested
- Civics
- —
Market trends
- HPI YoY
- ▼ -90.61%
- Current HPI
- 358.0686
- Rent YoY
- —
- Metro
- —
- State GDP YoY
- ▲ 2.60%
- F500 in state
- 92
Industry mix (Fortune 500 HQ in NY)
| Industry | F500 HQs | Revenue |
|---|---|---|
| Financial Services | 10 | $950B |
|
||
| Consumer Goods | 9 | $162B |
|
||
| Insurance | 4 | $225B |
|
||
| Telecommunications | 2 | $144B |
|
||
| Pharmaceuticals | 2 | $112B |
|
||
| Media / Entertainment | 2 | $69B |
|
||
Price history
+70.0% since first listed11 events — show timeline
- 2026-05-15 Price Changed $255,000 OneKey® MLS as Distributed by MLS Grid
- 2026-04-16 Listed $275,000 OneKey® MLS as Distributed by MLS Grid
- 2025-04-24 Listing Removed — OneKey® MLS as Distributed by MLS Grid
- 2025-04-14 Relisted — OneKey® MLS as Distributed by MLS Grid
- 2025-03-23 Pending — OneKey® MLS as Distributed by MLS Grid
- 2025-03-05 Listed $275,000 OneKey® MLS as Distributed by MLS Grid
- 2022-06-30 Sold (MLS) $175,000 OneKey® MLS as Distributed by MLS Grid
- 2022-04-19 Pending — OneKey® MLS as Distributed by MLS Grid
- 2022-04-09 Listing Removed — OneKey® MLS as Distributed by MLS Grid
- 2022-03-26 Listed $149,990 OneKey® MLS as Distributed by MLS Grid
- 2022-03-21 Coming Soon $149,990 OneKey® MLS as Distributed by MLS Grid
Cash-flow waterfall
monthlySold comps — $/sqft
last 12 mo · ≤1 miLoading sold comps…