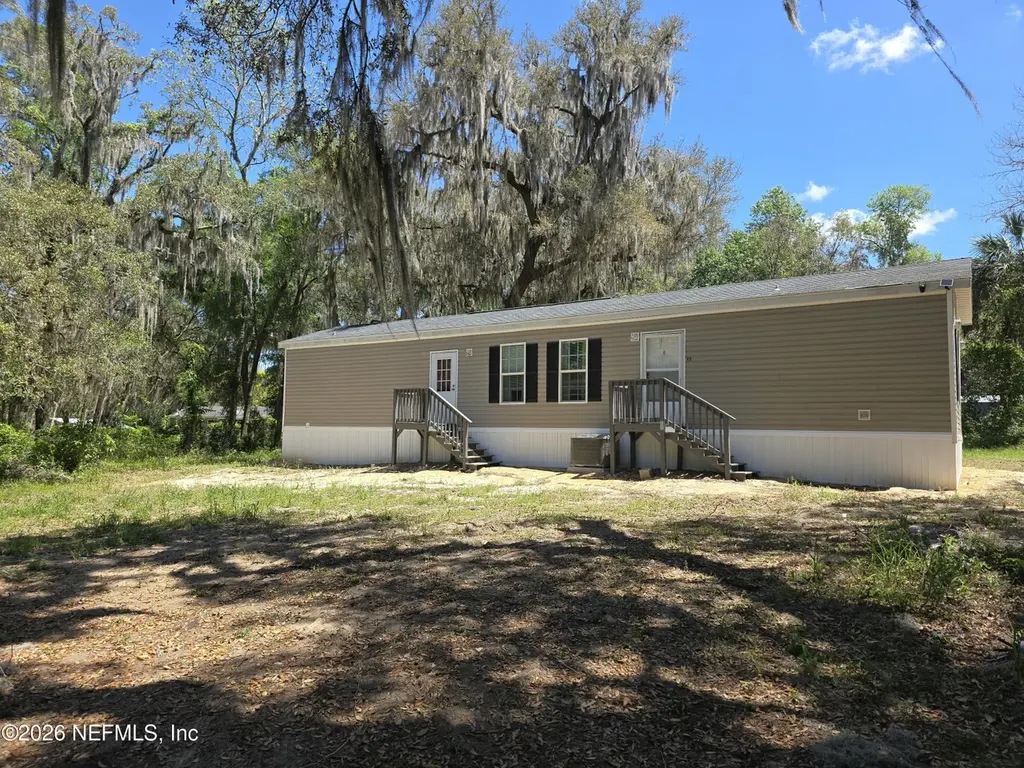
106 W Manitoba St · Interlachen, FL
Flood risk 1/10 · Minimal
- FEMA flood zone
- X (unshaded)
- Chance of flooding over 30 yrs
- 0.0%
- Est. flood insurance / yr
- $507 – $1,088
Fire risk 8/10 · Major
- Est. fire insurance / yr
- $947 – $1,759
Heat risk 8/10 · Major
- Hot days now (above 109°F)
- 7 days/yr
- Hot days in 30 yrs
- 20 days/yr
Wind risk 9/10 · Severe
- Chance of severe wind over 30 yrs
- 99.0%
Air-quality risk 2/10 · Minimal
- Unhealthy air days now
- 2 days/yr
- Unhealthy air days in 30 yrs
- 2 days/yr
Risk factors via First Street. Map © Google.
Why this score? — see what drove the C+ grade
The composite is a weighted blend of 9 inputs, each scored 0–100. Each bar is that input's sub-score; the figure is the points it added to the 100-point composite (weight × sub-score).
- Cash flow +20.9/30.0
- ARV discount +10.5/15.0
- Appreciation +6.7/10.0
- DSCR +6.6/10.0
- 1% rule +4.7/10.0
- Livability +3.4/5.0
- Schools +3.0/10.0
- Rent growth +2.5/5.0
- Condition / age +2.5/5.0
$119,500
🖨 Deal sheet (PDF) 📄 Offer letter ✓ Due diligence
Listing remarks
Beautiful oak trees & Convivence! Own a beautiful, fully updated 2-bedroom 2 bath single-wide on a private . 6-acre lot surrounded by mature oaks. Remodeled inside--move-in ready! Enjoy peaceful, low-maintenance living with easy, short commutes to both Gainesville and St. Augustine. No HOA. Great location! Seller offering $1500moving credit with On Time Moving.
Key facts
- Private lot
- Mature oaks
- Great location
Tags
Property features AI
Finance
- HOA & community: Not a senior community
Exterior
- Parking: Carport; Other parking
- Utilities: Septic tank; Electricity connected
- Home design: Single wide mobile home; One story; Property is attached
- Exterior features: Private road frontage; 0.6-acre lot
Interior
- Kitchen: Dishwasher; Electric oven; Refrigerator
- Bedrooms: 2 bedrooms (both on the main level)
- Flooring: Laminate
- Bathrooms: 2 full bathrooms
- Heating & cooling: Central heating; Central air conditioning
- Interior features: Kitchen island; Split bedroom layout; Walk-in closet(s)
- Laundry & utility: Washer hookup; Electric dryer hookup
Neighborhood map
What this means for you Summary
Snapshot
- This is a 2-bed/2.0-bath manufactured listed at $120k.
Deal economics
- At list price, monthly cash flow is $166 ($2k/yr) — positive.
- The deal already cash-flows at list — no discount required.
- To meet the 1% rule (rent ≥ 1% of price), the offer needs to be $116k (2.7% below list).
- Recommended offer: $112k (6.0% below list) — sets the bar for market timing.
- Cap rate 8.0% vs local median 5.1% in Interlachen — top-decile yield for the area; either an underpriced asset or a hidden risk that comps aren't pricing in. Stress-test before assuming the spread holds.
Location & tenants
- Location reads 67/100 on livability (#540 in FL) — a middle-class / working-renter tenant base. Strengths: crime A+, cost of living A+, housing A+; Watch: amenities F, commute F, employment F.
- Putnam (town): math 34% / reading 39% proficiency, ranked #66 of 73 in FL (top 90%) — families likely to look elsewhere, expect single-tenant / working-renter base with shorter leases; 71% free/reduced lunch — lower-income household profile, screen leases tightly.
- Zoned schools: Melrose Elementary School (math 62% / reading 57%, grade B-, #690 of 2,144 statewide, top 34%, 376 students, 49% FRL); Putnam Academy of Arts And Sciences (math 42% / reading 52%, grade D+, #291 of 571 statewide, top 52%, 177 students, 75% FRL, charter); Interlachen Jr-Sr High School (math 16% / reading 32%, grade F, #529 of 667 statewide, top 80%, 1,097 students, 71% FRL).
- Market conditions: 111 active listings in the ZIP; 113 units permitted in Putnam County in 2024 (0 in 5+ unit buildings).
Forward outlook
- In year one you build about $5k of equity ($826 loan paydown + $4k appreciation (3.4% local appreciation)).
- Putnam County population projected at -31% by 2050 — secular population decline; favor cash flow + early exit over multi-decade hold.
- At projected returns (3.4% appreciation + 3.0% rent growth), your $33k cash investment doubles in ~5 years — after that, you're playing with house money.
- By year 7, paydown + projected appreciation supports a ~$31k cash-out refi (75% LTV) — recoverable capital for the next deal without selling this one.
Negotiation context
- It's been on market 69 days — a 6% lower offer ($112k) is reasonable based on typical stale-listing flexibility.
Risks & watch-outs
- Climate carrying-cost: severe wind risk, 99% chance of damaging wind over 30y; severe wildfire risk; extreme-heat days projected 7→20/yr by 2055 (HVAC capex compounding) — expect insurance premiums to compound above CPI over the hold.
Questions for the listing agent
- It's been on market 69 days. Have you received any prior offers? Is the seller open to a 6% concession, seller financing, or rate buy-down credit?
- Why hasn't it sold? Are there any deal-killer items the seller is aware of (foundation, flood, title, zoning, code violations)?
- Is there a deadline driving the sale (1031 exchange, divorce, estate, relocation)? That informs how much negotiation room exists.
- Schools are D-rated, which usually means shorter tenancies and higher turnover. Who's the typical renter profile here, and what's been the actual vacancy rate?
- What's the average days-on-market for RENTAL listings here right now (not sales)? A rising rental-DOM trend means longer vacancies and softer asking-rent achievability than the comps imply.
- What's the recent tenant-quality profile in this submarket — average credit score on applications, eviction rate, late-payment / NSF rate, and stable-employment percentage? A property-management company in the area should have these aggregated.
- How much new for-sale + rental construction is in the pipeline within 1–3 miles? Heavy new supply typically softens prices + rents 12–24 months out; constrained supply supports both.
Investment metrics
- 1% rule
- 0.97% ✗
- Cap rate
- 7.96%
- Cash-on-cash
- 5.95%
- DSCR
- 1.26
- GRM
- 8.6
CMA / ARV
- ARV (on-the-fly)
- $128,128
- Comps found
- 1
Show comp detail 1 sale within ~0.75 mi
| Address | Dist | Beds/Ba | Sqft | Sold | Price | $/sf | Match |
|---|---|---|---|---|---|---|---|
| 203 S Olive Ave | 0.69mi | 3/2.0 (+1) | 1,294 (+5%) | 23mo | $135,000 | $104 | 35 |
Match score weights: distance 35% · size 25% · config 20% · recency 20%. Top-matched comps best support the ARV.
Projected returns pro-forma
3.43% appreciation · 3.0% rent growth · sell at horizon
- IRR
- 14.1%
- Equity multiple
- 1.83×
- Total profit
- $27,676
- Equity at exit
- $56,647
- IRR
- 15.7%
- Equity multiple
- 3.40×
- Total profit
- $80,361
- Equity at exit
- $89,637
Cash invested: $33,460 (down + closing). Projections, not guarantees.
Landlord ↔ Tenant lean methodology
- Overall (STATE)
- 87 Strongly Landlord-Friendly
- State Florida
- 87 Strongly Landlord-Friendly · R+3
- County
- — inherits STATE
- City
- — inherits STATE
ZIP-level market 32140
- Home prices YoY
- 1.6%
- Active inventory
- 111
- Price-to-rent
- 8.6×
Monthly cashflow live
- Estimated rent
- $1,163 medium interval (Pro) →
- Mortgage (P&I)
- −$627
- Tax from tax record
- −$77 /mo · $918/yr
- Insurance
- −$50
- HOA
- −$0
- Vacancy / Maint / Mgmt
- −$244
- Net cashflow
- $166
Break-even live
Sensitivity live
| Price | -10% $234 | -5% $200 | +0% $166 | +5% $132 | +10% $98 |
|---|---|---|---|---|---|
| Rent | -10% $74 | -5% $120 | +0% $166 | +5% $212 | +10% $258 |
| Rate | -1.0pp $226 | -0.5pp $196 | base $166 | +0.5pp $135 | +1.0pp $103 |
UW: 25.0% down · 7.5% · 30yr · 1.5% tax · 5.0% vac · 8.0% maint · 8.0% mgmt
Financing live
Cash to close
- Down payment
- $29,875
- Closing costs
- $3,585
- Reserves months
- —
- Total cash needed
- —
Loan-product check · same deal, 3 products live
Conventional
25% down · 7.5% · 30yr
- Down + closing
- —
- Monthly P&I
- —
- Monthly cashflow
- —
- DSCR
- —
- Eligible?
- —
Personal DTI + credit; lowest rate.
DSCR
20% down · 8.5% · 30yr
- Down + closing
- —
- Monthly P&I
- —
- Monthly cashflow
- —
- DSCR
- —
- Eligible?
- —
No personal income docs; deal must DSCR.
Hard money
10% down · 12.0% · 12mo
- Down + closing
- —
- Monthly P&I
- —
- Monthly cashflow
- —
- DSCR
- —
- Eligible?
- —
Short-term bridge; refi at stabilization.
Listing history 17 events
-
2026-06-21days on market $119,500 Active 69 DOM
-
2026-06-18days on market $119,500 Active 66 DOM
-
2026-06-17days on market $119,500 Active 65 DOM
-
2026-06-16pricedays on market $119,500 Active 64 DOM
-
2026-06-15days on market $119,900 Active 63 DOM
-
2026-06-13days on market $119,900 Active 61 DOM
-
2026-06-09days on market $119,900 Active 57 DOM
-
2026-06-08days on market $119,900 Active 56 DOM
-
2026-06-07days on market $119,900 Active 55 DOM
-
2026-06-05days on market $119,900 Active 52 DOM
-
2026-06-03days on market $119,900 Active 51 DOM
-
2026-06-02days on market $119,900 Active 50 DOM
-
2026-06-01days on market $119,900 Active 49 DOM
-
2026-05-31days on market $119,900 Active 48 DOM
-
2026-05-20price $119,900
-
2026-04-29price $127,900
-
2026-04-13$129,900 Active
ⓘ Source: listings_history table (triggers on properties + properties_extension) + one-shot
backfill from property_details.listing_events for pre-trigger history.
Tax reassessment forecast FL · Resets to sale price
- Current annual tax
- $918 · $77/mo
- Projected year-2 tax
- $992 · $83/mo
- Expected delta
- +$73/yr (+$6/mo · 8.0%)
ⓘ Screening estimate from a state-policy table — verify with the county assessor before closing.
Climate risk First Street
- Flood 1/10 Low FEMA zone X (unshaded) · 0% chance over 30 yrs
- Wildfire 8/10 Severe
- Heat 8/10 Severe 7 d/yr ≥109°F today · 20 d/yr by 30 yrs out
- Wind 9/10 Extreme 99% chance of damaging wind over 30 yrs
- Air quality 2/10 Low 2 unhealthy d/yr today · 2 by 30 yrs out
Nearby sold comps map
Loading sold comps map…
Walkable amenities ~0.75 mi
Loading nearby amenities…
Taxation est. · year 1
- Rental income
- $13,958
- − Mortgage interest
- −$6,694
- − Property taxes
- −$918
- − Insurance
- −$598
- − Repairs & maintenance
- −$1,117
- − Management
- −$1,117
- − Depreciation
- −$3,476
- Taxable income
- $39
- Est. tax owed @ 24.0%
- −$9
- After-tax cash flow
- $1,982/yr
For passive investors: Depreciation is non-cash, so a rental often shows a tax loss while cash-flowing — sheltering income. Rental losses are passive: they offset passive income freely, and up to $25,000/yr can offset ordinary (W-2) income if you actively participate and your MAGI is under $100k (phasing out to $0 by $150k); unused losses carry forward. On sale, claimed depreciation is recaptured at up to 25%, and gains may owe capital-gains tax (a 1031 exchange can defer both). Figures are a year-1 estimate at your 24.0% rate — not tax advice; consult a CPA.
Schools (NCES district)
- District
- Putnam
- NCES district ID
- 1201620
- Math proficiency
- 34% ▼ -10.00%
- Reading proficiency
- 39% ▼ -4.00%
- Median HH income
- $33,350
- Composite
- 29.99/100
- National rank
- #6361
- State rank
- #66 of 73 in FL
Livability — Interlachen
- Score
- 67/100
- State rank
- #540
- US rank
- #10162
Category grades
Schools grade is shown separately in the Schools card above.
Census & demographics
- City population
- 11,580
- Population (ZIP)
- 1,558
Population outlook (Putnam County) Hauer SSP2
- Today (2025)
- 65,299 people
- By 2030
- 61,255 · -6.2%
- By 2040
- 52,930 · -18.9%
- By 2050
- 45,051 · -31.0%
- By 2075
- 28,720 · -56.0%
- By 2100
- 15,852 · -75.7%
Race, ethnicity, and origin ACS 2023
- Neighborhood character
- Predominantly White (86%)
- Race & ethnicity
- White 86% Two or more races 7% Black 5% Hispanic / Latino 2%
- Common ancestry
- Lithuanian 3% Romanian 2% Italian 2%
- Languages at home
- 98% English-only · Spanish 2%
Political lean MEDSL · Putnam
- 2024 margin
- Solid R (+47.8) · D 25.8% · R 73.6%
- 2008→2024 swing
- -28.5pp toward R · 2008: -19.3pp · 2024: -47.8pp
- All cycles
- 2024: R+47.8 2020: R+41.2 2016: R+36.6 2012: R+24.5 2008: R+19.3
Not yet ingested
- Civics
- —
Market trends
- HPI YoY
- ▲ 3.43%
- Current HPI
- 214.5041
- Rent YoY
- —
- Metro
- —
- State GDP YoY
- ▲ 3.28%
- F500 in state
- 36
Industry mix (Fortune 500 HQ in FL)
| Industry | F500 HQs | Revenue |
|---|---|---|
| Industrial Technology | 2 | $29B |
|
||
| Insurance | 2 | $17B |
|
||
| Retail | 1 | $60B |
|
||
| Technology Distribution | 1 | $58B |
|
||
| Homebuilding | 1 | $35B |
|
||
| Technology Manufacturing | 1 | $35B |
|
||
Price history
-7.7% since first listed3 events — show timeline
- 2026-05-20 Price Changed $119,900 realMLS
- 2026-04-29 Price Changed $127,900 realMLS
- 2026-04-13 Listed $129,900 realMLS
Property tax history
+4.3%/yrLatest (2025): $918 · -29.2% YoY. Source: county tax records.
Cash-flow waterfall
monthlySold comps — $/sqft
last 12 mo · ≤1 miLoading sold comps…