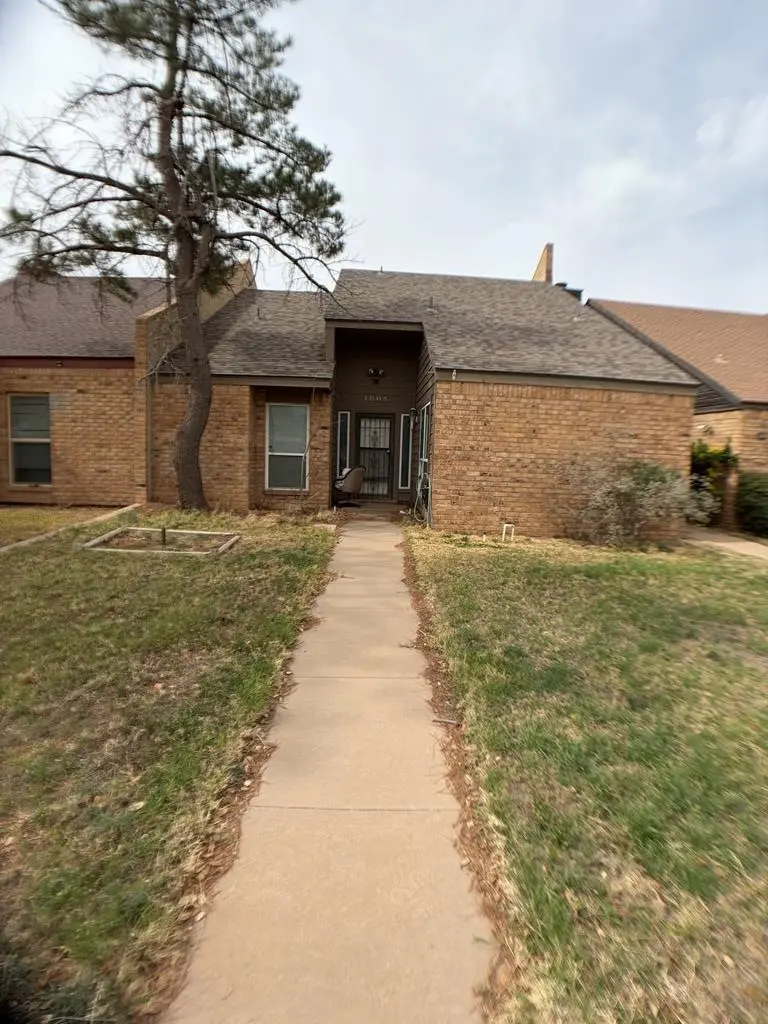
1005 Godfrey St · Midland, TX
Flood risk 1/10 · Minimal
- FEMA flood zone
- X
- Chance of flooding over 30 yrs
- 0.0%
- Est. flood insurance / yr
- $507 – $1,088
Fire risk 3/10 · Minor
- Est. fire insurance / yr
- $1,222 – $2,270
Heat risk 6/10 · Moderate
- Hot days now (above 102°F)
- 7 days/yr
- Hot days in 30 yrs
- 22 days/yr
Wind risk 2/10 · Minimal
- Chance of severe wind over 30 yrs
- 3.0%
Air-quality risk 1/10 · Minimal
- Unhealthy air days now
- 0 days/yr
- Unhealthy air days in 30 yrs
- 0 days/yr
Risk factors via First Street. Map © Google.
Why this score? — see what drove the C- grade
The composite is a weighted blend of 9 inputs, each scored 0–100. Each bar is that input's sub-score; the figure is the points it added to the 100-point composite (weight × sub-score).
- Cash flow +20.0/30.0
- ARV discount +7.5/15.0
- DSCR +6.4/10.0
- 1% rule +5.4/10.0
- Livability +4.0/5.0
- Schools +3.2/10.0
- Condition / age +2.5/5.0
- Rent growth +2.4/5.0
- Appreciation +0.0/10.0
$200,000
🖨 Deal sheet 📄 Offer letter ✓ Due diligence
Listing remarks MLS
This 3-bedroom, 2-bath, two-story townhouse offers a flexible layout and plenty of opportunity to add value. The home features one bedroom located upstairs, providing separation and privacy, while the remaining bedrooms and bathrooms are conveniently located on the main level. Bring your vision and transform this townhouse into a fantastic rental or resale opportunity. Don't miss this chance to see this investor special!
Key facts
- 3,659 sq ft lot
- 2 garage spots
- Built 1981
Neighborhood map
What this means for you Summary
Snapshot
- This is a 3-bed/2.0-bath single-family listed at $200k.
Deal economics
- At list price, monthly cash flow is $247 ($3k/yr) — positive.
- The deal already cash-flows at list — no discount required.
- Meets the 1% rule at list price ($2k rent vs $200k).
- Cap rate 7.8% vs local median 4.7% in Midland — top-decile yield for the area; either an underpriced asset or a hidden risk that comps aren't pricing in. Stress-test before assuming the spread holds.
Location & tenants
- Location reads 79/100 on livability (#57 in TX, #2,192 nationally) — a middle-class / working-renter tenant base. Strengths: employment A+, housing A+, health & safety A+; Watch: crime C-, commute D+, amenities D.
- Midland ISD (urban): math 34% / reading 36% proficiency, ranked #477 of 826 in TX (top 58%) — families likely to look elsewhere, expect single-tenant / working-renter base with shorter leases.
- Zoned schools: Bonham El (math 36% / reading 34%, grade F, #1,965 of 4,322 statewide, top 46%, 640 students, 69% FRL); Abell J H (math 32% / reading 43%, grade F, #736 of 1,662 statewide, top 45%, 1,095 students, 46% FRL); Legacy H S (math 37% / reading 3%, grade F, #1,397 of 1,632 statewide, top 87%, 2,504 students, 41% FRL) — zoned schools at 52% FRL track the district average.
- Market conditions: Rents soft (-0.3%/yr); 64 active listings in the ZIP; 40 comparable units currently listed for rent nearby; rentals at typical pace (median 21d on market — plan ~3-4 weeks tenant-placement turnaround); 42% of comp listings sitting > 30 days — soft ceiling on asking rent; solid renter incomes; 1,504 units permitted in Midland County in 2024 (0 in 5+ unit buildings).
- This rent runs 32% of the median local income ($77k/yr) — at the standard rent-burdened threshold; future hikes will face affordability resistance.
Forward outlook
- Local home prices are declining (-3.0%/yr); year-one equity from $1k of loan paydown is wiped out by about $6k of value loss. Plan a longer hold.
- Midland County population projected at +83% by 2050 — long-run rental-demand tailwind backs the buy-and-hold thesis.
Negotiation context
- Only 8 days on market — expect competitive offers; lowballing is unlikely to land.
- 3 sale attempts since 13y ago with the ask held roughly flat each time — persistent listings suggest the price (not the market) is what's stuck; bring a comps-based counter.
Risks & watch-outs
- Climate carrying-cost: extreme-heat days projected 7→22/yr by 2055 (HVAC capex compounding) — expect insurance premiums to compound above CPI over the hold.
Questions for the listing agent
- Is there a deadline driving the sale (1031 exchange, divorce, estate, relocation)? That informs how much negotiation room exists.
- What's the average days-on-market for RENTAL listings here right now (not sales)? A rising rental-DOM trend means longer vacancies and softer asking-rent achievability than the comps imply.
- What's the recent tenant-quality profile in this submarket — average credit score on applications, eviction rate, late-payment / NSF rate, and stable-employment percentage? A property-management company in the area should have these aggregated.
- How much new for-sale + rental construction is in the pipeline within 1–3 miles? Heavy new supply typically softens prices + rents 12–24 months out; constrained supply supports both.
Investment metrics
- 1% rule
- 1.04% ✓
- Cap rate
- 7.77%
- Cash-on-cash
- 5.29%
- DSCR
- 1.24
- GRM
- 8.0
CMA / ARV
No comps found within radius.
Projected returns pro-forma
-3.0% appreciation · 0.0% rent growth · sell at horizon
- IRR
- -11.6%
- Equity multiple
- 0.59×
- Total profit
- $-22,761
- Equity at exit
- $29,821
- IRR
- -7.5%
- Equity multiple
- 0.59×
- Total profit
- $-23,031
- Equity at exit
- $17,292
Cash invested: $56,000 (down + closing). Projections, not guarantees.
Landlord ↔ Tenant lean methodology
- Overall (STATE)
- 87 Strongly Landlord-Friendly
- State Texas
- 87 Strongly Landlord-Friendly · R+5
- County
- — inherits STATE
- City
- — inherits STATE
ZIP-level market 79703
- Rents YoY
- -0.3%
- Active inventory
- 64
- Price-to-rent
- 8.0×
Monthly cashflow live
- Estimated rent
- $2,086 high interval (Pro) →
- Mortgage (P&I)
- −$1,049
- Tax from tax record
- −$269 /mo · $3,228/yr
- Insurance
- −$83
- HOA
- −$0
- Vacancy / Maint / Mgmt
- −$438
- Net cashflow
- $247
Break-even live
UW: 25.0% down · 7.5% · 30yr · 1.5% tax · 5.0% vac · 8.0% maint · 8.0% mgmt
Financing live
Cash to close
- Down payment
- $50,000
- Closing costs
- $6,000
- Reserves months
- —
- Total cash needed
- —
Loan-product check · same deal, 3 products live
Conventional
25% down · 7.5% · 30yr
- Down + closing
- —
- Monthly P&I
- —
- Monthly cashflow
- —
- DSCR
- —
- Eligible?
- —
Personal DTI + credit; lowest rate.
DSCR
20% down · 8.5% · 30yr
- Down + closing
- —
- Monthly P&I
- —
- Monthly cashflow
- —
- DSCR
- —
- Eligible?
- —
No personal income docs; deal must DSCR.
Hard money
10% down · 12.0% · 12mo
- Down + closing
- —
- Monthly P&I
- —
- Monthly cashflow
- —
- DSCR
- —
- Eligible?
- —
Short-term bridge; refi at stabilization.
Rent comps 40 comps
| Address | Beds | Baths | Sqft | Rent | $/sqft | DOM | Units | Dist |
|---|---|---|---|---|---|---|---|---|
| 3900 Douglas Ave Midland, TX | 4.0 | 2.0 | 1961 | $2,800 | $1.43 | 43d | 1 | 0.30mi |
| 3401 Storey Ave Midland, TX | 3.0 | 2.0 | 1531 | $2,200 | $1.44 | 20d | 1 | 0.37mi |
| 3401 Storey Ave Midland, TX | 3.0 | 2.0 | 1531 | $2,200 | $1.44 | 43d | 1 | 0.37mi |
| 3607 W Michigan Ave Midland, TX | 3.0 | 2.0 | 1535 | $2,500 | $1.63 | 20d | 1 | 0.39mi |
| 509 Delmar St Midland, TX | 1.0–2.0 | 1.0–2.5 | 1116 | $1,796 | $1.61 | 13d | 8 | 0.41mi |
| 3601 Andrews Hwy Midland, TX | 2.0 | 1.0–2.0 | 800 | $1,615 | $2.02 | 13d | 16 | 0.43mi |
| 4313 Storey Ave Unit A Midland, TX | 3.0 | 2.0 | 1255 | $2,000 | $1.59 | 43d | 1 | 0.44mi |
| 3311 Storey Ave Midland, TX | 3.0 | 1.5 | 1100 | $1,700 | $1.55 | 13d | 1 | 0.46mi |
| 4403 Crockett Ave Unit A Midland, TX | 3.0 | 2.0 | 1065 | $1,800 | $1.69 | 20d | 1 | 0.53mi |
| 4405 Crockett Ave Unit A Midland, TX | 3.0 | 2.0 | 1100 | $1,800 | $1.64 | 43d | 1 | 0.55mi |
| 3619 Boyd Ave Midland, TX | 3.0 | 2.0 | 1700 | $2,100 | $1.24 | 13d | 1 | 0.55mi |
| 4503 Crockett Ave Unit B Midland, TX | 2.0 | 2.0 | 1250 | $2,000 | $1.60 | 43d | 1 | 0.63mi |
| 1813 McDonald St Midland, TX | 3.0 | 2.0 | 1680 | $2,249 | $1.34 | 43d | 1 | 0.67mi |
| 4519 Crockett Ave Midland, TX | 2.0 | 2.0 | 1465 | $1,900 | $1.30 | 20d | 1 | 0.68mi |
| 4600 Andrews Hwy Midland, TX | 1.0–3.0 | 1.0–2.0 | 1117 | $2,590 | $2.32 | 43d | 5 | 0.69mi |
| 4525 Crockett Ave Midland, TX | 2.0 | 2.0 | 1400 | $4,250 | $3.04 | 20d | 1 | 0.70mi |
| 4506 Storey Ave Midland, TX | 3.0 | 1.0 | 1400 | $1,650 | $1.18 | 13d | 1 | 0.72mi |
| 1902 N Midland Dr Midland, TX | 1.0–2.0 | 1.0–2.5 | 887 | $1,619 | $1.82 | 13d | 40 | 0.76mi |
| 4610 Storey Ave Midland, TX | 3.0 | 2.0 | 1184 | $1,899 | $1.60 | 20d | 1 | 0.84mi |
| 3403 Thomas Ave Midland, TX | 2.0 | 2.0 | 1472 | $2,000 | $1.36 | 13d | 1 | 0.84mi |
| 4409 Roosevelt Dr Midland, TX | 3.0 | 2.0 | 1230 | $1,750 | $1.42 | 44d | 1 | 0.88mi |
| 3811 Cedar Spring Dr Midland, TX | 4.0 | 2.0 | 1500 | $2,600 | $1.73 | 43d | 1 | 0.90mi |
| 4534 Sinclair Ave Midland, TX | 2.0 | 1.0–2.5 | 901 | $1,904 | $2.11 | 20d | 9 | 0.94mi |
| 4317 Tanner Dr Unit A Midland, TX | 4.0 | 2.0 | 2220 | $2,650 | $1.19 | 20d | 1 | 0.98mi |
| 2929 W Kansas Ave Unit 317 Midland, TX | 2.0 | 1.5 | 1050 | $1,200 | $1.14 | 43d | 1 | 0.99mi |
| 2929 W Kansas Ave Midland, TX | 2.0 | 1.0 | 1050 | $1,200 | $1.14 | 43d | 1 | 0.99mi |
| 2928 W Louisiana Ave Unit 213 Midland, TX | 3.0 | 2.0 | 1450 | $1,400 | $0.97 | 43d | 1 | 1.01mi |
| 2910 W Michigan Ave Unit 101 Midland, TX | 2.0 | 2.0 | 1215 | $1,350 | $1.11 | 43d | 1 | 1.01mi |
| 4425 Humble Ave Midland, TX | 4.0 | 2.0 | 1466 | $2,250 | $1.53 | 20d | 1 | 1.02mi |
| 4425 Humble Ave Midland, TX | 4.0 | 2.0 | 1466 | $2,150 | $1.47 | 13d | 1 | 1.02mi |
| 3105 Barkley Ave Midland, TX | 4.0 | 2.0 | 1730 | $2,350 | $1.36 | 13d | 1 | 1.03mi |
| 4515 Monty Dr Midland, TX | 4.0 | 2.0 | 1853 | $2,400 | $1.30 | 43d | 1 | 1.07mi |
| 3100 Thomas Ave Midland, TX | 3.0 | 1.0 | 1300 | $2,400 | $1.85 | 43d | 1 | 1.11mi |
| 2805 W Louisiana Ave Midland, TX | 3.0 | 2.0 | 1178 | $2,400 | $2.04 | 20d | 1 | 1.12mi |
| 2601 Bedford Dr Midland, TX | 3.0 | 2.0 | 2108 | $2,200 | $1.04 | 13d | 1 | 1.14mi |
| 4603 Mercedes Dr Midland, TX | 3.0 | 2.0 | 1665 | $2,199 | $1.32 | 20d | 1 | 1.15mi |
| 2202 Wydewood Dr Midland, TX | 3.0 | 3.0 | 1854 | $2,700 | $1.46 | 13d | 1 | 1.15mi |
| 4732 Harvard Ave Midland, TX | 3.0 | 2.0 | 2248 | $2,600 | $1.16 | 20d | 1 | 1.17mi |
| 2812 Mariana Ave Midland, TX | 3.0 | 1.5 | 1443 | $1,750 | $1.21 | 43d | 1 | 1.17mi |
| 2302 Wydewood Dr Midland, TX | 3.0 | 2.0 | 1748 | $2,500 | $1.43 | 43d | 1 | 1.19mi |
Listing history 9 events
-
2026-03-26status Pending
-
2026-03-25historical Active Under Contract 424-char remark
Show marketing remark (424 chars)
This 3-bedroom, 2-bath, two-story townhouse offers a flexible layout and plenty of opportunity to add value. The home features one bedroom located upstairs, providing separation and privacy, while the remaining bedrooms and bathrooms are conveniently located on the main level. Bring your vision and transform this townhouse into a fantastic rental or resale opportunity. Don't miss this chance to see this investor special!
-
2026-03-18$200,000 Active
Show marketing remark (424 chars)
This 3-bedroom, 2-bath, two-story townhouse offers a flexible layout and plenty of opportunity to add value. The home features one bedroom located upstairs, providing separation and privacy, while the remaining bedrooms and bathrooms are conveniently located on the main level. Bring your vision and transform this townhouse into a fantastic rental or resale opportunity. Don't miss this chance to see this investor special!
-
2026-03-18$200,000 Active 424-char remark
Show marketing remark (424 chars)
This 3-bedroom, 2-bath, two-story townhouse offers a flexible layout and plenty of opportunity to add value. The home features one bedroom located upstairs, providing separation and privacy, while the remaining bedrooms and bathrooms are conveniently located on the main level. Bring your vision and transform this townhouse into a fantastic rental or resale opportunity. Don't miss this chance to see this investor special!
-
2019-07-02soldstatus
-
2013-05-09soldstatus
-
2013-05-07soldstatus 375-char remark
Show marketing remark (375 chars)
Recently updated with new paint, shower door and carpet. 3 bedroom, 2 bath home with a sunroom. Formal dining with built-in bookcases and a breakfast area. Large open living area with wet bar and wood-burning fireplace. Spacious kitchen with lots of cabinets and storage. Large master with dual sinks and a separate tub & shower. 2 car garage. Verify taxes and schools.
-
2013-01-21$160,000 375-char remark
Show marketing remark (375 chars)
Recently updated with new paint, shower door and carpet. 3 bedroom, 2 bath home with a sunroom. Formal dining with built-in bookcases and a breakfast area. Large open living area with wet bar and wood-burning fireplace. Spacious kitchen with lots of cabinets and storage. Large master with dual sinks and a separate tub & shower. 2 car garage. Verify taxes and schools.
-
2000-05-12soldstatus
ⓘ Source: listings_history table (triggers on properties + properties_extension) + one-shot
backfill from property_details.listing_events for pre-trigger history.
Tax reassessment forecast TX · Resets to sale price
- Current annual tax
- $3,228 · $269/mo
- Projected year-2 tax
- $3,660 · $305/mo
- Expected delta
- +$432/yr (+$36/mo · 13.4%)
ⓘ Screening estimate from a state-policy table — verify with the county assessor before closing.
Climate risk First Street
- Flood 1/10 Low FEMA zone X · 0% chance over 30 yrs
- Wildfire 3/10 Moderate
- Heat 6/10 Major 7 d/yr ≥102°F today · 22 d/yr by 30 yrs out
- Wind 2/10 Low 3% chance of damaging wind over 30 yrs
- Air quality 1/10 Low 0 unhealthy d/yr today · 0 by 30 yrs out
Nearby sold comps map
Loading sold comps map…
Walkable amenities ~0.75 mi
Loading nearby amenities…
Taxation est. · year 1
- Rental income
- $25,032
- − Mortgage interest
- −$11,203
- − Property taxes
- −$3,228
- − Insurance
- −$1,000
- − Repairs & maintenance
- −$2,003
- − Management
- −$2,003
- − Depreciation
- −$5,818
- Taxable loss
- −$222
- Est. tax savings @ 24.0%
- +$53
- After-tax cash flow
- $3,015/yr
For passive investors: Depreciation is non-cash, so a rental often shows a tax loss while cash-flowing — sheltering income. Rental losses are passive: they offset passive income freely, and up to $25,000/yr can offset ordinary (W-2) income if you actively participate and your MAGI is under $100k (phasing out to $0 by $150k); unused losses carry forward. On sale, claimed depreciation is recaptured at up to 25%, and gains may owe capital-gains tax (a 1031 exchange can defer both). Figures are a year-1 estimate at your 24.0% rate — not tax advice; consult a CPA.
Schools (NCES district)
- District
- Midland ISD
- NCES district ID
- 4830570
- Math proficiency
- 34% ▼ -7.00%
- Reading proficiency
- 36% ▬ 0.00%
- Median HH income
- $63,457
- Composite
- 31.63/100
- National rank
- #5938
- State rank
- #477 of 826 in TX
Livability — Midland
- Score
- 79/100
- State rank
- #57
- US rank
- #2192
Category grades
Schools grade is shown separately in the Schools card above.
Census & demographics
- Census place
- Midland, TX
- County
- Midland County · 168,494 people
- City population
- 168,494
- Metro
- Midland, TX
- Population (ZIP)
- 20,419
- Household income
- $77,285
- Rent vs Own
- Severe rent burden
- 417.0
Population outlook (Midland County) Hauer SSP2
- Today (2025)
- 220,895 people
- By 2030
- 253,667 · +14.8%
- By 2040
- 325,498 · +47.4%
- By 2050
- 404,168 · +83.0%
- By 2075
- 609,802 · +176.1%
- By 2100
- 760,172 · +244.1%
Race, ethnicity, and origin ACS 2023
- Neighborhood character
- Diverse neighborhood (Simpson 0.59)
- Race & ethnicity
- Hispanic / Latino 54% White 34% Two or more races 16% Black 8% Asian 2%
- Hispanic origin (detail)
- Mexican 45% Cuban 4%
- Common ancestry
- Slovak 1% Italian 1% Serbian 1%
- Foreign-born
- 20% · Canada, Jamaica, Vietnam
- Languages at home
- 58% English-only · Spanish 38% Arabic 1% Chinese 1%
Political lean MEDSL · Midland
- 2024 margin
- Solid R (+60.5) · D 19.3% · R 79.8%
- 2008→2024 swing
- -3.3pp toward R · 2008: -57.3pp · 2024: -60.5pp
- All cycles
- 2024: R+60.5 2020: R+56.6 2016: R+55.2 2012: R+61.5 2008: R+57.3
Not yet ingested
- Civics
- —
Market trends
- HPI YoY
- ▼ -250.72%
- Current HPI
- 224.6222
- Rent YoY
- ▼ -0.33%
- Metro
- Midland, TX
- State GDP YoY
- ▲ 3.95%
- F500 in state
- 110
Industry mix (Fortune 500 HQ in TX)
| Industry | F500 HQs | Revenue |
|---|---|---|
| Energy | 16 | $1,198B |
|
||
| Technology | 5 | $198B |
|
||
| Engineering / Construction | 4 | $72B |
|
||
| Energy Services | 3 | $60B |
|
||
| Utilities | 3 | $41B |
|
||
| Healthcare | 2 | $330B |
|
||
Price history
+25.0% since first listed9 events — show timeline
- 2026-03-26 Pending — ODMLS
- 2026-03-25 Contingent — PBBOR
- 2026-03-18 Listed $200,000 ODMLS
- 2026-03-18 Listed $200,000 PBBOR
- 2019-07-02 Sold (Public Records) — Public Records
- 2013-05-09 Sold (Public Records) — Public Records
- 2013-05-07 Sold (MLS) — ODMLS
- 2013-01-21 Listed $160,000 ODMLS
- 2000-05-12 Sold (Public Records) — Public Records
Property tax history
+1.4%/yrLatest (2025): $3,228 · -0.0% YoY. Source: county tax records.
Cash-flow waterfall
monthlySold comps — $/sqft
last 12 mo · ≤1 miLoading sold comps…