 Duplex
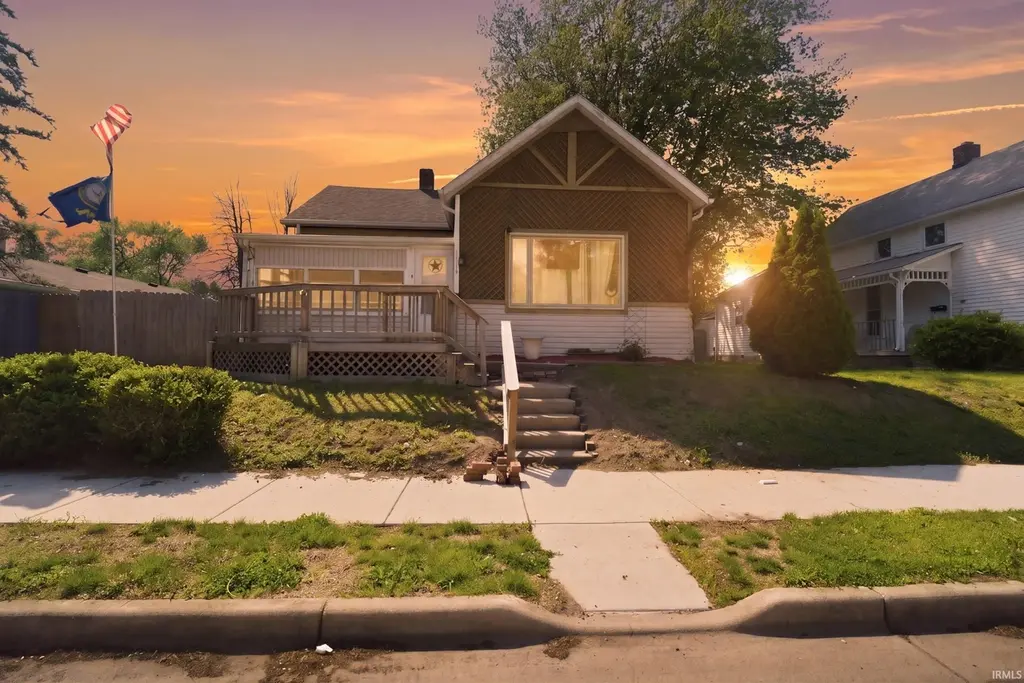
1118 S 2nd St · Lafayette, IN
Flood risk 1/10 · Minimal
- FEMA flood zone
- X (unshaded)
- Chance of flooding over 30 yrs
- 0.0%
- Est. flood insurance / yr
- $473 – $860
Fire risk 1/10 · Minimal
- Est. fire insurance / yr
- $717 – $1,331
Heat risk 3/10 · Minor
- Hot days now (above 102°F)
- 7 days/yr
- Hot days in 30 yrs
- 18 days/yr
Wind risk 2/10 · Minimal
- Chance of severe wind over 30 yrs
- —
Air-quality risk 2/10 · Minimal
- Unhealthy air days now
- 1 days/yr
- Unhealthy air days in 30 yrs
- 2 days/yr
Risk factors via First Street. Map © Google.
Why this score? — see what drove the C+ grade
The composite is a weighted blend of 9 inputs, each scored 0–100. Each bar is that input's sub-score; the figure is the points it added to the 100-point composite (weight × sub-score).
- Cash flow +30.0/30.0
- DSCR +10.0/10.0
- 1% rule +8.8/10.0
- Rent growth +3.8/5.0
- Livability +3.7/5.0
- Schools +2.6/10.0
- Condition / age +2.5/5.0
- ARV discount +0.0/15.0
- Appreciation +0.0/10.0
$165,000
🖨 Deal sheet 📄 Offer letter ✓ Due diligence
Multi-family units
County records classify this as Multi-Family (2-4 Unit). Listing-text estimate: 2 units. confirmed
Listing remarks MLS
Check out this duplex investment property that has hit the market! Front unit comes with spacious and multiple rooms / living area as well as a washer and dryer, New refrigerator, new paint and flooring in the kitchen. Long time renters who have been there for 12-13 years. 2nd unit is mostly remodeled with new lease bringing in $895 a month! All new appliances in this unit, New flooring, new paint, and Baseboard heating. Owner only pays water and sewer in the utility category. New Gutters and new siding on back unit with Detached garage for the front unit as well as a covered a lean -to for the back unit. Roofer has inspected the roof and claims to have 5-6 years left, owner can adjust price if a new roof is wanted now.
Key facts
- 2 unit duplex
- Detached garage
- 5,663 sq ft lot
Tags
Property features AI
Finance
- Other: Breed restrictions for pets
Exterior
- Parking: 4 open parking spaces
- Utilities: Public water; Public sewer
- Home design: Duplex (residential income); Single-story
- Construction: Vinyl siding; Wood siding
- Exterior features: Deck; Porch; Level lot
Interior
- Kitchen: Range; Refrigerator
- Flooring: Laminate
- Bathrooms: 2 full bathrooms; 3 main-level bathrooms
- Heating & cooling: Baseboard heating; Window air conditioning units
- Interior features: Range; Refrigerator; Laminate flooring; Has basement (crawl space, unfinished)
- Laundry & utility: Washer hookup
Neighborhood map
What this means for you Summary
Snapshot
- This is a 2 × 3-bed/2.0-bath units multifamily listed at $165k.
Deal economics
- At list price, monthly cash flow is $741 ($9k/yr) — positive. Per door: $370/mo.
- The deal already cash-flows at list — no discount required.
- Meets the 1% rule at list price ($2k rent vs $165k).
- Recommended offer: $160k (3.0% below list) — sets the bar for market timing.
- Cap rate 11.7% vs local median 4.2% in Lafayette — top-decile yield for the area; either an underpriced asset or a hidden risk that comps aren't pricing in. Stress-test before assuming the spread holds.
Location & tenants
- Location reads 74/100 on livability (#68 in IN, #4,374 nationally) — a middle-class / working-renter tenant base. Strengths: cost of living A+, housing A+, health & safety A+; Watch: amenities D+, employment D+, crime F.
- Lafayette School Corporation (urban): math 29% / reading 34% proficiency, ranked #235 of 301 in IN (top 78%) — families likely to look elsewhere, expect single-tenant / working-renter base with shorter leases; 63% free/reduced lunch — lower-income household profile, screen leases tightly.
- Zoned schools: Thomas Miller Elementary School (math 27% / reading 22%, grade F, #762 of 994 statewide, top 78%, 343 students, 85% FRL); Jefferson High School (math 23% / reading 55%, grade F, #235 of 369 statewide, top 65%, 2,118 students, 69% FRL).
- Market conditions: Rents rising fast (+5.1%/yr); 219 active listings in the ZIP; 1,341 units permitted in Tippecanoe County in 2024 (869 in 5+ unit buildings).
- This rent runs 41% of the median local income ($66k/yr) — at the standard rent-burdened threshold; future hikes will face affordability resistance.
Forward outlook
- Local home prices are declining (-3.0%/yr); year-one equity from $1k of loan paydown is wiped out by about $5k of value loss. Plan a longer hold.
- Tippecanoe County population projected at +41% by 2050 — long-run rental-demand tailwind backs the buy-and-hold thesis.
- At projected returns (-3.0% appreciation + 5.1% rent growth), your $46k cash investment doubles in ~6 years — after that, you're playing with house money.
Negotiation context
- It's been on market 49 days — a 3% lower offer ($160k) is reasonable based on typical stale-listing flexibility.
- 8 sale attempts since 3y ago with the ask held roughly flat each time — persistent listings suggest the price (not the market) is what's stuck; bring a comps-based counter.
Risks & watch-outs
- Watch-outs: built in 1935 — expect roof / HVAC / electrical / plumbing capex.
Questions for the listing agent
- It's been on market 49 days. Have you received any prior offers? Is the seller open to a 3% concession, seller financing, or rate buy-down credit?
- Can we see the unit-by-unit rent roll, current vacancy, and any below-market leases? What's the average tenancy length?
- What capital expenditures (roof, boiler, parking lot, exteriors) have been made in the last 5 years, and what's planned in the next 2?
- Built in 1935 — when were the roof, HVAC, electrical panel, plumbing, and water heater last replaced?
- Is there a deadline driving the sale (1031 exchange, divorce, estate, relocation)? That informs how much negotiation room exists.
- Schools are D-rated, which usually means shorter tenancies and higher turnover. Who's the typical renter profile here, and what's been the actual vacancy rate?
- Crime grade is F in this area — have there been break-ins, vandalism, or insurance claims at this property in the last 3 years? What carrier currently insures it and at what premium?
- What's the average days-on-market for RENTAL listings here right now (not sales)? A rising rental-DOM trend means longer vacancies and softer asking-rent achievability than the comps imply.
- What's the recent tenant-quality profile in this submarket — average credit score on applications, eviction rate, late-payment / NSF rate, and stable-employment percentage? A property-management company in the area should have these aggregated.
- How much new apartment / multifamily construction is in the pipeline within 1–3 miles? Heavy new supply (>2% of stock underway) typically softens rents 12–24 months out; light construction supports rent growth.
Investment metrics
- 1% rule
- 1.38% ✓
- Cap rate
- 11.68%
- Cash-on-cash
- 19.23%
- DSCR
- 1.86
- GRM
- 6.0
CMA / ARV
- ARV (median comp)
- $134,158
- List price
- $165,000
- Delta
- 22.99%
- Verdict
- OVERPRICED
- Comps
- 4 within 1.0 mi
Projected returns pro-forma
-3.0% appreciation · 5.12% rent growth · sell at horizon
- IRR
- 13.4%
- Equity multiple
- 1.55×
- Total profit
- $25,361
- Equity at exit
- $24,602
- IRR
- 23.8%
- Equity multiple
- 3.25×
- Total profit
- $103,959
- Equity at exit
- $14,266
Cash invested: $46,200 (down + closing). Projections, not guarantees.
Landlord ↔ Tenant lean methodology
- Overall (STATE)
- 90 Strongly Landlord-Friendly
- State Indiana
- 90 Strongly Landlord-Friendly · R+11
- County
- — inherits STATE
- City
- — inherits STATE
ZIP-level market 47905
- Home prices YoY
- -33.2%
- Rents YoY
- 5.1%
- Active inventory
- 219
- Price-to-rent
- 12.1×
Monthly cashflow live
- Estimated rent
- $2,273 high interval (Pro) →
- Mortgage (P&I)
- −$865
- Tax from tax record
- −$121 /mo · $1,453/yr
- Insurance
- −$69
- HOA
- −$0
- Vacancy / Maint / Mgmt
- −$477
- Net cashflow
- $741
Break-even live
2-unit breakdown (identical units grouped — click to expand)
| Units | Beds | Baths | Est. rent |
|---|---|---|---|
| 2× units | 3 | 2 | $2,272 |
| #1 | 3 | 2 | $1,136 |
| #2 | 3 | 2 | $1,136 |
| Total (2 units) | $2,273 | ||
UW: 25.0% down · 7.5% · 30yr · 1.5% tax · 5.0% vac · 8.0% maint · 8.0% mgmt
Financing live
Cash to close
- Down payment
- $41,250
- Closing costs
- $4,950
- Reserves months
- —
- Total cash needed
- —
Loan-product check · same deal, 3 products live
Conventional
25% down · 7.5% · 30yr
- Down + closing
- —
- Monthly P&I
- —
- Monthly cashflow
- —
- DSCR
- —
- Eligible?
- —
Personal DTI + credit; lowest rate.
DSCR
20% down · 8.5% · 30yr
- Down + closing
- —
- Monthly P&I
- —
- Monthly cashflow
- —
- DSCR
- —
- Eligible?
- —
No personal income docs; deal must DSCR.
Hard money
10% down · 12.0% · 12mo
- Down + closing
- —
- Monthly P&I
- —
- Monthly cashflow
- —
- DSCR
- —
- Eligible?
- —
Short-term bridge; refi at stabilization.
Listing history 33 events
-
2026-06-19days on market $165,000 Active 49 DOM
-
2026-06-18days on market $165,000 Active 48 DOM
-
2026-06-17days on market $165,000 Active 47 DOM
-
2026-06-16days on market $165,000 Active 46 DOM
-
2026-06-15days on market $165,000 Active 45 DOM
-
2026-06-14days on market $165,000 Active 43 DOM
-
2026-06-13days on market $165,000 Active 42 DOM
-
2026-06-10days on market $165,000 Active 40 DOM
-
2026-06-09days on market $165,000 Active 39 DOM
-
2026-06-08days on market $165,000 Active 38 DOM
-
2026-06-07pricedays on market $165,000 Active 37 DOM
-
2026-06-02days on market $170,000 Active 32 DOM
-
2026-06-01days on market $170,000 Active 31 DOM
-
2026-05-31days on market $170,000 Active 30 DOM
-
2026-05-30days on market $170,000 Active 29 DOM
-
2026-05-18status Pending 943-char remark
-
2026-05-12status Active 943-char remark
-
2026-05-04historical Active Under Contract 943-char remark
-
2026-04-28$170,000 Active 943-char remark
-
2025-12-01historical
-
2025-09-19status Active
-
2025-09-19price $165,000
-
2025-09-12historical
-
2025-07-29price $179,900
-
2025-06-25status Active
-
2025-06-09status Pending
-
2025-06-04$185,000 Active
-
2023-12-07soldstatus $153,000 Closed
Show marketing remark (730 chars)
Check out this duplex investment property that has hit the market! Front unit comes with spacious and multiple rooms / living area as well as a washer and dryer, New refrigerator, new paint and flooring in the kitchen. Long time renters who have been there for 12-13 years. 2nd unit is mostly remodeled with new lease bringing in $895 a month! All new appliances in this unit, New flooring, new paint, and Baseboard heating. Owner only pays water and sewer in the utility category. New Gutters and new siding on back unit with Detached garage for the front unit as well as a covered a lean -to for the back unit. Roofer has inspected the roof and claims to have 5-6 years left, owner can adjust price if a new roof is wanted now.
-
2023-11-16status Pending
Show marketing remark (730 chars)
Check out this duplex investment property that has hit the market! Front unit comes with spacious and multiple rooms / living area as well as a washer and dryer, New refrigerator, new paint and flooring in the kitchen. Long time renters who have been there for 12-13 years. 2nd unit is mostly remodeled with new lease bringing in $895 a month! All new appliances in this unit, New flooring, new paint, and Baseboard heating. Owner only pays water and sewer in the utility category. New Gutters and new siding on back unit with Detached garage for the front unit as well as a covered a lean -to for the back unit. Roofer has inspected the roof and claims to have 5-6 years left, owner can adjust price if a new roof is wanted now.
-
2023-11-09$175,000 Active
Show marketing remark (730 chars)
Check out this duplex investment property that has hit the market! Front unit comes with spacious and multiple rooms / living area as well as a washer and dryer, New refrigerator, new paint and flooring in the kitchen. Long time renters who have been there for 12-13 years. 2nd unit is mostly remodeled with new lease bringing in $895 a month! All new appliances in this unit, New flooring, new paint, and Baseboard heating. Owner only pays water and sewer in the utility category. New Gutters and new siding on back unit with Detached garage for the front unit as well as a covered a lean -to for the back unit. Roofer has inspected the roof and claims to have 5-6 years left, owner can adjust price if a new roof is wanted now.
-
2023-07-28soldstatus $83,000 Closed
-
2023-07-14status Pending
-
2023-07-13$75,000 Active
ⓘ Source: listings_history table (triggers on properties + properties_extension) + one-shot
backfill from property_details.listing_events for pre-trigger history.
Tax reassessment forecast IN · Partial reset (capped growth)
- Current annual tax
- $1,453 · $121/mo
- Projected year-2 tax
- $1,453 · $121/mo
- Expected delta
- $0/yr ($0/mo · 0.0%)
ⓘ Screening estimate from a state-policy table — verify with the county assessor before closing.
Climate risk First Street
- Flood 1/10 Low FEMA zone X (unshaded) · 0% chance over 30 yrs
- Wildfire 1/10 Low
- Heat 3/10 Moderate 7 d/yr ≥102°F today · 18 d/yr by 30 yrs out
- Wind 2/10 Low
- Air quality 2/10 Low 1 unhealthy d/yr today · 2 by 30 yrs out
Nearby sold comps map
Loading sold comps map…
Walkable amenities ~0.75 mi
Loading nearby amenities…
Taxation est. · year 1
- Rental income
- $27,276
- − Mortgage interest
- −$9,243
- − Property taxes
- −$1,453
- − Insurance
- −$825
- − Repairs & maintenance
- −$2,182
- − Management
- −$2,182
- − Depreciation
- −$4,800
- Taxable income
- $6,591
- Est. tax owed @ 24.0%
- −$1,582
- After-tax cash flow
- $7,305/yr
For passive investors: Depreciation is non-cash, so a rental often shows a tax loss while cash-flowing — sheltering income. Rental losses are passive: they offset passive income freely, and up to $25,000/yr can offset ordinary (W-2) income if you actively participate and your MAGI is under $100k (phasing out to $0 by $150k); unused losses carry forward. On sale, claimed depreciation is recaptured at up to 25%, and gains may owe capital-gains tax (a 1031 exchange can defer both). Figures are a year-1 estimate at your 24.0% rate — not tax advice; consult a CPA.
Schools (NCES district)
- District
- Lafayette School Corporation
- NCES district ID
- 1805400
- Math proficiency
- 29% ▼ -9.00%
- Reading proficiency
- 34% ▼ -7.00%
- Median HH income
- $39,817
- Composite
- 26.46/100
- National rank
- #7217
- State rank
- #235 of 301 in IN
Livability — Lafayette
- Score
- 74/100
- State rank
- #68
- US rank
- #4374
Category grades
Schools grade is shown separately in the Schools card above.
Census & demographics
- Census place
- Lafayette, IN
- County
- Tippecanoe County · 181,820 people
- City population
- 106,622
- Metro
- Lafayette-West Lafayette, IN
- Population (ZIP)
- 42,219
- Household income
- $65,861
- Rent vs Own
- Severe rent burden
- 1475.0
Population outlook (Tippecanoe County) Hauer SSP2
- Today (2025)
- 215,327 people
- By 2030
- 232,284 · +7.9%
- By 2040
- 266,517 · +23.8%
- By 2050
- 302,826 · +40.6%
- By 2075
- 394,445 · +83.2%
- By 2100
- 463,500 · +115.3%
Race, ethnicity, and origin ACS 2023
- Neighborhood character
- Predominantly White (74%)
- Race & ethnicity
- White 74% Hispanic / Latino 12% Two or more races 8% Black 7% Asian 4%
- Hispanic origin (detail)
- Mexican 10%
- Common ancestry
- Romanian 3% Italian 2% Slovak 2%
- Foreign-born
- 10% · Canada, China, Vietnam
- Languages at home
- 91% English-only · Spanish 6% Other Asian/Pacific 1% Vietnamese 1%
Political lean MEDSL · Tippecanoe
- 2024 margin
- Toss-up / Even · D 49.0% · R 49.1% · Other 1.9%
- 2008→2024 swing
- -11.8pp toward R · 2008: 11.6pp · 2024: -0.1pp
- All cycles
- 2024: R+0.1 2020: D+0.6 2016: R+5.7 2012: R+3.6 2008: D+11.6
Not yet ingested
- Civics
- —
Market trends
- HPI YoY
- ▼ -113.05%
- Current HPI
- 227.1583
- Rent YoY
- ▲ 5.12%
- Metro
- Lafayette-West Lafayette, IN
- State GDP YoY
- ▲ 2.90%
- F500 in state
- 18
Industry mix (Fortune 500 HQ in IN)
| Industry | F500 HQs | Revenue |
|---|---|---|
| Industrial Machinery | 2 | $37B |
|
||
| Healthcare | 1 | $177B |
|
||
| Pharmaceuticals | 1 | $45B |
|
||
| Metals / Steel | 1 | $18B |
|
||
| Agriculture | 1 | $17B |
|
||
| Packaging | 1 | $12B |
|
||
Price history
+120.0% since first listed20 events — show timeline
- 2026-06-05 Price Changed $165,000 IRMLS
- 2026-05-21 Relisted — IRMLS
- 2026-05-18 Pending — IRMLS
- 2026-05-12 Relisted — IRMLS
- 2026-05-04 Contingent — IRMLS
- 2026-04-28 Listed $170,000 IRMLS
- 2025-12-01 Listing Removed — MIBOR as Distributed by MLS Grid
- 2025-09-19 Relisted — MIBOR as Distributed by MLS Grid
- 2025-09-19 Price Changed $165,000 MIBOR as Distributed by MLS Grid
- 2025-09-12 Listing Removed — MIBOR as Distributed by MLS Grid
- 2025-07-29 Price Changed $179,900 MIBOR as Distributed by MLS Grid
- 2025-06-25 Relisted — MIBOR as Distributed by MLS Grid
- 2025-06-09 Pending — MIBOR as Distributed by MLS Grid
- 2025-06-04 Listed $185,000 MIBOR as Distributed by MLS Grid
- 2023-12-07 Sold (MLS) $153,000 IRMLS
- 2023-11-16 Pending — IRMLS
- 2023-11-09 Listed $175,000 IRMLS
- 2023-07-28 Sold (MLS) $83,000 IRMLS
- 2023-07-14 Pending — IRMLS
- 2023-07-13 Listed $75,000 IRMLS
Property tax history
+0.4%/yrLatest (2024): $1,453 · +54.5% YoY. Source: county tax records.
Cash-flow waterfall
monthlySold comps — $/sqft
last 12 mo · ≤1 miLoading sold comps…