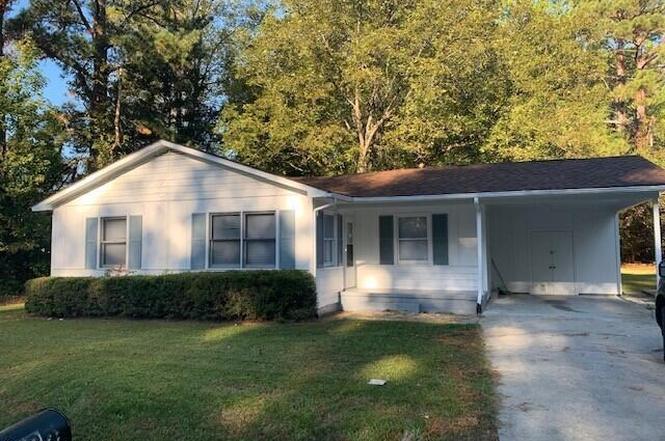
3002 Williams Rd · Greenville, NC
Flood risk 1/10 · Minimal
- FEMA flood zone
- X (unshaded)
- Chance of flooding over 30 yrs
- 0.0%
- Est. flood insurance / yr
- $507 – $1,088
Fire risk 3/10 · Minor
- Est. fire insurance / yr
- $906 – $1,684
Heat risk 7/10 · Major
- Hot days now (above 106°F)
- 7 days/yr
- Hot days in 30 yrs
- 16 days/yr
Wind risk 8/10 · Major
- Chance of severe wind over 30 yrs
- 80.0%
Air-quality risk 3/10 · Minor
- Unhealthy air days now
- 3 days/yr
- Unhealthy air days in 30 yrs
- 3 days/yr
Risk factors via First Street. Map © Google.
Why this score? — see what drove the C- grade
The composite is a weighted blend of 9 inputs, each scored 0–100. Each bar is that input's sub-score; the figure is the points it added to the 100-point composite (weight × sub-score).
- Cash flow +19.6/30.0
- ARV discount +7.5/15.0
- DSCR +6.2/10.0
- 1% rule +4.2/10.0
- Rent growth +3.9/5.0
- Livability +3.9/5.0
- Schools +3.6/10.0
- Condition / age +2.5/5.0
- Appreciation +0.0/10.0
$154,900
🖨 Deal sheet 📄 Offer letter ✓ Due diligence
Listing remarks
This cozy 2 Bedroom 1 bath property is ideal for entertaining guests and has a homey and intimate feel. It's also the Perfect unit for investors who are looking to add another spectacular unit to their portfolio or a wonderful family home. Schedule your showing today! No HOA. New Dishwasher 2021 New Fridge 10/23 New Roof 2021 LVP flooring New paint interior and around portal 10/2023 10/2023 new bathroom vanity, mirror and lights Brushed nickel Bathroom accessories and doorknobs/handles Replaced motor in HVAC Nov 24
Key facts
- New paint interior
- New bathroom vanity
- New dishwasher
Tags
Neighborhood map
What this means for you Summary
Snapshot
- This is a 3-bed/1.0-bath single-family listed at $155k.
Deal economics
- At list price, monthly cash flow is $178 ($2k/yr) — positive.
- The deal already cash-flows at list — no discount required.
- To meet the 1% rule (rent ≥ 1% of price), the offer needs to be $142k (8.4% below list).
- Recommended offer: $136k (12.0% below list) — sets the bar for market timing.
- Cap rate 7.7% vs local median 3.8% in Greenville — top-decile yield for the area; either an underpriced asset or a hidden risk that comps aren't pricing in. Stress-test before assuming the spread holds.
Location & tenants
- Location reads 77/100 on livability (#30 in NC, #2,977 nationally) — a middle-class / working-renter tenant base. Strengths: commute A+, cost of living A+, health & safety A+; Watch: crime F, employment F.
- Pitt County Schools (rural): math 41% / reading 44% proficiency, ranked #100 of 178 in NC (top 56%) — families likely to look elsewhere, expect single-tenant / working-renter base with shorter leases.
- Zoned schools: Lakeforest Elementary (math 22% / reading 30%, grade F, #1,085 of 1,410 statewide, top 77%, 804 students, 98% FRL); E B Aycock Middle (math 27% / reading 30%, grade F, #355 of 475 statewide, top 76%, 661 students, 99% FRL); South Central (math 42% / reading 51%, grade D-, #344 of 535 statewide, top 64%, 1,675 students, 55% FRL) — zoned schools average 84% FRL vs 56% district-wide (28 pts higher); higher-poverty schools than district average — tighter screening recommended.
- Market conditions: Rents rising fast (+5.4%/yr); 350 active listings in the ZIP; 14 comparable units currently listed for rent nearby; rentals at typical pace (median 21d on market — plan ~3-4 weeks tenant-placement turnaround); 1,300 units permitted in Pitt County in 2024 (204 in 5+ unit buildings).
- This rent runs 35% of the median local income ($49k/yr) — at the standard rent-burdened threshold; future hikes will face affordability resistance.
Forward outlook
- Local home prices are declining (-3.0%/yr); year-one equity from $1k of loan paydown is wiped out by about $5k of value loss. Plan a longer hold.
- Pitt County population projected at +22% by 2050 — long-run rental-demand tailwind backs the buy-and-hold thesis.
Negotiation context
- It's been on market 284 days — a 12% lower offer ($136k) is reasonable based on typical stale-listing flexibility.
- 2 sale attempts since 11y ago; this cycle's ask has dropped $25k (14%) from the opening price — seller is motivated, your offer sets the floor, not the list.
- Current owner paid $66k; list at $155k implies a 133% gain — meaningful room to come down on a strong offer.
Risks & watch-outs
- Climate carrying-cost: severe wind risk, 80% chance of damaging wind over 30y; extreme-heat days projected 7→16/yr by 2055 (HVAC capex compounding) — expect insurance premiums to compound above CPI over the hold.
Questions for the listing agent
- It's been on market 284 days. Have you received any prior offers? Is the seller open to a 12% concession, seller financing, or rate buy-down credit?
- Built in 1961 — when were the roof, HVAC, electrical panel, plumbing, and water heater last replaced?
- Why hasn't it sold? Are there any deal-killer items the seller is aware of (foundation, flood, title, zoning, code violations)?
- Is there a deadline driving the sale (1031 exchange, divorce, estate, relocation)? That informs how much negotiation room exists.
- Crime grade is F in this area — have there been break-ins, vandalism, or insurance claims at this property in the last 3 years? What carrier currently insures it and at what premium?
- What's the average days-on-market for RENTAL listings here right now (not sales)? A rising rental-DOM trend means longer vacancies and softer asking-rent achievability than the comps imply.
- What's the recent tenant-quality profile in this submarket — average credit score on applications, eviction rate, late-payment / NSF rate, and stable-employment percentage? A property-management company in the area should have these aggregated.
- How much new for-sale + rental construction is in the pipeline within 1–3 miles? Heavy new supply typically softens prices + rents 12–24 months out; constrained supply supports both.
Investment metrics
- 1% rule
- 0.92% ✗
- Cap rate
- 7.67%
- Cash-on-cash
- 4.92%
- DSCR
- 1.22
- GRM
- 9.1
CMA / ARV
No comps found within radius.
Projected returns pro-forma
-3.0% appreciation · 5.44% rent growth · sell at horizon
- IRR
- -6.2%
- Equity multiple
- 0.76×
- Total profit
- $-10,258
- Equity at exit
- $23,096
- IRR
- 5.9%
- Equity multiple
- 1.48×
- Total profit
- $20,816
- Equity at exit
- $13,393
Cash invested: $43,372 (down + closing). Projections, not guarantees.
Landlord ↔ Tenant lean methodology
- Overall (STATE)
- 85 Strongly Landlord-Friendly
- State North Carolina
- 85 Strongly Landlord-Friendly · R+3
- County
- — inherits STATE
- City
- — inherits STATE
ZIP-level market 27834
- Rents YoY
- 5.4%
- Active inventory
- 350
- Price-to-rent
- 9.1×
Monthly cashflow live
- Estimated rent
- $1,419 high interval (Pro) →
- Mortgage (P&I)
- −$812
- Tax from tax record
- −$66 /mo · $791/yr
- Insurance
- −$65
- HOA
- −$0
- Vacancy / Maint / Mgmt
- −$298
- Net cashflow
- $178
Break-even live
UW: 25.0% down · 7.5% · 30yr · 1.5% tax · 5.0% vac · 8.0% maint · 8.0% mgmt
Financing live
Cash to close
- Down payment
- $38,725
- Closing costs
- $4,647
- Reserves months
- —
- Total cash needed
- —
Loan-product check · same deal, 3 products live
Conventional
25% down · 7.5% · 30yr
- Down + closing
- —
- Monthly P&I
- —
- Monthly cashflow
- —
- DSCR
- —
- Eligible?
- —
Personal DTI + credit; lowest rate.
DSCR
20% down · 8.5% · 30yr
- Down + closing
- —
- Monthly P&I
- —
- Monthly cashflow
- —
- DSCR
- —
- Eligible?
- —
No personal income docs; deal must DSCR.
Hard money
10% down · 12.0% · 12mo
- Down + closing
- —
- Monthly P&I
- —
- Monthly cashflow
- —
- DSCR
- —
- Eligible?
- —
Short-term bridge; refi at stabilization.
Rent comps 14 comps
| Address | Beds | Baths | Sqft | Rent | $/sqft | DOM | Units | Dist |
|---|---|---|---|---|---|---|---|---|
| 1548 Manning Forest Dr Unit M7 Greenville, NC | 2.0 | 1.5 | 1094 | $1,300 | $1.19 | 13d | 1 | 0.13mi |
| 203 Shiloh Dr Unit E Greenville, NC | 2.0 | 1.5 | 1000 | $1,130 | $1.13 | 20d | 1 | 0.51mi |
| 301 Shiloh Dr Unit A Greenville, NC | 2.0 | 1.0 | 864 | $950 | $1.10 | 20d | 1 | 0.52mi |
| 3324 Frontgate Dr Greenville, NC | 1.0–2.0 | 1.0 | 765 | $999 | $1.31 | 13d | 9 | 0.73mi |
| 3338 Frontgate Dr Unit 22 Greenville, NC | 2.0 | 1.0 | 865 | $1,049 | $1.21 | 20d | 1 | 0.75mi |
| 2152 Flagstone Ct Greenville, NC | 2.0 | 1.5 | 1044 | $1,150 | $1.10 | 20d | 1 | 0.76mi |
| 2140 Flagstone Ct Unit J6 Greenville, NC | 2.0 | 1.5 | 1043 | $1,200 | $1.15 | 20d | 1 | 0.81mi |
| 4129 Laurel Ridge Dr Greenville, NC | 2.0 | 4.0 | 1050 | $2,500 | $2.38 | 20d | 1 | 0.93mi |
| 4129 Laurel Ridge Dr Unit F Greenville, NC | 2.0 | 3.5 | 1050 | $2,500 | $2.38 | 20d | 1 | 0.93mi |
| 1005 Allen Ridge Dr Greenville, NC | 2.0–3.0 | 2.0 | 1134 | $1,999 | $1.76 | 13d | 13 | 0.94mi |
| 1150 Cross Creek Cir Greenville, NC | 2.0 | 2.0 | 1100 | $1,200 | $1.09 | 20d | 1 | 1.22mi |
| 935 Spring Forest Rd Greenville, NC | 2.0 | 2.0 | 1000 | $1,299 | $1.30 | 20d | 4 | 1.25mi |
| 2613 Whitaker Dr Greenville, NC | 2.0 | 1.0 | 853 | $1,004 | $1.18 | 20d | 1 | 1.40mi |
| 904 Gabriel Dr Greenville, NC | 1.0–2.0 | 1.0–2.0 | 966 | $1,875 | $1.94 | 20d | 17 | 1.48mi |
Listing history 22 events
-
2026-06-19days on market $154,900 Active 284 DOM
-
2026-06-18days on market $154,900 Active 283 DOM
-
2026-06-17days on market $154,900 Active 282 DOM
-
2026-06-16days on market $154,900 Active 281 DOM
-
2026-06-15days on market $154,900 Active 280 DOM
-
2026-06-13days on market $154,900 Active 277 DOM
-
2026-06-10days on market $154,900 Active 275 DOM
-
2026-06-09days on market $154,900 Active 274 DOM
-
2026-06-08days on market $154,900 Active 273 DOM
-
2026-06-07days on market $154,900 Active 272 DOM
-
2026-06-05days on market $154,900 Active 269 DOM
-
2026-06-03days on market $154,900 Active 268 DOM
-
2026-06-02days on market $154,900 Active 267 DOM
-
2026-06-01days on market $154,900 Active 266 DOM
-
2026-05-31days on market $154,900 Active 265 DOM
-
2026-05-30days on market $154,900 Active 264 DOM
-
2026-03-16price $154,900
-
2025-09-08$179,900 Active
-
2022-07-11price $1,150
-
2016-05-11historical
-
2015-11-25$70,000
-
2004-06-01soldstatus $66,500
ⓘ Source: listings_history table (triggers on properties + properties_extension) + one-shot
backfill from property_details.listing_events for pre-trigger history.
Tax reassessment forecast NC · Resets to sale price
- Current annual tax
- $791 · $66/mo
- Projected year-2 tax
- $1,270 · $106/mo
- Expected delta
- +$480/yr (+$40/mo · 60.7%)
ⓘ Screening estimate from a state-policy table — verify with the county assessor before closing.
Climate risk First Street
- Flood 1/10 Low FEMA zone X (unshaded) · 0% chance over 30 yrs
- Wildfire 3/10 Moderate
- Heat 7/10 Severe 7 d/yr ≥106°F today · 16 d/yr by 30 yrs out
- Wind 8/10 Severe 80% chance of damaging wind over 30 yrs
- Air quality 3/10 Moderate 3 unhealthy d/yr today · 3 by 30 yrs out
Nearby sold comps map
Loading sold comps map…
Walkable amenities ~0.75 mi
Loading nearby amenities…
Taxation est. · year 1
- Rental income
- $17,023
- − Mortgage interest
- −$8,677
- − Property taxes
- −$791
- − Insurance
- −$774
- − Repairs & maintenance
- −$1,362
- − Management
- −$1,362
- − Depreciation
- −$4,506
- Taxable loss
- −$449
- Est. tax savings @ 24.0%
- +$108
- After-tax cash flow
- $2,243/yr
For passive investors: Depreciation is non-cash, so a rental often shows a tax loss while cash-flowing — sheltering income. Rental losses are passive: they offset passive income freely, and up to $25,000/yr can offset ordinary (W-2) income if you actively participate and your MAGI is under $100k (phasing out to $0 by $150k); unused losses carry forward. On sale, claimed depreciation is recaptured at up to 25%, and gains may owe capital-gains tax (a 1031 exchange can defer both). Figures are a year-1 estimate at your 24.0% rate — not tax advice; consult a CPA.
Schools (NCES district)
- District
- Pitt County Schools
- NCES district ID
- 3700012
- Math proficiency
- 41% ▬ 0.00%
- Reading proficiency
- 44% ▲ 2.00%
- Median HH income
- $40,631
- Composite
- 35.67/100
- National rank
- #4877
- State rank
- #100 of 178 in NC
Livability — Greenville
- Score
- 77/100
- State rank
- #30
- US rank
- #2977
Category grades
Schools grade is shown separately in the Schools card above.
Census & demographics
- County
- Pitt County · 142,592 people
- City population
- 115,121
- Metro
- Greenville, NC
- Population (ZIP)
- 56,347
- Household income
- $48,935
- Rent vs Own
- Severe rent burden
- 3319.0
Population outlook (Pitt County) Hauer SSP2
- Today (2025)
- 194,585 people
- By 2030
- 203,756 · +4.7%
- By 2040
- 220,807 · +13.5%
- By 2050
- 236,614 · +21.6%
- By 2075
- 275,940 · +41.8%
- By 2100
- 300,058 · +54.2%
Race, ethnicity, and origin ACS 2023
- Neighborhood character
- Diverse neighborhood (Simpson 0.59)
- Race & ethnicity
- Black 54% White 33% Hispanic / Latino 8% Two or more races 3% Asian 2%
- Hispanic origin (detail)
- Mexican 7%
- Common ancestry
- Lithuanian 1% Slovak 1% Romanian 1%
- Foreign-born
- 7% · Canada, China
- Languages at home
- 91% English-only · Spanish 6% Other Asian/Pacific 1%
Political lean MEDSL · Pitt
- 2024 margin
- Lean D (+6.0) · D 52.5% · R 46.5% · Other 1.1%
- 2008→2024 swing
- -2.8pp toward R · 2008: 8.8pp · 2024: 6.0pp
- All cycles
- 2024: D+6.0 2020: D+9.4 2016: D+7.4 2012: D+6.7 2008: D+8.8
Not yet ingested
- Civics
- —
Market trends
- HPI YoY
- ▼ -187.99%
- Current HPI
- 190.6869
- Rent YoY
- ▲ 5.44%
- Metro
- Greenville, NC
- State GDP YoY
- ▲ 3.28%
- F500 in state
- 26
Industry mix (Fortune 500 HQ in NC)
| Industry | F500 HQs | Revenue |
|---|---|---|
| Financial Services | 2 | $213B |
|
||
| Retail | 2 | $95B |
|
||
| Industrial Conglomerate | 1 | $38B |
|
||
| Metals / Steel | 1 | $35B |
|
||
| Utilities | 1 | $30B |
|
||
| Industrial Machinery | 1 | $19B |
|
||
Price history
+132.9% since first listed6 events — show timeline
- 2026-03-16 Price Changed $154,900 Hive MLS
- 2025-09-08 Listed $179,900 Hive MLS
- 2022-07-11 Price Changed $1,150 RENT.
- 2016-05-11 Listing Removed — Hive MLS
- 2015-11-25 Listed $70,000 Hive MLS
- 2004-06-01 Sold (Public Records) $66,500 Public Records
Property tax history
+4.4%/yrLatest (2025): $791 · +1.5% YoY. Source: county tax records.
Cash-flow waterfall
monthlySold comps — $/sqft
last 12 mo · ≤1 miLoading sold comps…