 Duplex
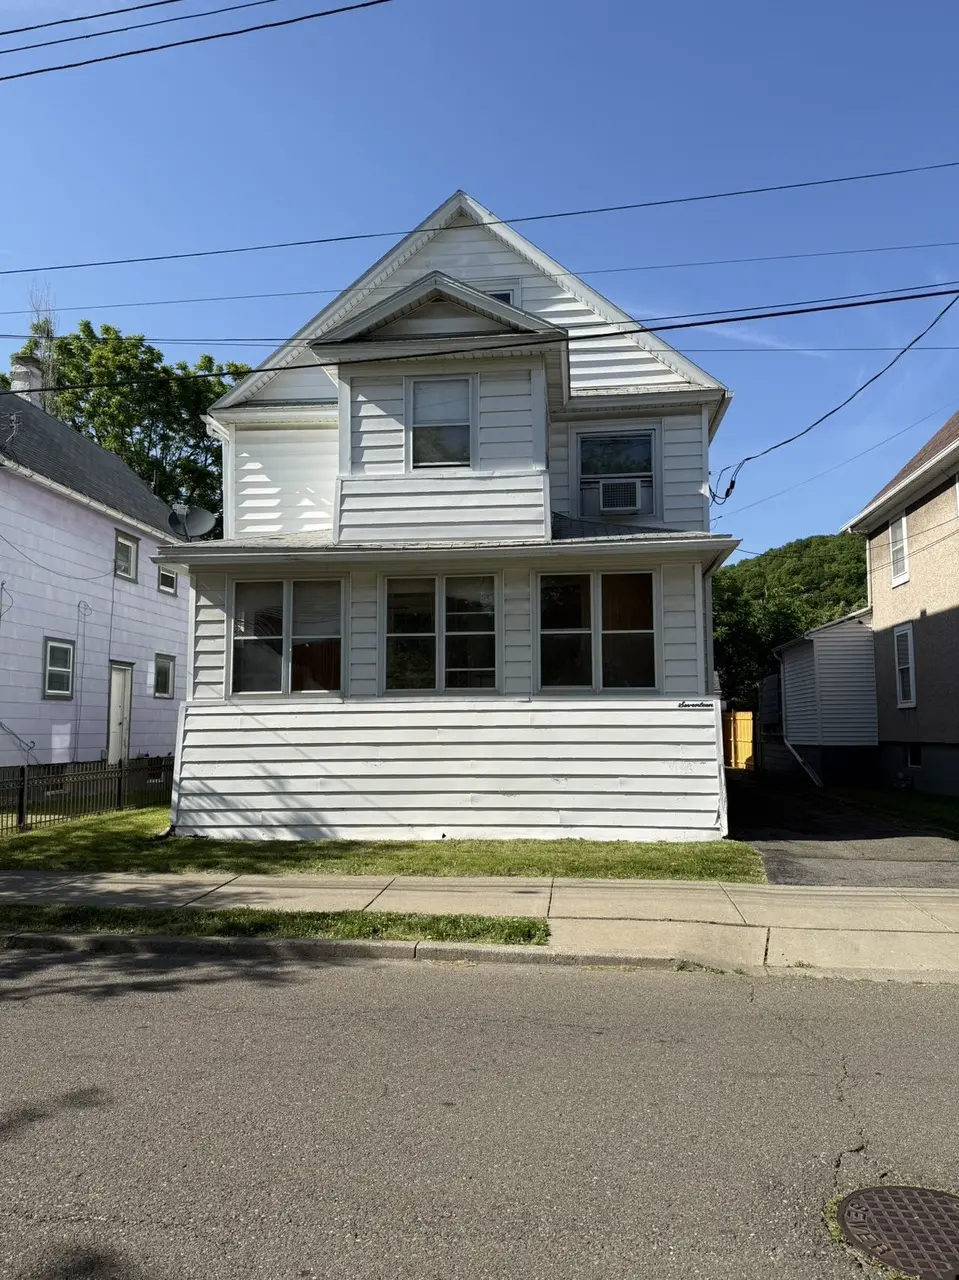
17 Hazel St · Binghamton, NY
Flood risk 7/10 · Major
- FEMA flood zone
- X (shaded)
- Chance of flooding over 30 yrs
- 0.75%
- Est. flood insurance / yr
- $473 – $860
Fire risk 2/10 · Minimal
- Est. fire insurance / yr
- $691 – $1,283
Heat risk 3/10 · Minor
- Hot days now (above 94°F)
- 7 days/yr
- Hot days in 30 yrs
- 16 days/yr
Wind risk 2/10 · Minimal
- Chance of severe wind over 30 yrs
- 1.0%
Air-quality risk 2/10 · Minimal
- Unhealthy air days now
- 0 days/yr
- Unhealthy air days in 30 yrs
- 1 days/yr
Risk factors via First Street. Map © Google.
Why this score? — see what drove the C+ grade
The composite is a weighted blend of 9 inputs, each scored 0–100. Each bar is that input's sub-score; the figure is the points it added to the 100-point composite (weight × sub-score).
- Cash flow +30.0/30.0
- 1% rule +10.0/10.0
- DSCR +10.0/10.0
- Rent growth +5.0/5.0
- Livability +3.9/5.0
- Schools +3.0/10.0
- Condition / age +2.5/5.0
- ARV discount +0.0/15.0
- Appreciation +0.0/10.0
$137,000
🖨 Deal sheet 📄 Offer letter ✓ Due diligence
Multi-family units
County records classify this as Multi-Family (2-4 Unit). Listing-text estimate: 2 units. confirmed
Listing remarks
Two family house for sale, great location for your convenience: close to shopping, bank and hospitals, restaurants; large size bedrooms in each unit; large closet for your belongings; lots of kitchen cabinets for your storage; 2nd floor unit has a sunroom to get more natural lights; large attic; nice front porch and enclosed rear entry; enjoy the backyard for your entertainment; appliances stay; driveway parking. Live in on unit and let other unit pay for your rent or buy it as an investment property. Come to see this great investment, lots of possibilities waiting for you!
Key facts
- Large size bedrooms
- Large closet
- Front porch
Tags
Property features AI
Exterior
- Parking: Detached garage
- Utilities: Public water; Public sewer
- Home design: Duplex (residential income property)
- Construction: Vinyl siding
- Exterior features: Covered porch; Sloped lot
Interior
- Flooring: Carpet; Vinyl
- Bathrooms: 2 full bathrooms
- Heating & cooling: Forced air heating; No central cooling
- Interior features: Electric water heater; Carpet and vinyl flooring; Basement
Neighborhood map
What this means for you Summary
Snapshot
- This is a 2 × 2-bed/1.0-bath units multifamily listed at $137k.
Deal economics
- At list price, monthly cash flow is $553 ($7k/yr) — positive. Per door: $277/mo.
- The deal already cash-flows at list — no discount required.
- Meets the 1% rule at list price ($2k rent vs $137k).
- Cap rate 11.6% vs local median 6.4% in Binghamton — top-decile yield for the area; either an underpriced asset or a hidden risk that comps aren't pricing in. Stress-test before assuming the spread holds.
Location & tenants
- Location reads 78/100 on livability (#174 in NY, #2,710 nationally) — a middle-class / working-renter tenant base. Strengths: amenities A+, commute A+, cost of living A+; Watch: crime F, employment F.
- Binghamton City School District (urban): math 30% / reading 44% proficiency, ranked #557 of 590 in NY (top 94%) — families likely to look elsewhere, expect single-tenant / working-renter base with shorter leases; 61% free/reduced lunch — lower-income household profile, screen leases tightly.
- Zoned schools: Woodrow Wilson School (math 8% / reading 27%, grade F, #2,004 of 2,108 statewide, top 95%, 352 students, 76% FRL) — zoned schools average 76% FRL vs 61% district-wide (16 pts higher); higher-poverty schools than district average — tighter screening recommended.
- Zoned-school proficiency averages 17% at this address vs 37% district-wide (-20 pts) — the specific schools serving this property underperform the Binghamton City School District average; the district grade overstates school quality for this exact location.
- Market conditions: Rents rising fast (+11.2%/yr); 136 active listings in the ZIP; 15 comparable units currently listed for rent nearby; rentals lingering (median 44d on market — plan ~5-8 weeks vacancy on turnover, expect pricing pressure); 60% of comp listings sitting > 30 days — soft ceiling on asking rent; 340 units permitted in Broome County in 2024 (269 in 5+ unit buildings).
- At $2,366/mo this rent would consume 53% of the median local household income ($53k/yr) (locally 1875% of renters already pay >50% of income on rent) — very limited rent-growth headroom before tenants either downsize or default.
Forward outlook
- Local home prices are declining (-3.0%/yr); year-one equity from $947 of loan paydown is wiped out by about $4k of value loss. Plan a longer hold.
- Broome County population projected at -13% by 2050 — secular population decline; favor cash flow + early exit over multi-decade hold.
- At projected returns (-3.0% appreciation + 8.0% rent growth), your $38k cash investment doubles in ~6 years — after that, you're playing with house money.
Negotiation context
- Only 11 days on market — expect competitive offers; lowballing is unlikely to land.
- Current owner paid $57k; list at $137k implies a 142% gain — meaningful room to come down on a strong offer.
Risks & watch-outs
- Watch-outs: property tax is 4.2% of price; flood insurance adds $56/mo; built in 1920 — expect roof / HVAC / electrical / plumbing capex.
- Climate carrying-cost: major flood risk — expect insurance premiums to compound above CPI over the hold.
Questions for the listing agent
- Can we see the unit-by-unit rent roll, current vacancy, and any below-market leases? What's the average tenancy length?
- What capital expenditures (roof, boiler, parking lot, exteriors) have been made in the last 5 years, and what's planned in the next 2?
- Built in 1920 — when were the roof, HVAC, electrical panel, plumbing, and water heater last replaced?
- Property tax is high relative to price — has the assessment been appealed recently, and will the sale trigger a re-assessment?
- What's the actual annual flood-insurance premium (NFIP or private), and is the property in a SFHA with mandatory coverage?
- Is there a deadline driving the sale (1031 exchange, divorce, estate, relocation)? That informs how much negotiation room exists.
- Schools are D-rated, which usually means shorter tenancies and higher turnover. Who's the typical renter profile here, and what's been the actual vacancy rate?
- Crime grade is F in this area — have there been break-ins, vandalism, or insurance claims at this property in the last 3 years? What carrier currently insures it and at what premium?
- What's the average days-on-market for RENTAL listings here right now (not sales)? A rising rental-DOM trend means longer vacancies and softer asking-rent achievability than the comps imply.
- What's the recent tenant-quality profile in this submarket — average credit score on applications, eviction rate, late-payment / NSF rate, and stable-employment percentage? A property-management company in the area should have these aggregated.
- How much new apartment / multifamily construction is in the pipeline within 1–3 miles? Heavy new supply (>2% of stock underway) typically softens rents 12–24 months out; light construction supports rent growth.
Investment metrics
- 1% rule
- 1.73% ✓
- Cap rate
- 11.63%
- Cash-on-cash
- 19.05%
- DSCR
- 1.85
- GRM
- 4.8
CMA / ARV
- ARV (on-the-fly)
- $116,736
- Comps found
- 12
Show comp detail 12 sales within ~0.75 mi
| Address | Dist | Beds/Ba | Sqft | Sold | Price | $/sf | Match |
|---|---|---|---|---|---|---|---|
| 69 Colfax Ave | 0.24mi | 3/2.0 (-1) | 1,970 (+8%) | 8mo | $138,000 | $70 | 64 |
| 241 Prospect St | 0.23mi | 4/2.0 | 2,028 (+11%) | 10mo | $130,000 | $64 | 63 |
| 30 Holland St | 0.23mi | 3/2.0 (-1) | 1,752 (-4%) | 22mo | $97,000 | $55 | 59 |
| 64 Thorp St | 0.69mi | 4/2.0 | 1,852 (+2%) | 12mo | $100,000 | $54 | 55 |
| 29 Miles St | 0.31mi | 4/2.0 | 2,080 (+14%) | 10mo | $130,000 | $63 | 54 |
| 45 Charlotte St | 0.42mi | 4/4.0 | 1,800 (-1%) | 20mo | $48,888 | $27 | 54 |
| 39 Colfax Ave | 0.27mi | 4/2.0 | 1,557 (-15%) | 15mo | $125,000 | $80 | 50 |
| 85 Crestmont Rd | 0.66mi | 3/2.0 (-1) | 1,586 (-13%) | 7mo | $170,000 | $107 | 37 |
| 39 Schubert St | 0.73mi | 4/2.0 | 2,072 (+14%) | 8mo | $175,000 | $84 | 36 |
| 3 Field St | 0.44mi | 4/2.0 | 2,095 (+15%) | 23mo | $130,000 | $62 | 36 |
| 11 St Cyril Ave | 0.72mi | 4/3.0 | 1,963 (+8%) | 18mo | $55,000 | $28 | 35 |
| 4 Charles St | 0.70mi | 4/3.0 | 1,582 (-13%) | 14mo | $200,000 | $126 | 30 |
Match score weights: distance 35% · size 25% · config 20% · recency 20%. Top-matched comps best support the ARV.
Projected returns pro-forma
-3.0% appreciation · 8.0% rent growth · sell at horizon
- IRR
- 15.6%
- Equity multiple
- 1.67×
- Total profit
- $25,811
- Equity at exit
- $20,427
- IRR
- 28.4%
- Equity multiple
- 4.28×
- Total profit
- $125,836
- Equity at exit
- $11,845
Cash invested: $38,360 (down + closing). Projections, not guarantees.
Landlord ↔ Tenant lean methodology
- Overall (STATE)
- 15 Strongly Tenant-Friendly
- State New York
- 15 Strongly Tenant-Friendly · D+10
- County
- — inherits STATE
- City
- — inherits STATE
ZIP-level market 13905
- Home prices YoY
- -31.1%
- Rents YoY
- 11.2%
- Active inventory
- 136
- Price-to-rent
- 9.7×
Monthly cashflow live
- Estimated rent
- $2,366 high interval (Pro) →
- Mortgage (P&I)
- −$718
- Tax from tax record
- −$485 /mo · $5,816/yr
- Insurance
- −$57
- Flood insurance flood zone
- −$56 /mo · $666/yr
- HOA
- −$0
- Vacancy / Maint / Mgmt
- −$497
- Net cashflow
- $553
Break-even live
2-unit breakdown (identical units grouped — click to expand)
| Units | Beds | Baths | Est. rent |
|---|---|---|---|
| 2× units | 2 | 1 | $2,366 |
| #1 | 2 | 1 | $1,183 |
| #2 | 2 | 1 | $1,183 |
| Total (2 units) | $2,366 | ||
UW: 25.0% down · 7.5% · 30yr · 1.5% tax · 5.0% vac · 8.0% maint · 8.0% mgmt
Financing live
Cash to close
- Down payment
- $34,250
- Closing costs
- $4,110
- Reserves months
- —
- Total cash needed
- —
Loan-product check · same deal, 3 products live
Conventional
25% down · 7.5% · 30yr
- Down + closing
- —
- Monthly P&I
- —
- Monthly cashflow
- —
- DSCR
- —
- Eligible?
- —
Personal DTI + credit; lowest rate.
DSCR
20% down · 8.5% · 30yr
- Down + closing
- —
- Monthly P&I
- —
- Monthly cashflow
- —
- DSCR
- —
- Eligible?
- —
No personal income docs; deal must DSCR.
Hard money
10% down · 12.0% · 12mo
- Down + closing
- —
- Monthly P&I
- —
- Monthly cashflow
- —
- DSCR
- —
- Eligible?
- —
Short-term bridge; refi at stabilization.
Rent comps 15 comps
| Address | Beds | Baths | Sqft | Rent | $/sqft | DOM | Units | Dist |
|---|---|---|---|---|---|---|---|---|
| 4 Baxter St Unit Left Binghamton, NY | 4.0 | 2.5 | 1800 | $1,500 | $0.83 | 13d | 1 | 0.12mi |
| 133 Crestmont Rd Unit 2 Binghamton, NY | 3.0 | 1.0 | 1300 | $1,900 | $1.46 | 43d | 1 | 0.43mi |
| 36 Haendel St Unit 1 Binghamton, NY | 3.0 | 1.0 | 1600 | $1,650 | $1.03 | 43d | 1 | 0.60mi |
| 129 Helen St Unit 1 Binghamton, NY | 4.0 | 2.0 | 1850 | $2,200 | $1.19 | 43d | 1 | 0.65mi |
| 74 Matthews St Binghamton, NY | 3.0 | 2.0 | 2510 | $2,300 | $0.92 | 21d | 1 | 0.76mi |
| 16 Highland Ave Unit 1 Binghamton, NY | 3.0 | 1.0 | 1400 | $1,650 | $1.18 | 43d | 1 | 0.79mi |
| 198 Chapin St Binghamton, NY | 4.0 | 2.0 | 1500 | $1,700 | $1.13 | 21d | 1 | 1.02mi |
| 171 Chapin St Unit 1st FL Binghamton, NY | 4.0 | 1.5 | 1400 | $3,000 | $2.14 | 43d | 1 | 1.04mi |
| 16 North St Unit 1-1 Binghamton, NY | 5.0 | 2.0 | 2600 | $650 | $0.25 | 43d | 1 | 1.15mi |
| 57 Fowler Ave Johnson City, NY | 3.0 | 2.5 | 2497 | $2,000 | $0.80 | 13d | 1 | 1.15mi |
| 50 Lathrop Ave Unit 2 Binghamton, NY | 3.0 | 1.0 | 1250 | $1,600 | $1.28 | 13d | 1 | 1.21mi |
| 19 Walnut St Binghamton, NY | 5.0 | 2.0 | 1666 | $2,250 | $1.35 | 43d | 1 | 1.27mi |
| 26 Johnson Ave Unit 1 Binghamton, NY | 3.0 | 1.0 | 1633 | $1,600 | $0.98 | 43d | 1 | 1.35mi |
| 22 Ayres St Binghamton, NY | 4.0 | 2.0 | 2333 | $2,560 | $1.10 | 43d | 1 | 1.36mi |
| 50 Crocker Ave Johnson City, NY | 4.0 | 2.0 | 1411 | $2,000 | $1.42 | 21d | 1 | 1.42mi |
Listing history 10 events
-
2026-06-19days on market $137,000 Active 11 DOM
-
2026-06-18days on market $137,000 Active 10 DOM
-
2026-06-17days on market $137,000 Active 9 DOM
-
2026-06-16days on market $137,000 Active 8 DOM
-
2026-06-15days on market $137,000 Active 7 DOM
-
2026-06-14days on market $137,000 Active 5 DOM
-
2026-06-13days on market $137,000 Active 4 DOM
-
2026-06-10days on market $137,000 Active 2 DOM
-
2026-06-09remarks 580-char remark
-
2026-06-09$137,000 Active 1 DOM
ⓘ Source: listings_history table (triggers on properties + properties_extension) + one-shot
backfill from property_details.listing_events for pre-trigger history.
Tax reassessment forecast NY · Partial reset (capped growth)
- Current annual tax
- $5,816 · $485/mo
- Projected year-2 tax
- $5,816 · $485/mo
- Expected delta
- $0/yr ($0/mo · 0.0%)
ⓘ Screening estimate from a state-policy table — verify with the county assessor before closing.
Climate risk First Street
- Flood 7/10 Severe FEMA zone X (shaded) · 75% chance over 30 yrs
- Wildfire 2/10 Low
- Heat 3/10 Moderate 7 d/yr ≥94°F today · 16 d/yr by 30 yrs out
- Wind 2/10 Low 100% chance of damaging wind over 30 yrs
- Air quality 2/10 Low 0 unhealthy d/yr today · 1 by 30 yrs out
Nearby sold comps map
Loading sold comps map…
Walkable amenities ~0.75 mi
Loading nearby amenities…
Taxation est. · year 1
- Rental income
- $28,392
- − Mortgage interest
- −$7,674
- − Property taxes
- −$5,816
- − Insurance
- −$1,352
- − Repairs & maintenance
- −$2,271
- − Management
- −$2,271
- − Depreciation
- −$3,985
- Taxable income
- $5,022
- Est. tax owed @ 24.0%
- −$1,205
- After-tax cash flow
- $5,435/yr
For passive investors: Depreciation is non-cash, so a rental often shows a tax loss while cash-flowing — sheltering income. Rental losses are passive: they offset passive income freely, and up to $25,000/yr can offset ordinary (W-2) income if you actively participate and your MAGI is under $100k (phasing out to $0 by $150k); unused losses carry forward. On sale, claimed depreciation is recaptured at up to 25%, and gains may owe capital-gains tax (a 1031 exchange can defer both). Figures are a year-1 estimate at your 24.0% rate — not tax advice; consult a CPA.
Schools (NCES district)
- District
- Binghamton City School District
- NCES district ID
- 3604870
- Math proficiency
- 30% ▬ 0.00%
- Reading proficiency
- 44% ▲ 15.00%
- Median HH income
- $30,475
- Composite
- 30.09/100
- National rank
- #6342
- State rank
- #557 of 590 in NY
Livability — Binghamton
- Score
- 78/100
- State rank
- #174
- US rank
- #2710
Category grades
Schools grade is shown separately in the Schools card above.
Census & demographics
- Census place
- Binghamton, NY
- County
- Broome County · 126,805 people
- City population
- 65,170
- Metro
- Binghamton, NY
- Population (ZIP)
- 27,988
- Household income
- $53,362
- Rent vs Own
- Severe rent burden
- 1875.0
Population outlook (Broome County) Hauer SSP2
- Today (2025)
- 187,989 people
- By 2030
- 183,066 · -2.6%
- By 2040
- 172,228 · -8.4%
- By 2050
- 163,161 · -13.2%
- By 2075
- 153,641 · -18.3%
- By 2100
- 140,851 · -25.1%
Race, ethnicity, and origin ACS 2023
- Neighborhood character
- Predominantly White (68%)
- Race & ethnicity
- White 68% Asian 10% Black 10% Hispanic / Latino 7% Two or more races 7%
- Hispanic origin (detail)
- Mexican 2% Puerto Rican 3%
- Common ancestry
- Romanian 5% Lithuanian 3% Iranian 1%
- Foreign-born
- 11% · Canada, China, Vietnam
- Languages at home
- 87% English-only · Other Indo-European 5% Spanish 2% Other Asian/Pacific 1%
Political lean MEDSL · Broome
- 2024 margin
- Toss-up / Even · D 50.2% · R 49.8%
- 2008→2024 swing
- -7.6pp toward R · 2008: 8.0pp · 2024: 0.4pp
- All cycles
- 2024: D+0.4 2020: D+3.5 2016: R+3.7 2012: D+4.6 2008: D+8.0
Not yet ingested
- Civics
- —
Market trends
- HPI YoY
- ▼ -134.70%
- Current HPI
- 298.9847
- Rent YoY
- ▲ 11.19%
- Metro
- Binghamton, NY
- State GDP YoY
- ▲ 2.60%
- F500 in state
- 92
Industry mix (Fortune 500 HQ in NY)
| Industry | F500 HQs | Revenue |
|---|---|---|
| Financial Services | 10 | $950B |
|
||
| Consumer Goods | 9 | $162B |
|
||
| Insurance | 4 | $225B |
|
||
| Telecommunications | 2 | $144B |
|
||
| Pharmaceuticals | 2 | $112B |
|
||
| Media / Entertainment | 2 | $69B |
|
||
Price history
+141.8% since first listed2 events — show timeline
- 2026-06-08 Listed $137,000 GBAOR
- 2011-10-11 Sold (Public Records) $56,665 Public Records
Property tax history
+4.7%/yrLatest (2025): $5,816 · +0.9% YoY. Source: county tax records.
Cash-flow waterfall
monthlySold comps — $/sqft
last 12 mo · ≤1 miLoading sold comps…