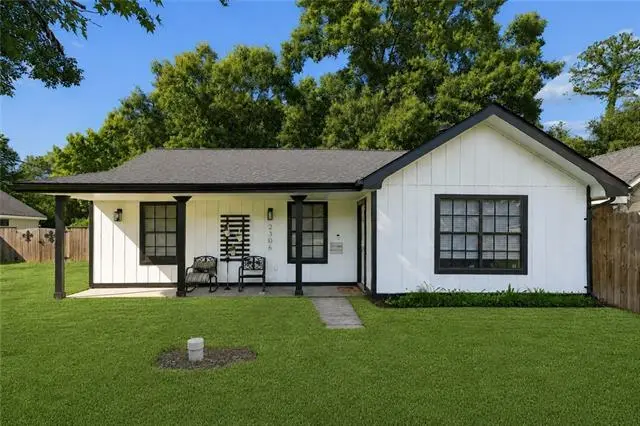
2306 Bluebird St · Slidell, LA
Flood risk 5/10 · Moderate
- FEMA flood zone
- X
- Chance of flooding over 30 yrs
- 0.48%
- Est. flood insurance / yr
- $507 – $1,088
Fire risk 5/10 · Moderate
- Est. fire insurance / yr
- $1,269 – $2,357
Heat risk 10/10 · Severe
- Hot days now (above 108°F)
- 7 days/yr
- Hot days in 30 yrs
- 22 days/yr
Wind risk 9/10 · Severe
- Chance of severe wind over 30 yrs
- 99.0%
Air-quality risk 2/10 · Minimal
- Unhealthy air days now
- 1 days/yr
- Unhealthy air days in 30 yrs
- 2 days/yr
Risk factors via First Street. Map © Google.
Why this score? — see what drove the D- grade
The composite is a weighted blend of 9 inputs, each scored 0–100. Each bar is that input's sub-score; the figure is the points it added to the 100-point composite (weight × sub-score).
- Cash flow +13.9/30.0
- Schools +4.3/10.0
- DSCR +4.2/10.0
- Rent growth +4.0/5.0
- Livability +3.5/5.0
- 1% rule +3.2/10.0
- Condition / age +2.5/5.0
- ARV discount +0.0/15.0
- Appreciation +0.0/10.0
$215,000
🖨 Deal sheet (PDF) 📄 Offer letter ✓ Due diligence
Listing remarks MLS
Move-in ready and completely renovated in 2025! This 3-bedroom, 2-bath home features a new 2025 roof, updated flooring throughout (no carpet), a spacious living room with vaulted ceilings and a wood-burning fireplace, and a beautifully updated kitchen with all appliances included! Enjoy the fully fenced backyard with mature shade trees. Conveniently located just minutes from shopping, dining, and I-12. Flood Zone C!
Key facts
- Updated flooring
- Updated kitchen
- Completely renovated
Tags
Property features AI
Exterior
- Parking: Driveway
- Utilities: Public water; Sewer to treatment plant
- Home design: Single-story; More than 50% renovated; Slab foundation
- Construction: Wood siding; Shingle roof; Built/renovated within last 50+ years (more than 50% renovated)
- Exterior features: Fenced yard; Shed(s); Rectangular lot; Outside city limits
Interior
- Kitchen: Dishwasher; Microwave; Oven; Range; Refrigerator
- Bathrooms: 2 full bathrooms
- Heating & cooling: Central heating; Central air conditioning
- Interior features: Ceiling fan(s); Carbon monoxide detector; Wood-burning fireplace
- Laundry & utility: Washer; Dryer
Neighborhood map
What this means for you Summary
Snapshot
- This is a 3-bed/2.0-bath single-family listed at $215k.
Deal economics
- At list price, monthly cash flow is $25 ($298/yr) — positive.
- The deal already cash-flows at list — no discount required.
- To meet the 1% rule (rent ≥ 1% of price), the offer needs to be $177k (17.6% below list).
- Recommended offer: $177k (17.6% below list) — sets the bar for 1% rule.
Location & tenants
- Location reads 70/100 on livability (#57 in LA) — a middle-class / working-renter tenant base. Strengths: cost of living A+, housing A+, health & safety A+; Watch: amenities F, commute F.
- St. Tammany Parish (suburban): math 43% / reading 55% proficiency, ranked #11 of 98 in LA (top 11%) — families likely to look elsewhere, expect single-tenant / working-renter base with shorter leases.
- Zoned schools: Henry Mayfield Elementary School (math 35% / reading 45%, grade F, #221 of 646 statewide, top 34%, 832 students, 60% FRL); Slidell Junior High School (math 25% / reading 47%, grade F, #84 of 218 statewide, top 41%, 823 students, 60% FRL); Slidell High School (math 34% / reading 41%, grade F, #93 of 265 statewide, top 36%, 1,883 students, 52% FRL) — zoned schools average 58% FRL vs 40% district-wide (18 pts higher); higher-poverty schools than district average — tighter screening recommended.
- Market conditions: Rents rising fast (+5.9%/yr); 246 active listings in the ZIP; 3 comparable units currently listed for rent nearby; rentals at typical pace (median 26d on market — plan ~3-4 weeks tenant-placement turnaround); 1,064 units permitted in St. Tammany Parish in 2024 (0 in 5+ unit buildings).
- This rent runs 34% of the median local income ($63k/yr) — at the standard rent-burdened threshold; future hikes will face affordability resistance.
Forward outlook
- Local home prices are declining (-3.0%/yr); year-one equity from $1k of loan paydown is wiped out by about $6k of value loss. Plan a longer hold.
- St. Tammany County population projected at +27% by 2050 — long-run rental-demand tailwind backs the buy-and-hold thesis.
Negotiation context
- It's been on market 22 days — a 2% lower offer ($212k) is reasonable based on typical stale-listing flexibility.
- 15 sale attempts since 24y ago with the ask held roughly flat each time — persistent listings suggest the price (not the market) is what's stuck; bring a comps-based counter.
Risks & watch-outs
- Climate carrying-cost: moderate flood risk; severe wind risk, 99% chance of damaging wind over 30y; moderate wildfire risk; extreme-heat days projected 7→22/yr by 2055 (HVAC capex compounding) — expect insurance premiums to compound above CPI over the hold.
Questions for the listing agent
- Is there a deadline driving the sale (1031 exchange, divorce, estate, relocation)? That informs how much negotiation room exists.
- Schools are B-rated — typically a magnet for longer-tenancy family renters. What's the average tenant stay here, and is there a school-zone premium baked into asking?
- The area grade is low — what's the realistic commute time and amenity access for the typical tenant pool here? Any planned neighborhood developments (good or bad) we should know about?
- What's the average days-on-market for RENTAL listings here right now (not sales)? A rising rental-DOM trend means longer vacancies and softer asking-rent achievability than the comps imply.
- What's the recent tenant-quality profile in this submarket — average credit score on applications, eviction rate, late-payment / NSF rate, and stable-employment percentage? A property-management company in the area should have these aggregated.
- How much new for-sale + rental construction is in the pipeline within 1–3 miles? Heavy new supply typically softens prices + rents 12–24 months out; constrained supply supports both.
Investment metrics
- 1% rule
- 0.82% ✗
- Cap rate
- 6.43%
- Cash-on-cash
- 0.49%
- DSCR
- 1.02
- GRM
- 10.1
CMA / ARV
- ARV (on-the-fly)
- $153,482
- Comps found
- 12
Show comp detail 12 sales within ~0.75 mi
| Address | Dist | Beds/Ba | Sqft | Sold | Price | $/sf | Match |
|---|---|---|---|---|---|---|---|
| 2406 Bluebird St | 0.12mi | 3/2.0 | 1,218 (+6%) | 0mo | $175,000 | $144 | 85 |
| 100 Cedar Ridge Ct | 0.23mi | 3/2.0 | 1,166 (+1%) | 4mo | $199,999 | $172 | 84 |
| 2116 Jay St | 0.28mi | 3/2.0 | 1,170 (+1%) | 3mo | $202,500 | $173 | 82 |
| 2111 Robin St | 0.27mi | 3/2.0 | 1,230 (+7%) | 3mo | $215,000 | $175 | 74 |
| 2120 Oriole St | 0.31mi | 2/1.0 (-1) | 1,164 (+1%) | 2mo | $153,000 | $131 | 73 |
| 2523 Bluebird St | 0.34mi | 3/2.0 | 1,222 (+6%) | 2mo | $155,000 | $127 | 73 |
| 2022 Mallard St | 0.45mi | 3/1.0 | 1,148 (-0%) | 2mo | $165,000 | $144 | 73 |
| 2010 Pelican St | 0.37mi | 3/2.0 | 1,226 (+6%) | 3mo | $137,500 | $112 | 69 |
| 2030 Swan St | 0.54mi | 3/2.0 | 1,172 (+2%) | 5mo | $150,000 | $128 | 68 |
| 2218 Teal St | 0.38mi | 3/2.0 | 1,262 (+9%) | 3mo | $142,000 | $113 | 64 |
| 2110 Mallard St | 0.39mi | 2/2.0 (-1) | 1,266 (+10%) | 1mo | $125,000 | $99 | 60 |
| 2502 Mallard St | 0.39mi | 3/2.0 | 1,291 (+12%) | 3mo | $172,000 | $133 | 60 |
Match score weights: distance 35% · size 25% · config 20% · recency 20%. Top-matched comps best support the ARV.
Projected returns pro-forma
-3.0% appreciation · 5.91% rent growth · sell at horizon
- IRR
- -12.5%
- Equity multiple
- 0.54×
- Total profit
- $-27,963
- Equity at exit
- $32,057
- IRR
- 0.2%
- Equity multiple
- 1.01×
- Total profit
- $766
- Equity at exit
- $18,589
Cash invested: $60,200 (down + closing). Projections, not guarantees.
Landlord ↔ Tenant lean methodology
- Overall (STATE)
- 90 Strongly Landlord-Friendly
- State Louisiana
- 90 Strongly Landlord-Friendly · R+12
- County
- — inherits STATE
- City
- — inherits STATE
ZIP-level market 70460
- Rents YoY
- 5.9%
- Active inventory
- 246
- Price-to-rent
- 10.1×
Monthly cashflow live
- Estimated rent
- $1,771 medium interval (Pro) →
- Mortgage (P&I)
- −$1,127
- Tax from tax record
- −$157 /mo · $1,888/yr
- Insurance
- −$90
- HOA
- −$0
- Vacancy / Maint / Mgmt
- −$372
- Net cashflow
- $25
Break-even live
Sensitivity live
| Price | -10% $147 | -5% $86 | +0% $25 | +5% $-36 | +10% $-97 |
|---|---|---|---|---|---|
| Rent | -10% $-115 | -5% $-45 | +0% $25 | +5% $95 | +10% $165 |
| Rate | -1.0pp $133 | -0.5pp $80 | base $25 | +0.5pp $-31 | +1.0pp $-88 |
UW: 25.0% down · 7.5% · 30yr · 1.5% tax · 5.0% vac · 8.0% maint · 8.0% mgmt
Financing live
Cash to close
- Down payment
- $53,750
- Closing costs
- $6,450
- Reserves months
- —
- Total cash needed
- —
Loan-product check · same deal, 3 products live
Conventional
25% down · 7.5% · 30yr
- Down + closing
- —
- Monthly P&I
- —
- Monthly cashflow
- —
- DSCR
- —
- Eligible?
- —
Personal DTI + credit; lowest rate.
DSCR
20% down · 8.5% · 30yr
- Down + closing
- —
- Monthly P&I
- —
- Monthly cashflow
- —
- DSCR
- —
- Eligible?
- —
No personal income docs; deal must DSCR.
Hard money
10% down · 12.0% · 12mo
- Down + closing
- —
- Monthly P&I
- —
- Monthly cashflow
- —
- DSCR
- —
- Eligible?
- —
Short-term bridge; refi at stabilization.
Rent comps 3 comps
| Address | Beds | Baths | Sqft | Rent | $/sqft | DOM | Units | Dist |
|---|---|---|---|---|---|---|---|---|
| 2402 Pelican St Slidell, LA | 3.0 | 2.0 | 1400 | $1,700 | $1.21 | 25d | 1 | 0.10mi |
| 2322 Mallard St Slidell, LA | 3.0 | 2.0 | 1400 | $1,600 | $1.14 | 45d | 1 | 0.29mi |
| 2519 Crane St Slidell, LA | 3.0 | 2.0 | 1160 | $1,600 | $1.38 | 25d | 1 | 0.31mi |
Listing history 15 events
-
2026-06-21days on market $215,000 Active 22 DOM
-
2026-06-18days on market $215,000 Active 19 DOM
-
2026-06-17days on market $215,000 Active 18 DOM
-
2026-06-16days on market $215,000 Active 17 DOM
-
2026-06-15days on market $215,000 Active 16 DOM
-
2026-06-13days on market $215,000 Active 14 DOM
-
2026-06-10days on market $215,000 Active 11 DOM
-
2026-06-09days on market $215,000 Active 10 DOM
-
2026-06-08days on market $215,000 Active 9 DOM
-
2026-06-07days on market $215,000 Active 8 DOM
-
2026-06-03days on market $215,000 Active 4 DOM
-
2026-06-02days on market $215,000 Active 3 DOM
-
2026-06-01days on market $215,000 Active 2 DOM
-
2026-05-31remarks 419-char remark
-
2026-05-31$215,000 Active 1 DOM
ⓘ Source: listings_history table (triggers on properties + properties_extension) + one-shot
backfill from property_details.listing_events for pre-trigger history.
Tax reassessment forecast LA · Resets to sale price
- Current annual tax
- $1,888 · $157/mo
- Projected year-2 tax
- $1,888 · $157/mo
- Expected delta
- $0/yr ($0/mo · 0.0%)
ⓘ Screening estimate from a state-policy table — verify with the county assessor before closing.
Climate risk First Street
- Flood 5/10 Major FEMA zone X · 48% chance over 30 yrs
- Wildfire 5/10 Major
- Heat 10/10 Extreme 7 d/yr ≥108°F today · 22 d/yr by 30 yrs out
- Wind 9/10 Extreme 99% chance of damaging wind over 30 yrs
- Air quality 2/10 Low 1 unhealthy d/yr today · 2 by 30 yrs out
Nearby sold comps map
Loading sold comps map…
Walkable amenities ~0.75 mi
Loading nearby amenities…
Taxation est. · year 1
- Rental income
- $21,254
- − Mortgage interest
- −$12,043
- − Property taxes
- −$1,888
- − Insurance
- −$1,075
- − Repairs & maintenance
- −$1,700
- − Management
- −$1,700
- − Depreciation
- −$6,255
- Taxable loss
- −$3,407
- Est. tax savings @ 24.0%
- +$818
- After-tax cash flow
- $1,116/yr
For passive investors: Depreciation is non-cash, so a rental often shows a tax loss while cash-flowing — sheltering income. Rental losses are passive: they offset passive income freely, and up to $25,000/yr can offset ordinary (W-2) income if you actively participate and your MAGI is under $100k (phasing out to $0 by $150k); unused losses carry forward. On sale, claimed depreciation is recaptured at up to 25%, and gains may owe capital-gains tax (a 1031 exchange can defer both). Figures are a year-1 estimate at your 24.0% rate — not tax advice; consult a CPA.
Schools (NCES district)
- District
- St. Tammany Parish
- NCES district ID
- 2201650
- Math proficiency
- 43% ▼ -32.00%
- Reading proficiency
- 55% ▼ -26.00%
- Median HH income
- $61,752
- Composite
- 43.04/100
- National rank
- #3098
- State rank
- #11 of 98 in LA
Livability — Slidell
- Score
- 70/100
- State rank
- #57
- US rank
- #7673
Category grades
Schools grade is shown separately in the Schools card above.
Census & demographics
- County
- Saint Tammany Parish · 228,296 people
- City population
- 95,511
- Metro
- New Orleans-Metairie, LA
- Population (ZIP)
- 21,669
- Household income
- $62,565
- Rent vs Own
- Severe rent burden
- 318.0
Population outlook (St. Tammany County) Hauer SSP2
- Today (2025)
- 286,725 people
- By 2030
- 304,175 · +6.1%
- By 2040
- 336,203 · +17.3%
- By 2050
- 364,590 · +27.2%
- By 2075
- 433,362 · +51.1%
- By 2100
- 470,333 · +64.0%
Race, ethnicity, and origin ACS 2023
- Neighborhood character
- Diverse neighborhood (Simpson 0.62)
- Race & ethnicity
- White 53% Black 29% Two or more races 11% Hispanic / Latino 10% Pacific Islander 2%
- Hispanic origin (detail)
- Mexican 3%
- Common ancestry
- Lithuanian 13% Slovak 1% Italian 1%
- Foreign-born
- 5% · Canada
- Languages at home
- 92% English-only · Spanish 6%
Political lean MEDSL · St. Tammany
- 2024 margin
- Solid R (+43.8) · D 27.3% · R 71.1% · Other 1.6%
- 2008→2024 swing
- +9.6pp toward D · 2008: -53.4pp · 2024: -43.8pp
- All cycles
- 2024: R+43.8 2020: R+44.2 2016: R+50.8 2012: R+52.2 2008: R+53.4
Not yet ingested
- Civics
- —
Market trends
- HPI YoY
- ▼ -93.87%
- Current HPI
- 130.56
- Rent YoY
- ▲ 5.91%
- Metro
- New Orleans-Metairie, LA
- State GDP YoY
- ▲ 3.29%
- F500 in state
- 10
Industry mix (Fortune 500 HQ in LA)
| Industry | F500 HQs | Revenue |
|---|---|---|
| Telecommunications | 2 | $23B |
|
||
| Utilities | 1 | $12B |
|
||
| Wholesale / Distribution | 1 | $5B |
|
||
| Advertising | 1 | $2B |
|
||
Price history
+230.8% since first listed35 events — show timeline
- 2026-05-30 Listed $215,000 AcadianaMLS
- 2026-05-30 Listed $215,000 GSREIN
- 2025-11-20 Sold (Public Records) $198,500 Public Records
- 2025-11-20 Sold (MLS) $195,000 GSREIN
- 2025-10-24 Pending — GSREIN
- 2025-10-13 Contingent — GSREIN
- 2025-08-05 Price Changed $199,000 AcadianaMLS
- 2025-08-05 Price Changed $199,000 GSREIN
- 2025-06-19 Listed $199,000 AcadianaMLS
- 2025-06-19 Listed $215,000 AcadianaMLS
- 2025-06-19 Listed $215,000 GSREIN
- 2025-03-26 Sold (MLS) $105,000 GSREIN
- 2025-03-05 Pending — GSREIN
- 2025-03-05 Relisted — GSREIN
- 2025-02-27 Pending — GSREIN
- 2025-02-27 Price Changed $117,900 AcadianaMLS
- 2025-02-19 Price Changed $117,900 GSREIN
- 2025-01-12 Price Changed $129,900 AcadianaMLS
- 2025-01-11 Price Changed $129,900 GSREIN
- 2024-12-10 Listed $154,900 GSREIN
- 2024-12-10 Listed $154,900 AcadianaMLS
- 2024-04-09 Delisted — GBRMLS
- 2024-04-08 Listed $99,000 AcadianaMLS
- 2024-04-08 Listed $99,000 GBRMLS
- 2021-06-07 Sold (Public Records) $153,000 Public Records
- 2021-06-04 Sold (MLS) $153,000 GSREIN
- 2021-04-17 Pending — GSREIN
- 2021-04-16 Relisted — GSREIN
- 2021-03-08 Pending — GSREIN
- 2021-02-26 Listed $149,900 GSREIN
- 2021-02-26 Listed $149,900 AcadianaMLS
- 2003-01-22 Sold (Public Records) $60,000 Public Records
- 2003-01-17 Sold (MLS) $60,000 GSREIN
- 2002-10-10 Listed $65,000 GSREIN
- 2002-10-10 Listed $65,000 AcadianaMLS
Property tax history
+2.6%/yrLatest (2025): $1,888 · -3.9% YoY. Source: county tax records.
Cash-flow waterfall
monthlySold comps — $/sqft
last 12 mo · ≤1 miLoading sold comps…