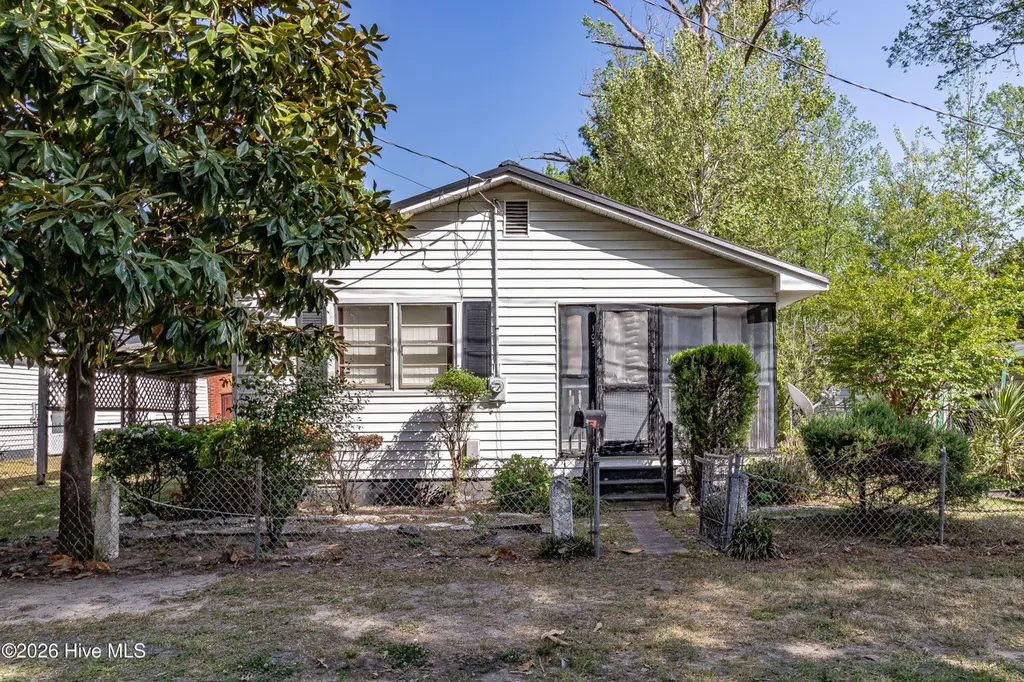
103 Springhill St · La Grange, NC
Flood risk 1/10 · Minimal
- FEMA flood zone
- X (unshaded)
- Chance of flooding over 30 yrs
- 0.0%
- Est. flood insurance / yr
- $507 – $1,088
Fire risk 4/10 · Minor
- Est. fire insurance / yr
- $906 – $1,684
Heat risk 7/10 · Major
- Hot days now (above 108°F)
- 7 days/yr
- Hot days in 30 yrs
- 17 days/yr
Wind risk 8/10 · Major
- Chance of severe wind over 30 yrs
- 80.0%
Air-quality risk 2/10 · Minimal
- Unhealthy air days now
- 1 days/yr
- Unhealthy air days in 30 yrs
- 1 days/yr
Risk factors via First Street. Map © Google.
Why this score? — see what drove the C+ grade
The composite is a weighted blend of 9 inputs, each scored 0–100. Each bar is that input's sub-score; the figure is the points it added to the 100-point composite (weight × sub-score).
- Cash flow +30.0/30.0
- 1% rule +10.0/10.0
- DSCR +10.0/10.0
- Livability +3.3/5.0
- Rent growth +2.5/5.0
- Schools +2.5/10.0
- Condition / age +2.5/5.0
- ARV discount +0.0/15.0
- Appreciation +0.0/10.0
$89,900
🖨 Deal sheet 📄 Offer letter ✓ Due diligence
Listing remarks
This Charming Home would be a perfect Starter Home or great opportunity to add another home to your rental Portfolio. This Home Features 2 bedrooms and 1 Full bathroom and a cozy screen porch. Located in the city limits of La Grange.
Key facts
- 3,049 sq ft lot
- Built 1968
- Listed 63 days
Property features AI
Exterior
- Parking: Gravel parking
- Utilities: Sewer connected; Water connected
- Home design: Single-family residence; One story; Entry level: 1
- Construction: Vinyl siding and frame construction
- Exterior features: Screened porch; Partial fencing; Metal roof; City street and state road frontage; Frontage: see remarks; Lot dimensions approximately 50 x 60; Approximately 0.07 acres; Zoned residential
Interior
- Bathrooms: 1 full bathroom
- Heating & cooling: Wall/Window air conditioning unit(s); Propane heating; Wall furnace
- Interior features: Crawl space basement; Has view; Total of 5 rooms
Neighborhood map
What this means for you Summary
Snapshot
- This is a 2-bed/1.0-bath single-family listed at $90k.
Deal economics
- At list price, monthly cash flow is $699 ($8k/yr) — positive.
- The deal already cash-flows at list — no discount required.
- Meets the 1% rule at list price ($2k rent vs $90k).
- Recommended offer: $85k (6.0% below list) — sets the bar for market timing.
- Cap rate 15.6% vs local median 4.3% in La Grange — top-decile yield for the area; either an underpriced asset or a hidden risk that comps aren't pricing in. Stress-test before assuming the spread holds.
Location & tenants
- Location reads 66/100 on livability (#278 in NC) — a middle-class / working-renter tenant base. Strengths: crime A+, cost of living A+, housing A+; Watch: amenities F, commute F, health & safety F.
- Lenoir County Public Schools (rural): math 29% / reading 32% proficiency, ranked #147 of 178 in NC (top 83%) — families likely to look elsewhere, expect single-tenant / working-renter base with shorter leases; 65% free/reduced lunch — lower-income household profile, screen leases tightly.
- Zoned schools: La Grange Elementary (math 32% / reading 32%, grade F, #908 of 1,410 statewide, top 67%, 498 students, 99% FRL) — zoned schools average 99% FRL vs 65% district-wide (35 pts higher); higher-poverty schools than district average — tighter screening recommended.
- Market conditions: 86 active listings in the ZIP; 148 units permitted in Lenoir County in 2024 (0 in 5+ unit buildings).
Forward outlook
- Local home prices are declining (-3.0%/yr); year-one equity from $622 of loan paydown is wiped out by about $3k of value loss. Plan a longer hold.
- Lenoir County population projected at -18% by 2050 — secular population decline; favor cash flow + early exit over multi-decade hold.
- At projected returns (-3.0% appreciation + 3.0% rent growth), your $25k cash investment doubles in ~4 years — after that, you're playing with house money.
Negotiation context
- It's been on market 64 days — a 6% lower offer ($85k) is reasonable based on typical stale-listing flexibility.
Risks & watch-outs
- Climate carrying-cost: severe wind risk, 80% chance of damaging wind over 30y; extreme-heat days projected 7→17/yr by 2055 (HVAC capex compounding) — expect insurance premiums to compound above CPI over the hold.
Questions for the listing agent
- It's been on market 64 days. Have you received any prior offers? Is the seller open to a 6% concession, seller financing, or rate buy-down credit?
- Built in 1968 — when were the roof, HVAC, electrical panel, plumbing, and water heater last replaced?
- Why hasn't it sold? Are there any deal-killer items the seller is aware of (foundation, flood, title, zoning, code violations)?
- Is there a deadline driving the sale (1031 exchange, divorce, estate, relocation)? That informs how much negotiation room exists.
- Schools are F-rated, which usually means shorter tenancies and higher turnover. Who's the typical renter profile here, and what's been the actual vacancy rate?
- What's the average days-on-market for RENTAL listings here right now (not sales)? A rising rental-DOM trend means longer vacancies and softer asking-rent achievability than the comps imply.
- What's the recent tenant-quality profile in this submarket — average credit score on applications, eviction rate, late-payment / NSF rate, and stable-employment percentage? A property-management company in the area should have these aggregated.
- How much new for-sale + rental construction is in the pipeline within 1–3 miles? Heavy new supply typically softens prices + rents 12–24 months out; constrained supply supports both.
Investment metrics
- 1% rule
- 1.74% ✓
- Cap rate
- 15.62%
- Cash-on-cash
- 33.31%
- DSCR
- 2.48
- GRM
- 4.8
CMA / ARV
- ARV (on-the-fly)
- $71,530
- Comps found
- 3
Show comp detail 3 sales within ~0.75 mi
| Address | Dist | Beds/Ba | Sqft | Sold | Price | $/sf | Match |
|---|---|---|---|---|---|---|---|
| 302 W James St | 0.57mi | 2/1.0 | 608 (-2%) | 5mo | $70,000 | $115 | 65 |
| 301 N Center St | 0.60mi | 1/1.0 (-1) | 650 (+4%) | 13mo | $82,500 | $127 | 49 |
| 118 W King St | 0.57mi | 1/1.0 (-1) | 615 (-1%) | 22mo | $59,000 | $96 | 48 |
Match score weights: distance 35% · size 25% · config 20% · recency 20%. Top-matched comps best support the ARV.
Projected returns pro-forma
-3.0% appreciation · 3.0% rent growth · sell at horizon
- IRR
- 28.5%
- Equity multiple
- 2.19×
- Total profit
- $29,902
- Equity at exit
- $13,404
- IRR
- 35.9%
- Equity multiple
- 4.31×
- Total profit
- $83,223
- Equity at exit
- $7,773
Cash invested: $25,172 (down + closing). Projections, not guarantees.
Landlord ↔ Tenant lean methodology
- Overall (STATE)
- 85 Strongly Landlord-Friendly
- State North Carolina
- 85 Strongly Landlord-Friendly · R+3
- County
- — inherits STATE
- City
- — inherits STATE
ZIP-level market 28551
- Home prices YoY
- -16.2%
- Active inventory
- 86
- Price-to-rent
- 4.8×
Monthly cashflow live
- Estimated rent
- $1,566 medium interval (Pro) →
- Mortgage (P&I)
- −$471
- Tax from tax record
- −$29 /mo · $351/yr
- Insurance
- −$37
- HOA
- −$0
- Vacancy / Maint / Mgmt
- −$329
- Net cashflow
- $699
Break-even live
UW: 25.0% down · 7.5% · 30yr · 1.5% tax · 5.0% vac · 8.0% maint · 8.0% mgmt
Financing live
Cash to close
- Down payment
- $22,475
- Closing costs
- $2,697
- Reserves months
- —
- Total cash needed
- —
Loan-product check · same deal, 3 products live
Conventional
25% down · 7.5% · 30yr
- Down + closing
- —
- Monthly P&I
- —
- Monthly cashflow
- —
- DSCR
- —
- Eligible?
- —
Personal DTI + credit; lowest rate.
DSCR
20% down · 8.5% · 30yr
- Down + closing
- —
- Monthly P&I
- —
- Monthly cashflow
- —
- DSCR
- —
- Eligible?
- —
No personal income docs; deal must DSCR.
Hard money
10% down · 12.0% · 12mo
- Down + closing
- —
- Monthly P&I
- —
- Monthly cashflow
- —
- DSCR
- —
- Eligible?
- —
Short-term bridge; refi at stabilization.
Listing history 17 events
-
2026-06-19days on market $89,900 Active 64 DOM
-
2026-06-18days on market $89,900 Active 63 DOM
-
2026-06-17days on market $89,900 Active 62 DOM
-
2026-06-16days on market $89,900 Active 61 DOM
-
2026-06-15days on market $89,900 Active 60 DOM
-
2026-06-14days on market $89,900 Active 58 DOM
-
2026-06-12days on market $89,900 Active 57 DOM
-
2026-06-09days on market $89,900 Active 54 DOM
-
2026-06-08days on market $89,900 Active 53 DOM
-
2026-06-07days on market $89,900 Active 52 DOM
-
2026-06-07days on market $89,900 Active 51 DOM
-
2026-06-04days on market $89,900 Active 48 DOM
-
2026-06-02days on market $89,900 Active 47 DOM
-
2026-06-01days on market $89,900 Active 46 DOM
-
2026-05-31days on market $89,900 Active 45 DOM
-
2026-05-31days on market $89,900 Active 44 DOM
-
2026-04-16$89,900 Active
ⓘ Source: listings_history table (triggers on properties + properties_extension) + one-shot
backfill from property_details.listing_events for pre-trigger history.
Tax reassessment forecast NC · Resets to sale price
- Current annual tax
- $351 · $29/mo
- Projected year-2 tax
- $737 · $61/mo
- Expected delta
- +$386/yr (+$32/mo · 110.0%)
ⓘ Screening estimate from a state-policy table — verify with the county assessor before closing.
Climate risk First Street
- Flood 1/10 Low FEMA zone X (unshaded) · 0% chance over 30 yrs
- Wildfire 4/10 Moderate
- Heat 7/10 Severe 7 d/yr ≥108°F today · 17 d/yr by 30 yrs out
- Wind 8/10 Severe 80% chance of damaging wind over 30 yrs
- Air quality 2/10 Low 1 unhealthy d/yr today · 1 by 30 yrs out
Nearby sold comps map
Loading sold comps map…
Walkable amenities ~0.75 mi
Loading nearby amenities…
Taxation est. · year 1
- Rental income
- $18,787
- − Mortgage interest
- −$5,036
- − Property taxes
- −$351
- − Insurance
- −$450
- − Repairs & maintenance
- −$1,503
- − Management
- −$1,503
- − Depreciation
- −$2,615
- Taxable income
- $7,329
- Est. tax owed @ 24.0%
- −$1,759
- After-tax cash flow
- $6,625/yr
For passive investors: Depreciation is non-cash, so a rental often shows a tax loss while cash-flowing — sheltering income. Rental losses are passive: they offset passive income freely, and up to $25,000/yr can offset ordinary (W-2) income if you actively participate and your MAGI is under $100k (phasing out to $0 by $150k); unused losses carry forward. On sale, claimed depreciation is recaptured at up to 25%, and gains may owe capital-gains tax (a 1031 exchange can defer both). Figures are a year-1 estimate at your 24.0% rate — not tax advice; consult a CPA.
Schools (NCES district)
- District
- Lenoir County Public Schools
- NCES district ID
- 3702610
- Math proficiency
- 29% ▲ 1.00%
- Reading proficiency
- 32% ▼ -4.00%
- Median HH income
- $34,958
- Composite
- 25.17/100
- National rank
- #7515
- State rank
- #147 of 178 in NC
Livability — La Grange
- Score
- 66/100
- State rank
- #278
- US rank
- #12047
Category grades
Schools grade is shown separately in the Schools card above.
Census & demographics
- Census place
- La Grange, NC
- Population (ZIP)
- 13,264
Population outlook (Lenoir County) Hauer SSP2
- Today (2025)
- 55,002 people
- By 2030
- 53,048 · -3.6%
- By 2040
- 49,041 · -10.8%
- By 2050
- 45,136 · -17.9%
- By 2075
- 36,547 · -33.6%
- By 2100
- 27,731 · -49.6%
Race, ethnicity, and origin ACS 2023
- Neighborhood character
- Diverse neighborhood (Simpson 0.62)
- Race & ethnicity
- White 56% Black 21% Hispanic / Latino 16% Two or more races 8%
- Hispanic origin (detail)
- Mexican 14%
- Common ancestry
- Slovak 1% Portuguese 1% Slovene 1%
- Foreign-born
- 5% · Canada
- Languages at home
- 87% English-only · Spanish 12%
Political lean MEDSL · Lenoir
- 2024 margin
- Lean R (+6.8) · D 46.2% · R 53.0%
- 2008→2024 swing
- -6.7pp toward R · 2008: -0.1pp · 2024: -6.8pp
- All cycles
- 2024: R+6.8 2020: R+3.5 2016: R+6.3 2012: R+1.5 2008: R+0.1
Not yet ingested
- Civics
- —
Market trends
- HPI YoY
- ▼ -41.90%
- Current HPI
- 216.483
- Rent YoY
- —
- Metro
- —
- State GDP YoY
- ▲ 3.28%
- F500 in state
- 26
Industry mix (Fortune 500 HQ in NC)
| Industry | F500 HQs | Revenue |
|---|---|---|
| Financial Services | 2 | $213B |
|
||
| Retail | 2 | $95B |
|
||
| Industrial Conglomerate | 1 | $38B |
|
||
| Metals / Steel | 1 | $35B |
|
||
| Utilities | 1 | $30B |
|
||
| Industrial Machinery | 1 | $19B |
|
||
Price history
1 event — show timeline
- 2026-04-16 Listed $89,900 Hive MLS
Property tax history
+5.2%/yrLatest (2025): $351 · +85.8% YoY. Source: county tax records.
Cash-flow waterfall
monthlySold comps — $/sqft
last 12 mo · ≤1 miLoading sold comps…