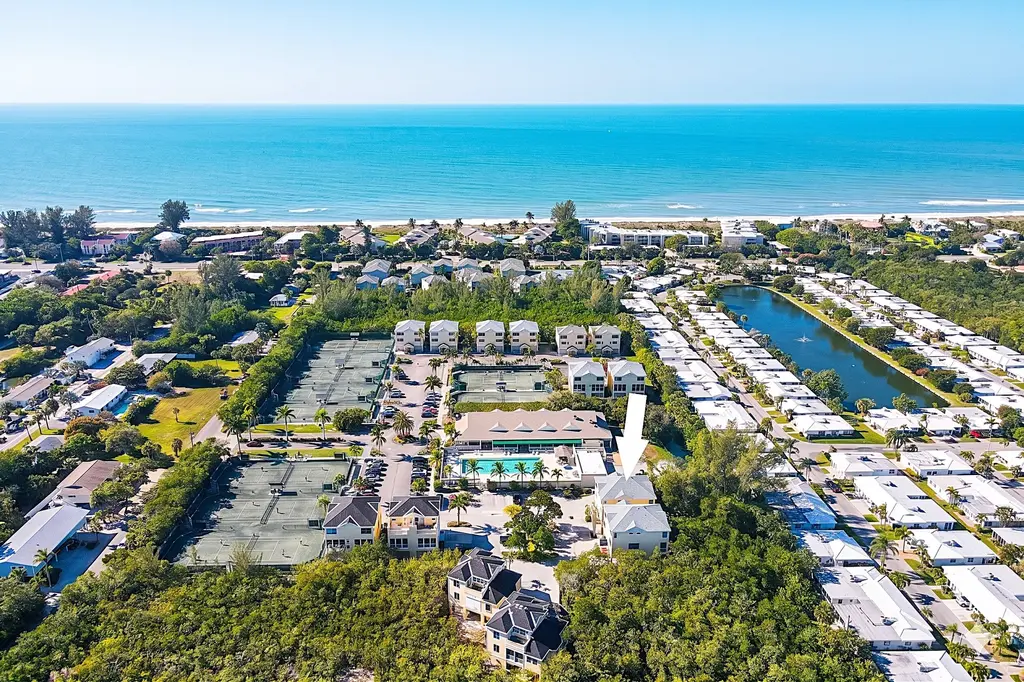
660 Cedars Ct · Longboat Key, FL
Flood risk 9/10 · Severe
- FEMA flood zone
- AE
- Chance of flooding over 30 yrs
- 0.99%
- Est. flood insurance / yr
- $1,737 – $8,500
Fire risk 1/10 · Minimal
- Est. fire insurance / yr
- $947 – $1,759
Heat risk 10/10 · Severe
- Hot days now (above 106°F)
- 7 days/yr
- Hot days in 30 yrs
- 29 days/yr
Wind risk 10/10 · Severe
- Chance of severe wind over 30 yrs
- 99.0%
Air-quality risk 3/10 · Minor
- Unhealthy air days now
- 2 days/yr
- Unhealthy air days in 30 yrs
- 2 days/yr
Risk factors via First Street. Map © Google.
Why this score? — see what drove the C grade
The composite is a weighted blend of 9 inputs, each scored 0–100. Each bar is that input's sub-score; the figure is the points it added to the 100-point composite (weight × sub-score).
- Cash flow +18.8/30.0
- ARV discount +7.5/15.0
- 1% rule +5.9/10.0
- DSCR +5.9/10.0
- Appreciation +5.4/10.0
- Schools +4.4/10.0
- Livability +3.2/5.0
- Rent growth +2.5/5.0
- Condition / age +2.5/5.0
$589,000
🖨 Deal sheet 📄 Offer letter ✓ Due diligence
Listing remarks
Under contract-accepting backup offers. Rare Turn-Key Gem in Cedars East | Proven $55k+ Annual Income! Experience the ultimate in coastal luxury and investment savvy in this stunning, fully furnished 3-level retreat. Nestled within the lush, sought-after Cedars East community, this 2-bedroom, 2-bathroom home is a proven performer, having generated over $55,000 in short-term rental income in 2025 alone. Whether you are looking for a lucrative addition to your portfolio or a seamless move into your dream primary residence, this property is truly "turn-key"—every piece of stylish furniture and essential household item is included. Simply bring your suitcase and start living th
Key facts
- Attached garage
- Open-concept kitchen
- Bamboo cabinetry
Tags
Property features AI
Finance
- Other: Turnkey furnished; Association recreation available for lease
- Financial info: Total monthly fees listed as $873.33; total annual fees listed as $10,480; Lease restrictions apply
- HOA & community: Has HOA (Coastal Association Management); Monthly condo fee: $873 (quarterly fees shown as $2,620); Association amenities include pool, fitness center, clubhouse, tennis and pickleball courts, recreation facilities, maintenance, cable TV; Association fees include cable TV, pool, and trash; Community features include reclaimed water irrigation, sidewalks, community mailbox, and special community restrictions; Pets allowed
Exterior
- Parking: Covered driveway; Ground level parking; Attached garage (1 car)
- Security: Smoke detectors
- Utilities: Public water; Public sewer; Electricity connected; Sewer connected; Water connected
- Home design: Residential garage condo; Three or more stories; Faces south; Unit on 2nd floor
- Construction: Cement and wood siding; Shingle roof; Slab foundation; Building identified as 660
- Pool Information: Heated in-ground pool
- Exterior features: Covered, screened rear porch; Covered patio/porch; Rain gutters; Sidewalk; Sliding doors; Tennis courts on property; Near marina; Private setting; Landscaped with trees; Concrete road; privately maintained
- Waterfront / Access: Water access to bay/harbor, beach, gulf/ocean; Boat port
Interior
- Kitchen: Built-in oven; Cooktop; Dishwasher; Disposal; Exhaust fan; Freezer; Ice maker; Microwave; Range hood; Refrigerator; Water purifier
- Bedrooms: 2 bedrooms
- Flooring: Carpet; Laminate; Tile
- Bathrooms: 2 full bathrooms
- Heating & cooling: Electric heating; Heat pump; Zoned heating; Central air; Zoned cooling
- Interior features: Ceiling fans; Eat-in kitchen; Kitchen/family room combo; Living room/dining room combo; Open floorplan; Split bedroom layout; Stone countertops; Thermostat; Window treatments; Aluminum window frames; Storm windows
- Laundry & utility: Washer and dryer in garage; Electric water heater
Neighborhood map
What this means for you Summary
Snapshot
- This is a 2-bed/2.0-bath condo listed at $589k.
Deal economics
- At list price, monthly cash flow is $166 ($2k/yr) — positive.
- The deal already cash-flows at list — no discount required.
- Meets the 1% rule at list price ($6k rent vs $589k).
- Recommended offer: $580k (1.5% below list) — sets the bar for market timing.
- Cap rate 7.5% vs local median 0.5% in Longboat Key — top-decile yield for the area; either an underpriced asset or a hidden risk that comps aren't pricing in. Stress-test before assuming the spread holds.
Location & tenants
- Location reads 64/100 on livability (#693 in FL) — a middle-class / working-renter tenant base. Strengths: crime A+, employment A+; Watch: housing C-, amenities F, commute F.
- Manatee (suburban): math 54% / reading 50% proficiency, ranked #26 of 73 in FL (top 36%) — acceptable for families but not a draw, mixed tenant base, ~2y average lease.
- Zoned schools: Anna Maria Elementary School (math 77% / reading 77%, grade A, #170 of 2,144 statewide, top 9%, 190 students, 36% FRL); Bayshore High School (math 17% / reading 26%, grade F, #546 of 667 statewide, top 82%, 1,435 students, 65% FRL) — zoned schools at 50% FRL track the district average.
- Market conditions: 539 active listings in the ZIP; 16 comparable units currently listed for rent nearby; rentals at typical pace (median 24d on market — plan ~3-4 weeks tenant-placement turnaround); high-income renter base; 7,472 units permitted in Manatee County in 2024 (1,782 in 5+ unit buildings).
Forward outlook
- In year one you build about $8k of equity ($4k loan paydown + $4k appreciation (0.7% local appreciation)).
- Manatee County population projected at +43% by 2050 — long-run rental-demand tailwind backs the buy-and-hold thesis.
- At projected returns (0.7% appreciation + 3.0% rent growth), your $165k cash investment doubles in ~10 years — after that, you're playing with house money.
- By year 5, paydown + projected appreciation supports a ~$40k cash-out refi (75% LTV) — recoverable capital for the next deal without selling this one.
Negotiation context
- It's been on market 19 days — a 2% lower offer ($580k) is reasonable based on typical stale-listing flexibility.
- 6 sale attempts since 18y ago with the ask held roughly flat each time — persistent listings suggest the price (not the market) is what's stuck; bring a comps-based counter.
Risks & watch-outs
- Watch-outs: flood insurance adds $427/mo.
- Climate carrying-cost: in FEMA flood zone AE (mandatory federal flood insurance); severe wind risk, 99% chance of damaging wind over 30y; extreme-heat days projected 7→29/yr by 2055 (HVAC capex compounding) — expect insurance premiums to compound above CPI over the hold.
Questions for the listing agent
- What's the actual annual flood-insurance premium (NFIP or private), and is the property in a SFHA with mandatory coverage?
- What does the HOA fee cover, when was the last increase, and are there any pending special assessments or reserve-fund shortfalls?
- Any open or pending special assessments — roof, HVAC, plumbing, elevator, façade? What's the per-unit balance and payoff schedule, and is the seller paying it off at close or rolling it to the buyer?
- Is there a deadline driving the sale (1031 exchange, divorce, estate, relocation)? That informs how much negotiation room exists.
- What's the average days-on-market for RENTAL listings here right now (not sales)? A rising rental-DOM trend means longer vacancies and softer asking-rent achievability than the comps imply.
- What's the recent tenant-quality profile in this submarket — average credit score on applications, eviction rate, late-payment / NSF rate, and stable-employment percentage? A property-management company in the area should have these aggregated.
- How much new apartment / multifamily construction is in the pipeline within 1–3 miles? Heavy new supply (>2% of stock underway) typically softens rents 12–24 months out; light construction supports rent growth.
Investment metrics
- 1% rule
- 1.09% ✓
- Cap rate
- 7.50%
- Cash-on-cash
- 4.31%
- DSCR
- 1.19
- GRM
- 7.6
CMA / ARV
No comps found within radius.
Projected returns pro-forma
0.73% appreciation · 3.0% rent growth · sell at horizon
- IRR
- 1.8%
- Equity multiple
- 1.09×
- Total profit
- $14,384
- Equity at exit
- $192,775
- IRR
- 6.7%
- Equity multiple
- 1.79×
- Total profit
- $129,750
- Equity at exit
- $249,882
Cash invested: $164,920 (down + closing). Projections, not guarantees.
Landlord ↔ Tenant lean methodology
- Overall (STATE)
- 87 Strongly Landlord-Friendly
- State Florida
- 87 Strongly Landlord-Friendly · R+3
- County
- — inherits STATE
- City
- — inherits STATE
ZIP-level market 34228
- Home prices YoY
- 0.3%
- Active inventory
- 539
- Price-to-rent
- 7.6×
Monthly cashflow live
- Estimated rent
- $6,446 high interval (Pro) →
- Mortgage (P&I)
- −$3,089
- Tax from tax record
- −$293 /mo · $3,518/yr
- Insurance
- −$245
- Flood insurance flood zone
- −$427 /mo · $5,118/yr
- HOA
- −$873
- Vacancy / Maint / Mgmt
- −$1,354
- Net cashflow
- $166
Break-even live
UW: 25.0% down · 7.5% · 30yr · 1.5% tax · 5.0% vac · 8.0% maint · 8.0% mgmt
Financing live
Cash to close
- Down payment
- $147,250
- Closing costs
- $17,670
- Reserves months
- —
- Total cash needed
- —
Loan-product check · same deal, 3 products live
Conventional
25% down · 7.5% · 30yr
- Down + closing
- —
- Monthly P&I
- —
- Monthly cashflow
- —
- DSCR
- —
- Eligible?
- —
Personal DTI + credit; lowest rate.
DSCR
20% down · 8.5% · 30yr
- Down + closing
- —
- Monthly P&I
- —
- Monthly cashflow
- —
- DSCR
- —
- Eligible?
- —
No personal income docs; deal must DSCR.
Hard money
10% down · 12.0% · 12mo
- Down + closing
- —
- Monthly P&I
- —
- Monthly cashflow
- —
- DSCR
- —
- Eligible?
- —
Short-term bridge; refi at stabilization.
Rent comps 16 comps
| Address | Beds | Baths | Sqft | Rent | $/sqft | DOM | Units | Dist |
|---|---|---|---|---|---|---|---|---|
| 655 Cedars Ct #655 Longboat Key, FL | 1.0 | 2.0 | 1244 | $7,000 | $5.63 | 23d | 1 | 0.03mi |
| 730 Spanish Dr S #99 Longboat Key, FL | 2.0 | 2.0 | 1255 | $2,800 | $2.23 | 2d | 1 | 0.05mi |
| 676 El Centro Longboat Key, FL | 2.0 | 2.0 | 1427 | $3,250 | $2.28 | 23d | 1 | 0.06mi |
| 820 Spanish Dr S Longboat Key, FL | 2.0 | 2.0 | 1390 | $3,000 | $2.16 | 16d | 1 | 0.13mi |
| 535 Forest Way Longboat Key, FL | 2.0 | 2.5 | 1440 | $6,900 | $4.79 | 23d | 1 | 0.17mi |
| 573 Spanish Dr N Longboat Key, FL | 2.0 | 2.0 | 1380 | $3,500 | $2.54 | 16d | 1 | 0.17mi |
| 914 Spanish Dr S #76 Longboat Key, FL | 2.0 | 2.0 | 1341 | $6,500 | $4.85 | 23d | 1 | 0.23mi |
| 957 Spanish Dr N Longboat Key, FL | 2.0 | 2.0 | 1399 | $5,500 | $3.93 | 23d | 1 | 0.28mi |
| 5621 Gulf of Mexico Dr #103 Longboat Key, FL | 3.0 | 2.0 | 1731 | $5,500 | $3.18 | 23d | 1 | 0.29mi |
| 5621 Gulf of Mexico Dr #102 Longboat Key, FL | 2.0 | 2.0 | 1346 | $6,000 | $4.46 | 23d | 1 | 0.29mi |
| 5611 Gulf of Mexico Dr #3 Longboat Key, FL | 3.0 | 2.0 | 1635 | $5,000 | $3.06 | 23d | 1 | 0.31mi |
| 5611 Gulf of Mexico Dr #5 Longboat Key, FL | 3.0 | 3.0 | 1672 | $7,750 | $4.64 | 23d | 1 | 0.31mi |
| 5611 Gulf of Mexico Dr #1 Longboat Key, FL | 3.0 | 2.0 | 1675 | $14,000 | $8.36 | 23d | 1 | 0.31mi |
| 615 Dream Island Rd #107 Longboat Key, FL | 2.0 | 2.0 | 1293 | $12,500 | $9.67 | 23d | 1 | 0.59mi |
| 615 Dream Island Rd #201 Longboat Key, FL | 2.0 | 2.0 | 1514 | $10,500 | $6.94 | 23d | 1 | 0.59mi |
| 4825 Gulf of Mexico Dr #201 Longboat Key, FL | 2.0 | 2.0 | 1393 | $7,800 | $5.60 | 23d | 1 | 1.27mi |
HOA detail condo
- Monthly dues
- $873 · $10,476/yr
- Assessments
- None detected in remarks — confirm with the listing agent.
Listing history 24 events
-
2026-05-04status Pending
-
2026-04-15$589,000 Active
-
2025-04-30historical
-
2025-03-20$649,000 Active
-
2024-07-03status Pending
-
2024-07-02historical
-
2024-05-23price $720,000
-
2024-04-25$760,000 Active
-
2022-04-29soldstatus $600,000 Closed
-
2022-04-29soldstatus $600,000
-
2022-04-08status Pending
-
2022-04-03$595,000 Active
-
2016-02-02soldstatus $257,000
-
2016-02-01soldstatus $257,000 Sold
-
2015-12-05status Pending
-
2015-03-28price $265,000
-
2015-03-18$275,000 Active
-
2008-10-22$319,000
-
2004-08-19soldstatus $389,900
-
2003-08-13soldstatus $275,000
-
2003-04-08soldstatus $235,000
-
1992-11-19soldstatus $199,000
-
1991-03-22soldstatus $199,000
-
1989-12-01soldstatus $1,700,000
ⓘ Source: listings_history table (triggers on properties + properties_extension) + one-shot
backfill from property_details.listing_events for pre-trigger history.
Tax reassessment forecast FL · Resets to sale price
- Current annual tax
- $3,518 · $293/mo
- Projected year-2 tax
- $4,889 · $407/mo
- Expected delta
- +$1,370/yr (+$114/mo · 38.9%)
ⓘ Screening estimate from a state-policy table — verify with the county assessor before closing.
Climate risk First Street
- Flood 9/10 Extreme FEMA zone AE · 99% chance over 30 yrs
- Wildfire 1/10 Low
- Heat 10/10 Extreme 7 d/yr ≥106°F today · 29 d/yr by 30 yrs out
- Wind 10/10 Extreme 99% chance of damaging wind over 30 yrs
- Air quality 3/10 Moderate 2 unhealthy d/yr today · 2 by 30 yrs out
Nearby sold comps map
Loading sold comps map…
Walkable amenities ~0.75 mi
Loading nearby amenities…
Taxation est. · year 1
- Rental income
- $77,355
- − Mortgage interest
- −$32,993
- − Property taxes
- −$3,518
- − Insurance
- −$8,064
- − Repairs & maintenance
- −$6,188
- − Management
- −$6,188
- − HOA
- −$10,476
- − Depreciation
- −$17,135
- Taxable loss
- −$7,207
- Est. tax savings @ 24.0%
- +$1,730
- After-tax cash flow
- $3,717/yr
For passive investors: Depreciation is non-cash, so a rental often shows a tax loss while cash-flowing — sheltering income. Rental losses are passive: they offset passive income freely, and up to $25,000/yr can offset ordinary (W-2) income if you actively participate and your MAGI is under $100k (phasing out to $0 by $150k); unused losses carry forward. On sale, claimed depreciation is recaptured at up to 25%, and gains may owe capital-gains tax (a 1031 exchange can defer both). Figures are a year-1 estimate at your 24.0% rate — not tax advice; consult a CPA.
Schools (NCES district)
- District
- Manatee
- NCES district ID
- 1201230
- Math proficiency
- 54% ▼ -6.00%
- Reading proficiency
- 50% ▼ -2.00%
- Median HH income
- $49,607
- Composite
- 44.43/100
- National rank
- #2806
- State rank
- #26 of 73 in FL
Livability — Longboat Key
- Score
- 64/100
- State rank
- #693
- US rank
- #14452
Category grades
Schools grade is shown separately in the Schools card above.
Census & demographics
- Census place
- Longboat Key, FL
- County
- Sarasota County · 448,376 people
- City population
- 7,539
- Metro
- North Port-Sarasota-Bradenton, FL
- Population (ZIP)
- 7,539
- Household income
- $158,030
- Rent vs Own
- Severe rent burden
- 98.0
Population outlook (Manatee County) Hauer SSP2
- Today (2025)
- 447,342 people
- By 2030
- 488,911 · +9.3%
- By 2040
- 567,934 · +27.0%
- By 2050
- 637,995 · +42.6%
- By 2075
- 781,970 · +74.8%
- By 2100
- 848,272 · +89.6%
Race, ethnicity, and origin ACS 2023
- Neighborhood character
- Predominantly White (93%)
- Race & ethnicity
- White 93% Hispanic / Latino 4% Two or more races 3% Asian 1%
- Common ancestry
- Scotch-Irish 7% Romanian 6% Lithuanian 4%
- Foreign-born
- 14% · Canada, China
- Languages at home
- 92% English-only · Spanish 2% Other Indo-European 2% German/W. Germanic 2%
Political lean MEDSL · Manatee
- 2024 margin
- Strong R (+23.5) · D 37.9% · R 61.4%
- 2008→2024 swing
- -16.5pp toward R · 2008: -7.0pp · 2024: -23.5pp
- All cycles
- 2024: R+23.5 2020: R+16.1 2016: R+17.1 2012: R+12.5 2008: R+7.0
Not yet ingested
- Civics
- —
Market trends
- HPI YoY
- ▲ 0.73%
- Current HPI
- 234.5017
- Rent YoY
- —
- Metro
- North Port-Sarasota-Bradenton, FL
- State GDP YoY
- ▲ 3.28%
- F500 in state
- 36
Industry mix (Fortune 500 HQ in FL)
| Industry | F500 HQs | Revenue |
|---|---|---|
| Industrial Technology | 2 | $29B |
|
||
| Insurance | 2 | $17B |
|
||
| Retail | 1 | $60B |
|
||
| Technology Distribution | 1 | $58B |
|
||
| Homebuilding | 1 | $35B |
|
||
| Technology Manufacturing | 1 | $35B |
|
||
Price history
-65.4% since first listed24 events — show timeline
- 2026-05-04 Pending — Stellar MLS as Distributed by MLS Grid
- 2026-04-15 Listed $589,000 Stellar MLS as Distributed by MLS Grid
- 2025-04-30 Listing Removed — Stellar MLS as Distributed by MLS Grid
- 2025-03-20 Listed $649,000 Stellar MLS as Distributed by MLS Grid
- 2024-07-03 Pending — Stellar MLS as Distributed by MLS Grid
- 2024-07-02 Listing Removed — Stellar MLS as Distributed by MLS Grid
- 2024-05-23 Price Changed $720,000 Stellar MLS as Distributed by MLS Grid
- 2024-04-25 Listed $760,000 Stellar MLS as Distributed by MLS Grid
- 2022-04-29 Sold (Public Records) $600,000 Public Records
- 2022-04-29 Sold (MLS) $600,000 Stellar MLS as Distributed by MLS Grid
- 2022-04-08 Pending — Stellar MLS as Distributed by MLS Grid
- 2022-04-03 Listed $595,000 Stellar MLS as Distributed by MLS Grid
- 2016-02-02 Sold (Public Records) $257,000 Public Records
- 2016-02-01 Sold (MLS) $257,000 Stellar MLS as Distributed by MLS Grid
- 2015-12-05 Pending — Stellar MLS as Distributed by MLS Grid
- 2015-03-28 Price Changed $265,000 Stellar MLS as Distributed by MLS Grid
- 2015-03-18 Listed $275,000 Stellar MLS as Distributed by MLS Grid
- 2008-10-22 Listed $319,000 Stellar MLS as Distributed by MLS Grid
- 2004-08-19 Sold (Public Records) $389,900 Public Records
- 2003-08-13 Sold (Public Records) $275,000 Public Records
- 2003-04-08 Sold (Public Records) $235,000 Public Records
- 1992-11-19 Sold (Public Records) $199,000 Public Records
- 1991-03-22 Sold (Public Records) $199,000 Public Records
- 1989-12-01 Sold (Public Records) $1,700,000 Public Records
Property tax history
+0.3%/yrLatest (2025): $3,518 · -59.5% YoY. Source: county tax records.
Cash-flow waterfall
monthlySold comps — $/sqft
last 12 mo · ≤1 miLoading sold comps…