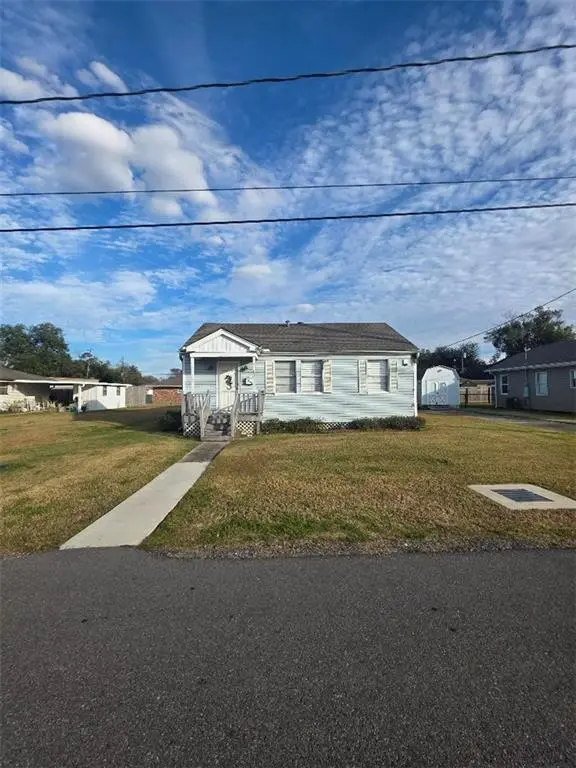
526 W B St · Norco, LA
Flood risk No data
- FEMA flood zone
- —
- Chance of flooding over 30 yrs
- —
- Est. flood insurance / yr
- —
Fire risk No data
- Est. fire insurance / yr
- —
Heat risk No data
- Hot days now (above threshold)
- —
- Hot days in 30 yrs
- —
Wind risk No data
- Chance of severe wind over 30 yrs
- —
Air-quality risk No data
- Unhealthy air days now
- —
- Unhealthy air days in 30 yrs
- —
Risk factors via First Street. Map © Google.
Why this score? — see what drove the B+ grade
The composite is a weighted blend of 9 inputs, each scored 0–100. Each bar is that input's sub-score; the figure is the points it added to the 100-point composite (weight × sub-score).
- Cash flow +27.4/30.0
- ARV discount +15.0/15.0
- DSCR +9.6/10.0
- 1% rule +7.2/10.0
- Appreciation +5.0/10.0
- Schools +4.0/10.0
- Livability +3.4/5.0
- Rent growth +2.5/5.0
- Condition / age +2.5/5.0
$120,000
🖨 Deal sheet 📄 Offer letter ✓ Due diligence
Listing remarks MLS
Single family home in need of significant repairs or bring your plans for a new build! Roof was replaced after Ida. Agent to be present for showings, hold harmless must be signed before entering property.
Key facts
- New build
- Roof replaced
- Parking
Tags
Neighborhood map
What this means for you Summary
Snapshot
- This is a 3-bed/2.0-bath single-family listed at $120k.
Deal economics
- At list price, monthly cash flow is $350 ($4k/yr) — positive.
- The deal already cash-flows at list — no discount required.
- Meets the 1% rule at list price ($1k rent vs $120k).
- Recommended offer: $109k (9.0% below list) — sets the bar for market timing.
Location & tenants
- Location reads 68/100 on livability (#83 in LA) — a middle-class / working-renter tenant base. Strengths: crime A+, cost of living A+, housing A+; Watch: amenities F, commute F, health & safety F.
- St. Charles Parish (suburban): math 40% / reading 51% proficiency, ranked #14 of 98 in LA (top 14%) — families likely to look elsewhere, expect single-tenant / working-renter base with shorter leases.
- Market conditions: 11 active listings in the ZIP; 2 comparable units currently listed for rent nearby; 74 units permitted in St. Charles Parish in 2024 (0 in 5+ unit buildings).
Forward outlook
- In year one you build about $799 of equity ($830 loan paydown + $-31 appreciation (-0.0% local appreciation)).
- St. Charles County population projected to shrink 7% by 2050 — rents likely to lag national; underwrite the cash flow, not the appreciation.
- At projected returns (-0.0% appreciation + 3.0% rent growth), your $34k cash investment doubles in ~6 years — after that, you're playing with house money.
Negotiation context
- It's been on market 111 days — a 9% lower offer ($109k) is reasonable based on typical stale-listing flexibility.
- 4 sale attempts since 32y ago; this cycle's ask has dropped $20k (14%) from the opening price — seller is motivated, your offer sets the floor, not the list.
- Current owner paid $60k; list at $120k implies a 100% gain — meaningful room to come down on a strong offer.
Questions for the listing agent
- It's been on market 111 days. Have you received any prior offers? Is the seller open to a 9% concession, seller financing, or rate buy-down credit?
- Why hasn't it sold? Are there any deal-killer items the seller is aware of (foundation, flood, title, zoning, code violations)?
- Is there a deadline driving the sale (1031 exchange, divorce, estate, relocation)? That informs how much negotiation room exists.
- Schools are A-rated — typically a magnet for longer-tenancy family renters. What's the average tenant stay here, and is there a school-zone premium baked into asking?
- What's the average days-on-market for RENTAL listings here right now (not sales)? A rising rental-DOM trend means longer vacancies and softer asking-rent achievability than the comps imply.
- What's the recent tenant-quality profile in this submarket — average credit score on applications, eviction rate, late-payment / NSF rate, and stable-employment percentage? A property-management company in the area should have these aggregated.
- How much new for-sale + rental construction is in the pipeline within 1–3 miles? Heavy new supply typically softens prices + rents 12–24 months out; constrained supply supports both.
Investment metrics
- 1% rule
- 1.22% ✓
- Cap rate
- 9.79%
- Cash-on-cash
- 12.49%
- DSCR
- 1.56
- GRM
- 6.8
CMA / ARV
- ARV (median comp)
- $238,383
- List price
- $120,000
- Delta
- -49.66%
- Verdict
- UNDERPRICED
- Comps
- 20 within 1.0 mi
Show comp detail 12 sales within ~0.75 mi
| Address | Dist | Beds/Ba | Sqft | Sold | Price | $/sf | Match |
|---|---|---|---|---|---|---|---|
| 525 Marino Dr | 0.03mi | 3/2.0 | 1,546 (-6%) | 2mo | $285,000 | $184 | 87 |
| 459 Oak St | 0.25mi | 3/2.0 | 1,650 (+0%) | 8mo | $225,000 | $136 | 81 |
| 430 Marino Dr | 0.20mi | 3/2.0 | 1,680 (+2%) | 11mo | $279,000 | $166 | 79 |
| 813 Clayton Dr | 0.35mi | 3/2.0 | 1,650 (+0%) | 6mo | $255,000 | $155 | 78 |
| 414 Spruce St | 0.33mi | 3/2.0 | 1,576 (-4%) | 1mo | $298,500 | $189 | 77 |
| 830 Marino Dr | 0.39mi | 3/2.0 | 1,650 (+0%) | 7mo | $256,500 | $155 | 76 |
| 316 Pine St | 0.33mi | 3/2.0 | 1,579 (-4%) | 2mo | $215,000 | $136 | 76 |
| 442 Goodhope St | 0.29mi | 3/2.0 | 1,702 (+3%) | 10mo | $275,000 | $162 | 72 |
| 501 Oak St | 0.23mi | 3/2.0 | 1,587 (-4%) | 14mo | $201,500 | $127 | 71 |
| 502 Giacomo St | 0.10mi | 2/2.0 (-1) | 1,530 (-7%) | 13mo | $198,000 | $129 | 68 |
| 558 Giacomo St | 0.10mi | 4/2.0 (+1) | 1,489 (-10%) | 9mo | $229,999 | $154 | 66 |
| 422 Saint Charles Street St | 0.29mi | 3/2.0 | 1,455 (-12%) | 9mo | $235,000 | $162 | 60 |
Match score weights: distance 35% · size 25% · config 20% · recency 20%. Top-matched comps best support the ARV.
Projected returns pro-forma
-0.03% appreciation · 3.0% rent growth · sell at horizon
- IRR
- 11.6%
- Equity multiple
- 1.55×
- Total profit
- $18,632
- Equity at exit
- $34,688
- IRR
- 16.4%
- Equity multiple
- 2.80×
- Total profit
- $60,528
- Equity at exit
- $41,573
Cash invested: $33,600 (down + closing). Projections, not guarantees.
Landlord ↔ Tenant lean methodology
- Overall (STATE)
- 90 Strongly Landlord-Friendly
- State Louisiana
- 90 Strongly Landlord-Friendly · R+12
- County
- — inherits STATE
- City
- — inherits STATE
ZIP-level market 70079
- Home prices YoY
- -0.0%
- Active inventory
- 11
- Price-to-rent
- 6.8×
Monthly cashflow live
- Estimated rent
- $1,465 medium interval (Pro) →
- Mortgage (P&I)
- −$629
- Tax from tax record
- −$129 /mo · $1,543/yr
- Insurance
- −$50
- HOA
- −$0
- Vacancy / Maint / Mgmt
- −$308
- Net cashflow
- $350
Break-even live
UW: 25.0% down · 7.5% · 30yr · 1.5% tax · 5.0% vac · 8.0% maint · 8.0% mgmt
Financing live
Cash to close
- Down payment
- $30,000
- Closing costs
- $3,600
- Reserves months
- —
- Total cash needed
- —
Loan-product check · same deal, 3 products live
Conventional
25% down · 7.5% · 30yr
- Down + closing
- —
- Monthly P&I
- —
- Monthly cashflow
- —
- DSCR
- —
- Eligible?
- —
Personal DTI + credit; lowest rate.
DSCR
20% down · 8.5% · 30yr
- Down + closing
- —
- Monthly P&I
- —
- Monthly cashflow
- —
- DSCR
- —
- Eligible?
- —
No personal income docs; deal must DSCR.
Hard money
10% down · 12.0% · 12mo
- Down + closing
- —
- Monthly P&I
- —
- Monthly cashflow
- —
- DSCR
- —
- Eligible?
- —
Short-term bridge; refi at stabilization.
Rent comps 2 comps
| Address | Beds | Baths | Sqft | Rent | $/sqft | DOM | Units | Dist |
|---|---|---|---|---|---|---|---|---|
| 714 Saint Charles St Norco, LA | 3.0 | 2.0 | 1280 | $1,350 | $1.05 | 14d | 1 | 0.30mi |
| 24 Mary St Norco, LA | 3.0 | 1.0 | 1350 | $1,750 | $1.30 | 43d | 1 | 0.78mi |
Listing history 22 events
-
2026-06-18days on market $120,000 Active 111 DOM
-
2026-06-17days on market $120,000 Active 110 DOM
-
2026-06-16days on market $120,000 Active 109 DOM
-
2026-06-15days on market $120,000 Active 108 DOM
-
2026-06-13days on market $120,000 Active 106 DOM
-
2026-06-13days on market $120,000 Active 105 DOM
-
2026-06-10days on market $120,000 Active 103 DOM
-
2026-06-09days on market $120,000 Active 102 DOM
-
2026-06-08days on market $120,000 Active 101 DOM
-
2026-06-07days on market $120,000 Active 100 DOM
-
2026-06-05days on market $120,000 Active 97 DOM
-
2026-06-03days on market $120,000 Active 96 DOM
-
2026-06-02days on market $120,000 Active 95 DOM
-
2026-06-01days on market $120,000 Active 94 DOM
-
2026-05-31days on market $120,000 Active 93 DOM
-
2026-05-18price $120,000 204-char remark
Show marketing remark (204 chars)
Single family home in need of significant repairs or bring your plans for a new build! Roof was replaced after Ida. Agent to be present for showings, hold harmless must be signed before entering property.
-
2026-05-18price $120,000 204-char remark
Show marketing remark (204 chars)
Single family home in need of significant repairs or bring your plans for a new build! Roof was replaced after Ida. Agent to be present for showings, hold harmless must be signed before entering property.
-
2026-02-27$140,000 Active 204-char remark
Show marketing remark (204 chars)
Single family home in need of significant repairs or bring your plans for a new build! Roof was replaced after Ida. Agent to be present for showings, hold harmless must be signed before entering property.
-
2026-02-27$140,000 Active 204-char remark
Show marketing remark (204 chars)
Single family home in need of significant repairs or bring your plans for a new build! Roof was replaced after Ida. Agent to be present for showings, hold harmless must be signed before entering property.
-
1994-05-26soldstatus $60,000
-
1994-04-24$62,900
-
1994-04-24$62,900
ⓘ Source: listings_history table (triggers on properties + properties_extension) + one-shot
backfill from property_details.listing_events for pre-trigger history.
Tax reassessment forecast LA · Resets to sale price
- Current annual tax
- $1,543 · $129/mo
- Projected year-2 tax
- $1,543 · $129/mo
- Expected delta
- $0/yr ($0/mo · 0.0%)
ⓘ Screening estimate from a state-policy table — verify with the county assessor before closing.
Nearby sold comps map
Loading sold comps map…
Walkable amenities ~0.75 mi
Loading nearby amenities…
Taxation est. · year 1
- Rental income
- $17,586
- − Mortgage interest
- −$6,722
- − Property taxes
- −$1,543
- − Insurance
- −$600
- − Repairs & maintenance
- −$1,407
- − Management
- −$1,407
- − Depreciation
- −$3,491
- Taxable income
- $2,416
- Est. tax owed @ 24.0%
- −$580
- After-tax cash flow
- $3,618/yr
For passive investors: Depreciation is non-cash, so a rental often shows a tax loss while cash-flowing — sheltering income. Rental losses are passive: they offset passive income freely, and up to $25,000/yr can offset ordinary (W-2) income if you actively participate and your MAGI is under $100k (phasing out to $0 by $150k); unused losses carry forward. On sale, claimed depreciation is recaptured at up to 25%, and gains may owe capital-gains tax (a 1031 exchange can defer both). Figures are a year-1 estimate at your 24.0% rate — not tax advice; consult a CPA.
Schools (NCES district)
- District
- St. Charles Parish
- NCES district ID
- 2201440
- Math proficiency
- 40% ▼ -38.00%
- Reading proficiency
- 51% ▼ -32.00%
- Median HH income
- $60,261
- Composite
- 40.0/100
- National rank
- #3830
- State rank
- #14 of 98 in LA
Livability — Norco
- Score
- 68/100
- State rank
- #83
- US rank
- #9293
Category grades
Schools grade is shown separately in the Schools card above.
Census & demographics
- Census place
- Norco, LA
- City population
- 2,822
- Population (ZIP)
- 2,822
Population outlook (St. Charles County) Hauer SSP2
- Today (2025)
- 53,296 people
- By 2030
- 53,030 · -0.5%
- By 2040
- 51,646 · -3.1%
- By 2050
- 49,771 · -6.6%
- By 2075
- 46,993 · -11.8%
- By 2100
- 44,473 · -16.6%
Race, ethnicity, and origin ACS 2023
- Neighborhood character
- Predominantly White (86%)
- Race & ethnicity
- White 86% Black 3% Hispanic / Latino 1%
- Common ancestry
- Lithuanian 26% Slovak 2% Italian 1%
- Foreign-born
- 1% · Canada
- Languages at home
- 96% English-only · Spanish 2% French/Haitian/Cajun 1% Arabic 1%
Political lean MEDSL · St. Charles
- 2024 margin
- Solid R (+32.4) · D 33.0% · R 65.4% · Other 1.6%
- 2008→2024 swing
- -1.1pp toward R · 2008: -31.2pp · 2024: -32.4pp
- All cycles
- 2024: R+32.4 2020: R+29.6 2016: R+30.8 2012: R+27.8 2008: R+31.2
Not yet ingested
- Civics
- —
Market trends
- HPI YoY
- ▬ -0.03%
- Current HPI
- 252.5871
- Rent YoY
- —
- Metro
- —
- State GDP YoY
- ▲ 3.29%
- F500 in state
- 10
Industry mix (Fortune 500 HQ in LA)
| Industry | F500 HQs | Revenue |
|---|---|---|
| Telecommunications | 2 | $23B |
|
||
| Utilities | 1 | $12B |
|
||
| Wholesale / Distribution | 1 | $5B |
|
||
| Advertising | 1 | $2B |
|
||
Price history
+90.8% since first listed7 events — show timeline
- 2026-05-18 Price Changed $120,000 AcadianaMLS
- 2026-05-18 Price Changed $120,000 GSREIN
- 2026-02-27 Listed $140,000 GSREIN
- 2026-02-27 Listed $140,000 AcadianaMLS
- 1994-05-26 Sold (MLS) $60,000 GSREIN
- 1994-04-24 Listed $62,900 AcadianaMLS
- 1994-04-24 Listed $62,900 GSREIN
Property tax history
+3.8%/yrLatest (2024): $1,543 · +17.4% YoY. Source: county tax records.
Cash-flow waterfall
monthlySold comps — $/sqft
last 12 mo · ≤1 miLoading sold comps…