 7-Plex
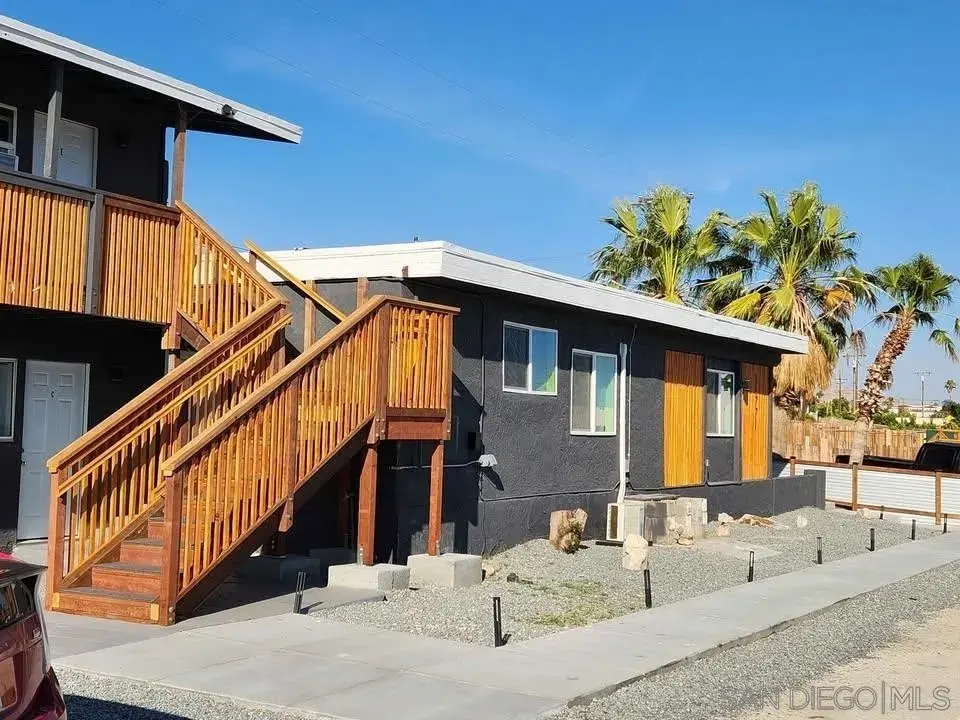
11771 Upland Way · Desert Hot Springs, CA
Flood risk 1/10 · Minimal
- FEMA flood zone
- X (shaded)
- Chance of flooding over 30 yrs
- 0.0%
- Est. flood insurance / yr
- $507 – $1,088
Fire risk 6/10 · Moderate
- Est. fire insurance / yr
- $659 – $1,223
Heat risk 8/10 · Major
- Hot days now (above 109°F)
- 7 days/yr
- Hot days in 30 yrs
- 20 days/yr
Wind risk 1/10 · Minimal
- Chance of severe wind over 30 yrs
- —
Air-quality risk 5/10 · Moderate
- Unhealthy air days now
- 7 days/yr
- Unhealthy air days in 30 yrs
- 10 days/yr
Risk factors via First Street. Map © Google.
Why this score? — see what drove the B- grade
The composite is a weighted blend of 9 inputs, each scored 0–100. Each bar is that input's sub-score; the figure is the points it added to the 100-point composite (weight × sub-score).
- Cash flow +30.0/30.0
- DSCR +10.0/10.0
- 1% rule +8.4/10.0
- ARV discount +7.5/15.0
- Rent growth +3.4/5.0
- Schools +2.7/10.0
- Livability +2.5/5.0
- Condition / age +2.5/5.0
- Appreciation +0.0/10.0
$890,000
🖨 Deal sheet 📄 Offer letter ✓ Due diligence
Multi-family units
County records classify this as Multi-Family (5+ Unit). Listing-text estimate: 7 units. confirmed
5+ unit building — per-unit beds/baths from public records are typically unavailable; the breakdown below (if shown) is an estimate from the listing text.
Listing remarks MLS
Immediate 9.4% Cap Rate on a stabilized, high-cash-flow asset in the Desert Hot Springs opportunity zone. Extensively remodeled in 2024, this 7-unit multi-family property offers a rare combination of modern aesthetics and mechanical efficiency. The property features 7 individual electric meters, a critical operational advantage in the desert that shifts the highest utility burden—air conditioning—directly to the tenants. The 2024 renovation included updated systems, new finishes, and a private gated perimeter, ensuring zero deferred maintenance for the incoming investor. Priced at $915,000 for a rapid sale, this asset provides over $400,000 in immediate equity compared to market-average cap rates. Investment Highlights: Superior Yield: Stabilized 9.46% Cap Rate with a 19-21% expense ratio. Major 2024 Renovation: Turnkey asset with new systems and finishes. Operational Efficiency: 7 individual electric meters significantly reduce owner-paid utilities. Gated Perimeter: Enhances security and curb appeal for high-quality tenant retention. Marketing Flyer Framework The Property: 11771 Upland Way Price: $915,000 Units: 7 Status: Fully Remodeled 2024 Net Income: $86,601 Why Invest Here? Most investors in the Coachella Valley struggle with high utility costs and aging infrastructure. This property solves both. With a 2024 remodel and individual metering, your overhead is locked in while your income is protected by the high demand for modern rentals in the 92240 zip code.
Key facts
- Modern aesthetics
- 2024 renovation
- 9.4% cap rate
Tags
Neighborhood map
What this means for you Summary
Snapshot
- This is a 1×4bd/1ba + 2×1bd/1ba + 4×2bd/1ba units multifamily listed at $890k.
Deal economics
- At list price, monthly cash flow is $3k ($40k/yr) — positive. Per door: $481/mo.
- The deal already cash-flows at list — no discount required.
- Meets the 1% rule at list price ($12k rent vs $890k).
- Recommended offer: $863k (3.0% below list) — sets the bar for market timing.
- Cap rate 10.8% vs local median 4.0% in Desert Hot Springs — top-decile yield for the area; either an underpriced asset or a hidden risk that comps aren't pricing in. Stress-test before assuming the spread holds.
Location & tenants
- Location reads 49/100 on livability (#1,149 in CA) — a working-class tenant base; expect higher turnover. Strengths: housing B+; Watch: crime D+, schools F, amenities F.
- Palm Springs Unified (suburban): math 21% / reading 42% proficiency, ranked #328 of 517 in CA (top 63%) — families likely to look elsewhere, expect single-tenant / working-renter base with shorter leases; 73% free/reduced lunch — lower-income household profile, screen leases tightly.
- Market conditions: Rents rising (+3.7%/yr); 515 active listings in the ZIP; 3 comparable units currently listed for rent nearby; rentals lingering (median 44d on market — plan ~5-8 weeks vacancy on turnover, expect pricing pressure); 67% of comp listings sitting > 30 days — soft ceiling on asking rent; 9,195 units permitted in Riverside County in 2024 (1,512 in 5+ unit buildings).
- At $11,947/mo this rent would consume 265% of the median local household income ($54k/yr) (locally 2095% of renters already pay >50% of income on rent) — very limited rent-growth headroom before tenants either downsize or default.
Forward outlook
- Local home prices are declining (-3.0%/yr); year-one equity from $6k of loan paydown is wiped out by about $27k of value loss. Plan a longer hold.
- Riverside County population projected at +22% by 2050 — long-run rental-demand tailwind backs the buy-and-hold thesis.
- At projected returns (-3.0% appreciation + 3.7% rent growth), your $249k cash investment doubles in ~7 years — after that, you're playing with house money.
Negotiation context
- It's been on market 41 days — a 3% lower offer ($863k) is reasonable based on typical stale-listing flexibility.
- 2 sale attempts with the ask held roughly flat each time — persistent listings suggest the price (not the market) is what's stuck; bring a comps-based counter.
- Current owner paid $26k; list at $890k implies a 3323% gain — meaningful room to come down on a strong offer.
Risks & watch-outs
- Climate carrying-cost: major wildfire risk; extreme-heat days projected 7→20/yr by 2055 (HVAC capex compounding) — expect insurance premiums to compound above CPI over the hold.
Questions for the listing agent
- It's been on market 41 days. Have you received any prior offers? Is the seller open to a 3% concession, seller financing, or rate buy-down credit?
- Can we see the unit-by-unit rent roll, current vacancy, and any below-market leases? What's the average tenancy length?
- What capital expenditures (roof, boiler, parking lot, exteriors) have been made in the last 5 years, and what's planned in the next 2?
- Is there a deadline driving the sale (1031 exchange, divorce, estate, relocation)? That informs how much negotiation room exists.
- Schools are F-rated, which usually means shorter tenancies and higher turnover. Who's the typical renter profile here, and what's been the actual vacancy rate?
- Crime grade is D in this area — have there been break-ins, vandalism, or insurance claims at this property in the last 3 years? What carrier currently insures it and at what premium?
- What's the average days-on-market for RENTAL listings here right now (not sales)? A rising rental-DOM trend means longer vacancies and softer asking-rent achievability than the comps imply.
- What's the recent tenant-quality profile in this submarket — average credit score on applications, eviction rate, late-payment / NSF rate, and stable-employment percentage? A property-management company in the area should have these aggregated.
- How much new apartment / multifamily construction is in the pipeline within 1–3 miles? Heavy new supply (>2% of stock underway) typically softens rents 12–24 months out; light construction supports rent growth.
Investment metrics
- 1% rule
- 1.34% ✓
- Cap rate
- 10.83%
- Cash-on-cash
- 16.20%
- DSCR
- 1.72
- GRM
- 6.2
CMA / ARV
- ARV (median comp)
- $506,044
- List price
- $890,000
- Delta
- 75.87%
- Verdict
- OVERPRICED
- Comps
- 20 within 1.0 mi
Show comp detail 1 sale within ~0.75 mi
| Address | Dist | Beds/Ba | Sqft | Sold | Price | $/sf | Match |
|---|---|---|---|---|---|---|---|
| 66780 Crescent Dr | 0.22mi | 6/4.0 | 2,835 (-11%) | 4mo | $660,000 | $233 | 67 |
Match score weights: distance 35% · size 25% · config 20% · recency 20%. Top-matched comps best support the ARV.
Projected returns pro-forma
-3.0% appreciation · 3.66% rent growth · sell at horizon
- IRR
- 7.9%
- Equity multiple
- 1.31×
- Total profit
- $78,210
- Equity at exit
- $132,702
- IRR
- 17.8%
- Equity multiple
- 2.52×
- Total profit
- $377,812
- Equity at exit
- $76,951
Cash invested: $249,200 (down + closing). Projections, not guarantees.
Landlord ↔ Tenant lean methodology
- Overall (STATE)
- 18 Strongly Tenant-Friendly
- State California
- 18 Strongly Tenant-Friendly · D+13
- County
- — inherits STATE
- City
- — inherits STATE
ZIP-level market 92240
- Home prices YoY
- -19.6%
- Rents YoY
- 3.7%
- Active inventory
- 515
- Price-to-rent
- 33.3×
Monthly cashflow live
- Estimated rent
- $11,947 medium interval (Pro) →
- Mortgage (P&I)
- −$4,667
- Tax from tax record
- −$1,035 /mo · $12,422/yr
- Insurance
- −$371
- HOA
- −$0
- Vacancy / Maint / Mgmt
- −$2,509
- Net cashflow
- $3,365
Break-even live
7-unit breakdown (identical units grouped — click to expand)
| Units | Beds | Baths | Est. rent |
|---|---|---|---|
| 1× unit | 4 | 1 | $2,230 |
| 2× units | 1 | 1 | $2,806 |
| #2 | 1 | 1 | $1,403 |
| #7 | 1 | 1 | $1,403 |
| 4× units | 2 | 1 | $6,912 |
| #3 | 2 | 1 | $1,728 |
| #4 | 2 | 1 | $1,728 |
| #5 | 2 | 1 | $1,728 |
| #6 | 2 | 1 | $1,728 |
| Total (7 units) | $11,947 | ||
UW: 25.0% down · 7.5% · 30yr · 1.5% tax · 5.0% vac · 8.0% maint · 8.0% mgmt
Financing live
Cash to close
- Down payment
- $222,500
- Closing costs
- $26,700
- Reserves months
- —
- Total cash needed
- —
Loan-product check · same deal, 3 products live
Conventional
25% down · 7.5% · 30yr
- Down + closing
- —
- Monthly P&I
- —
- Monthly cashflow
- —
- DSCR
- —
- Eligible?
- —
Personal DTI + credit; lowest rate.
DSCR
20% down · 8.5% · 30yr
- Down + closing
- —
- Monthly P&I
- —
- Monthly cashflow
- —
- DSCR
- —
- Eligible?
- —
No personal income docs; deal must DSCR.
Hard money
10% down · 12.0% · 12mo
- Down + closing
- —
- Monthly P&I
- —
- Monthly cashflow
- —
- DSCR
- —
- Eligible?
- —
Short-term bridge; refi at stabilization.
Rent comps 3 comps
| Address | Beds | Baths | Sqft | Rent | $/sqft | DOM | Units | Dist |
|---|---|---|---|---|---|---|---|---|
| 66915 Vista Pl Desert Hot Springs, CA | 2.0 | 2.0 | 2430 | $2,100 | $0.86 | 43d | 1 | 0.13mi |
| 12635 El Nido Pl Unit 1 Desert Hot Springs, CA | 3.0 | 1.0 | 2471 | $2,275 | $0.92 | 24d | 1 | 0.84mi |
| 12635 El Nido Pl Desert Hot Springs, CA | 3.0 | 1.0 | 2471 | $2,275 | $0.92 | 43d | 1 | 0.84mi |
Listing history 22 events
-
2026-06-18days on market $890,000 Active 41 DOM
-
2026-06-17days on market $890,000 Active 40 DOM
-
2026-06-16days on market $890,000 Active 39 DOM
-
2026-06-15days on market $890,000 Active 38 DOM
-
2026-06-13days on market $890,000 Active 36 DOM
-
2026-06-13days on market $890,000 Active 35 DOM
-
2026-06-09days on market $890,000 Active 32 DOM
-
2026-06-08days on market $890,000 Active 31 DOM
-
2026-06-07days on market $890,000 Active 30 DOM
-
2026-06-04days on market $890,000 Active 27 DOM
-
2026-06-03days on market $890,000 Active 26 DOM
-
2026-06-02days on market $890,000 Active 25 DOM
-
2026-06-01days on market $890,000 Active 24 DOM
-
2026-05-31days on market $890,000 Active 23 DOM
-
2026-05-08$915,000 Active 1508-char remark
Show marketing remark (1508 chars)
Immediate 9.4% Cap Rate on a stabilized, high-cash-flow asset in the Desert Hot Springs opportunity zone. Extensively remodeled in 2024, this 7-unit multi-family property offers a rare combination of modern aesthetics and mechanical efficiency. The property features 7 individual electric meters, a critical operational advantage in the desert that shifts the highest utility burden—air conditioning—directly to the tenants. The 2024 renovation included updated systems, new finishes, and a private gated perimeter, ensuring zero deferred maintenance for the incoming investor. Priced at $915,000 for a rapid sale, this asset provides over $400,000 in immediate equity compared to market-average cap rates. Investment Highlights: Superior Yield: Stabilized 9.46% Cap Rate with a 19-21% expense ratio. Major 2024 Renovation: Turnkey asset with new systems and finishes. Operational Efficiency: 7 individual electric meters significantly reduce owner-paid utilities. Gated Perimeter: Enhances security and curb appeal for high-quality tenant retention. Marketing Flyer Framework The Property: 11771 Upland Way Price: $915,000 Units: 7 Status: Fully Remodeled 2024 Net Income: $86,601 Why Invest Here? Most investors in the Coachella Valley struggle with high utility costs and aging infrastructure. This property solves both. With a 2024 remodel and individual metering, your overhead is locked in while your income is protected by the high demand for modern rentals in the 92240 zip code.
-
2026-05-04historical
-
2026-04-21price $935,000
-
2026-02-02$950,000 Active
-
1999-12-30soldstatus $26,000
-
1997-02-24soldstatus $30,000
-
1991-06-11soldstatus $110,000
-
1988-11-10soldstatus $19,733
ⓘ Source: listings_history table (triggers on properties + properties_extension) + one-shot
backfill from property_details.listing_events for pre-trigger history.
Tax reassessment forecast CA · Resets to sale price
- Current annual tax
- $12,422 · $1,035/mo
- Projected year-2 tax
- $12,422 · $1,035/mo
- Expected delta
- $0/yr ($0/mo · 0.0%)
ⓘ Screening estimate from a state-policy table — verify with the county assessor before closing.
Climate risk First Street
- Flood 1/10 Low FEMA zone X (shaded) · 0% chance over 30 yrs
- Wildfire 6/10 Major
- Heat 8/10 Severe 7 d/yr ≥109°F today · 20 d/yr by 30 yrs out
- Wind 1/10 Low
- Air quality 5/10 Major 7 unhealthy d/yr today · 10 by 30 yrs out
Nearby sold comps map
Loading sold comps map…
Walkable amenities ~0.75 mi
Loading nearby amenities…
Taxation est. · year 1
- Rental income
- $143,364
- − Mortgage interest
- −$49,854
- − Property taxes
- −$12,422
- − Insurance
- −$4,450
- − Repairs & maintenance
- −$11,469
- − Management
- −$11,469
- − Depreciation
- −$25,891
- Taxable income
- $27,809
- Est. tax owed @ 24.0%
- −$6,674
- After-tax cash flow
- $33,704/yr
For passive investors: Depreciation is non-cash, so a rental often shows a tax loss while cash-flowing — sheltering income. Rental losses are passive: they offset passive income freely, and up to $25,000/yr can offset ordinary (W-2) income if you actively participate and your MAGI is under $100k (phasing out to $0 by $150k); unused losses carry forward. On sale, claimed depreciation is recaptured at up to 25%, and gains may owe capital-gains tax (a 1031 exchange can defer both). Figures are a year-1 estimate at your 24.0% rate — not tax advice; consult a CPA.
Schools (NCES district)
- District
- Palm Springs Unified
- NCES district ID
- 0629550
- Math proficiency
- 21% ▼ -7.00%
- Reading proficiency
- 42% ▬ 0.00%
- Median HH income
- $43,638
- Composite
- 26.76/100
- National rank
- #7131
- State rank
- #328 of 517 in CA
Livability — Desert Hot Springs
- Score
- 49/100
- State rank
- #1149
- US rank
- #25774
Category grades
Schools grade is shown separately in the Schools card above.
Census & demographics
- Census place
- Desert Hot Springs, CA
- County
- Riverside County · 2,287,001 people
- City population
- 41,615
- Metro
- Riverside-San Bernardino-Ontario, CA
- Population (ZIP)
- 41,615
- Household income
- $54,023
- Rent vs Own
- Severe rent burden
- 2095.0
Population outlook (Riverside County) Hauer SSP2
- Today (2025)
- 2,664,475 people
- By 2030
- 2,802,692 · +5.2%
- By 2040
- 3,050,904 · +14.5%
- By 2050
- 3,256,783 · +22.2%
- By 2075
- 3,655,058 · +37.2%
- By 2100
- 3,766,594 · +41.4%
Race, ethnicity, and origin ACS 2023
- Neighborhood character
- Majority Hispanic (64%)
- Race & ethnicity
- Hispanic / Latino 64% Two or more races 27% White 23% Black 7% Native American 2% Asian 2%
- Hispanic origin (detail)
- Mexican 53%
- Common ancestry
- Lithuanian 1% Romanian 1% Italian 1%
- Foreign-born
- 27% · Canada, Vietnam
- Languages at home
- 47% English-only · Spanish 50% Russian/Polish/Slavic 1%
Political lean MEDSL · Riverside
- 2024 margin
- Toss-up / Even · D 48.0% · R 49.3% · Other 2.6%
- 2008→2024 swing
- -3.6pp toward R · 2008: 2.3pp · 2024: -1.3pp
- All cycles
- 2024: R+1.3 2020: D+8.0 2016: D+4.3 2012: R+0.4 2008: D+2.3
Not yet ingested
- Civics
- —
Market trends
- HPI YoY
- ▼ -102.10%
- Current HPI
- 418.4691
- Rent YoY
- ▲ 3.66%
- Metro
- Riverside-San Bernardino-Ontario, CA
- State GDP YoY
- ▲ 3.21%
- F500 in state
- 116
Industry mix (Fortune 500 HQ in CA)
| Industry | F500 HQs | Revenue |
|---|---|---|
| Technology | 27 | $1,492B |
|
||
| Financial Services | 3 | $174B |
|
||
| Retail | 3 | $44B |
|
||
| Insurance | 3 | $26B |
|
||
| Media / Entertainment | 2 | $115B |
|
||
| Pharmaceuticals / Biotech | 2 | $62B |
|
||
Price history
+4536.9% since first listed8 events — show timeline
- 2026-05-08 Listed $915,000 SDMLS
- 2026-05-04 Listing Removed — GPSMLS
- 2026-04-21 Price Changed $935,000 GPSMLS
- 2026-02-02 Listed $950,000 GPSMLS
- 1999-12-30 Sold (Public Records) $26,000 Public Records
- 1997-02-24 Sold (Public Records) $30,000 Public Records
- 1991-06-11 Sold (Public Records) $110,000 Public Records
- 1988-11-10 Sold (Public Records) $19,733 Public Records
Property tax history
+19.2%/yrLatest (2025): $12,422 · -4.5% YoY. Source: county tax records.
Cash-flow waterfall
monthlySold comps — $/sqft
last 12 mo · ≤1 miLoading sold comps…