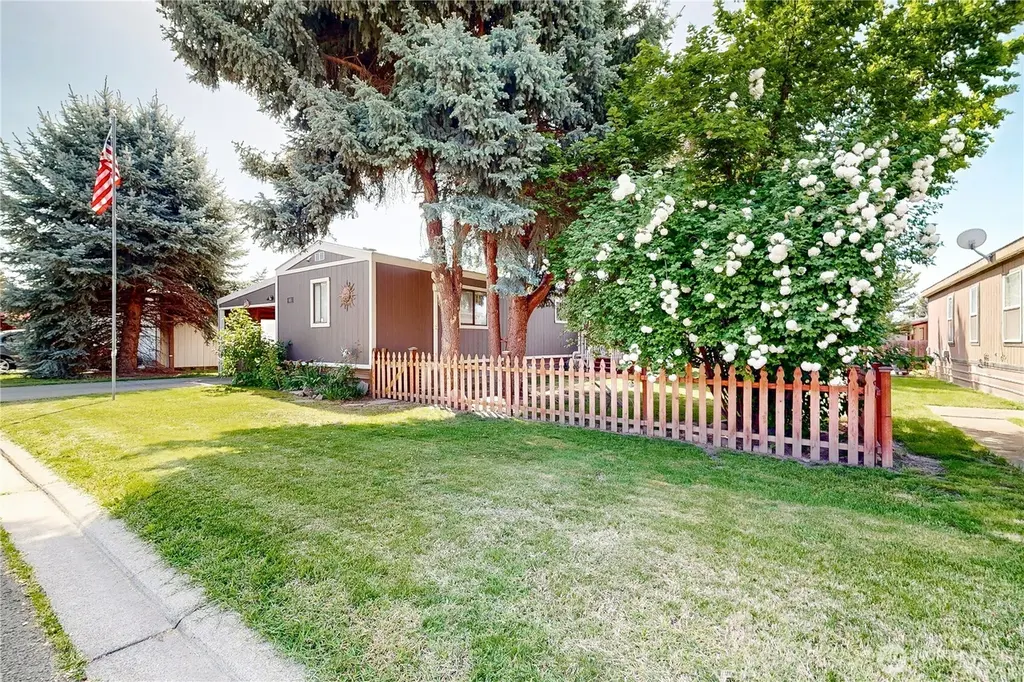
968 NE Empire St · College Place, WA
Flood risk 1/10 · Minimal
- FEMA flood zone
- —
- Chance of flooding over 30 yrs
- 0.0%
- Est. flood insurance / yr
- —
Fire risk 3/10 · Minor
- Est. fire insurance / yr
- $604 – $1,122
Heat risk 4/10 · Minor
- Hot days now (above 98°F)
- 7 days/yr
- Hot days in 30 yrs
- 15 days/yr
Wind risk 1/10 · Minimal
- Chance of severe wind over 30 yrs
- —
Air-quality risk 8/10 · Major
- Unhealthy air days now
- 11 days/yr
- Unhealthy air days in 30 yrs
- 14 days/yr
Risk factors via First Street. Map © Google.
Why this score? — see what drove the B+ grade
The composite is a weighted blend of 9 inputs, each scored 0–100. Each bar is that input's sub-score; the figure is the points it added to the 100-point composite (weight × sub-score).
- Cash flow +30.0/30.0
- ARV discount +15.0/15.0
- 1% rule +10.0/10.0
- DSCR +10.0/10.0
- Schools +4.1/10.0
- Livability +4.1/5.0
- Rent growth +2.5/5.0
- Condition / age +2.5/5.0
- Appreciation +0.0/10.0
$80,000
🖨 Deal sheet 📄 Offer letter ✓ Due diligence
Listing remarks
This well-maintained 3-bedroom, 2-bathroom mobile home is located in Sunset Villa. Recent updates include mini split systems for heating and cooling, hard flooring throughout with carpeting in one bedroom, an updated hall bathroom, a bright and open kitchen, and built-in shelving throughout the residence. Exterior features consist of a covered deck, a fully fenced yard with mature trees, a storage shed, new roof in 2019 and a covered carport area. The current lot rent is $225, and all prospective buyers are required to apply through the park office.
Key facts
- Covered deck
- Hard flooring
- Bright open kitchen
Tags
Property features AI
Finance
- Other: Calculated building area 924; Structure type: Manufactured house; Park approved for sale
- Financial info: Listing terms: Cash or Conventional
- HOA & community: Land lease: $225
Exterior
- Parking: Carport
- Utilities: Electric energy source; Public water
- Home design: Manufactured home (single wide); Manufactured after 06/15/1976; One level; Faces north; Located in Sunset Villa park; Senior community
- Construction: Wood construction; Composition roof; Mobile home remains
- Exterior features: Wood products siding; Paved lot
Interior
- Kitchen: Dishwasher; Refrigerator; Stove/Range
- Bedrooms: 3 bedrooms
- Flooring: Laminate; Vinyl; Carpet
- Bathrooms: 2 full bathrooms
- Heating & cooling: Ductless heating; Has cooling
- Interior features: Kitchen without eating space; Living room; Utility room; Bath off primary; Patio/porch/deck
- Laundry & utility: Washer; Dryer; Utility room
Neighborhood map
What this means for you Summary
Snapshot
- This is a 3-bed/2.0-bath manufactured listed at $80k.
Deal economics
- At list price, monthly cash flow is $806 ($10k/yr) — positive.
- The deal already cash-flows at list — no discount required.
- Meets the 1% rule at list price ($2k rent vs $80k).
- Recommended offer: $78k (3.0% below list) — sets the bar for market timing.
- Cap rate 18.4% vs local median 2.5% in College Place — top-decile yield for the area; either an underpriced asset or a hidden risk that comps aren't pricing in. Stress-test before assuming the spread holds.
Location & tenants
- Location reads 82/100 on livability (#71 in WA, #1,277 nationally) — a professional / high-income tenant draw. Strengths: commute A+, housing A+, health & safety A+; Watch: employment D, amenities D-.
- Walla Walla Public Schools (urban): math 41% / reading 50% proficiency, ranked #179 of 291 in WA (top 62%) — families likely to look elsewhere, expect single-tenant / working-renter base with shorter leases.
- Market conditions: 103 active listings in the ZIP; 8 comparable units currently listed for rent nearby; rentals lingering (median 44d on market — plan ~5-8 weeks vacancy on turnover, expect pricing pressure); 100% of comp listings sitting > 30 days — soft ceiling on asking rent; 206 units permitted in Walla Walla County in 2024 (50 in 5+ unit buildings).
- This rent runs 31% of the median local income ($63k/yr) — at the standard rent-burdened threshold; future hikes will face affordability resistance.
Forward outlook
- Local home prices are declining (-3.0%/yr); year-one equity from $553 of loan paydown is wiped out by about $2k of value loss. Plan a longer hold.
- Walla Walla County population projected at +8% by 2050 — modest demand growth; plan on rents tracking national, not racing it.
- At projected returns (-3.0% appreciation + 3.0% rent growth), your $22k cash investment doubles in ~3 years — after that, you're playing with house money.
Negotiation context
- It's been on market 35 days — a 3% lower offer ($78k) is reasonable based on typical stale-listing flexibility.
- 3 sale attempts since 12y ago with the ask held roughly flat each time — persistent listings suggest the price (not the market) is what's stuck; bring a comps-based counter.
- Current owner paid $22k; list at $80k implies a 264% gain — meaningful room to come down on a strong offer.
Questions for the listing agent
- It's been on market 35 days. Have you received any prior offers? Is the seller open to a 3% concession, seller financing, or rate buy-down credit?
- Is there a deadline driving the sale (1031 exchange, divorce, estate, relocation)? That informs how much negotiation room exists.
- What's the average days-on-market for RENTAL listings here right now (not sales)? A rising rental-DOM trend means longer vacancies and softer asking-rent achievability than the comps imply.
- What's the recent tenant-quality profile in this submarket — average credit score on applications, eviction rate, late-payment / NSF rate, and stable-employment percentage? A property-management company in the area should have these aggregated.
- How much new for-sale + rental construction is in the pipeline within 1–3 miles? Heavy new supply typically softens prices + rents 12–24 months out; constrained supply supports both.
Investment metrics
- 1% rule
- 2.04% ✓
- Cap rate
- 18.39%
- Cash-on-cash
- 43.20%
- DSCR
- 2.92
- GRM
- 4.1
CMA / ARV
- ARV (median comp)
- $126,000
- List price
- $80,000
- Delta
- -36.51%
- Verdict
- UNDERPRICED
- Comps
- 3 within 1.0 mi
Show comp detail 1 sale within ~0.75 mi
| Address | Dist | Beds/Ba | Sqft | Sold | Price | $/sf | Match |
|---|---|---|---|---|---|---|---|
| 345 NE Della Ave | 0.40mi | 2/1.0 (-1) | 938 (+2%) | 4mo | $275,000 | $293 | 67 |
Match score weights: distance 35% · size 25% · config 20% · recency 20%. Top-matched comps best support the ARV.
Projected returns pro-forma
-3.0% appreciation · 3.0% rent growth · sell at horizon
- IRR
- 40.0%
- Equity multiple
- 2.71×
- Total profit
- $38,381
- Equity at exit
- $11,928
- IRR
- 46.3%
- Equity multiple
- 5.44×
- Total profit
- $99,481
- Equity at exit
- $6,917
Cash invested: $22,400 (down + closing). Projections, not guarantees.
Landlord ↔ Tenant lean methodology
- Overall (STATE)
- 28 Tenant-Leaning
- State Washington
- 28 Tenant-Leaning · D+8
- County
- — inherits STATE
- City
- — inherits STATE
ZIP-level market 99324
- Home prices YoY
- -17.6%
- Active inventory
- 103
- Price-to-rent
- 4.1×
Monthly cashflow live
- Estimated rent
- $1,630 high interval (Pro) →
- Mortgage (P&I)
- −$420
- Tax from tax record
- −$28 /mo · $337/yr
- Insurance
- −$33
- HOA
- −$0
- Vacancy / Maint / Mgmt
- −$342
- Net cashflow
- $806
Break-even live
UW: 25.0% down · 7.5% · 30yr · 1.5% tax · 5.0% vac · 8.0% maint · 8.0% mgmt
Financing live
Cash to close
- Down payment
- $20,000
- Closing costs
- $2,400
- Reserves months
- —
- Total cash needed
- —
Loan-product check · same deal, 3 products live
Conventional
25% down · 7.5% · 30yr
- Down + closing
- —
- Monthly P&I
- —
- Monthly cashflow
- —
- DSCR
- —
- Eligible?
- —
Personal DTI + credit; lowest rate.
DSCR
20% down · 8.5% · 30yr
- Down + closing
- —
- Monthly P&I
- —
- Monthly cashflow
- —
- DSCR
- —
- Eligible?
- —
No personal income docs; deal must DSCR.
Hard money
10% down · 12.0% · 12mo
- Down + closing
- —
- Monthly P&I
- —
- Monthly cashflow
- —
- DSCR
- —
- Eligible?
- —
Short-term bridge; refi at stabilization.
Rent comps 8 comps
| Address | Beds | Baths | Sqft | Rent | $/sqft | DOM | Units | Dist |
|---|---|---|---|---|---|---|---|---|
| 101 Kenwood St #205 Walla Walla, WA | 2.0 | 1.0 | 845 | $1,325 | $1.57 | 43d | 1 | 0.20mi |
| 942 NE Spitzenburg St Apt B104 College Place, WA | 2.0 | 1.5 | 975 | $1,530 | $1.57 | 43d | 1 | 0.44mi |
| 255 Elder Pl #3 College Place, WA | 2.0 | 1.0 | 889 | $1,415 | $1.59 | 43d | 1 | 0.67mi |
| 220 N College Ave College Place, WA | 2.0 | 1.0 | 850 | $1,150 | $1.35 | 43d | 1 | 0.87mi |
| 211 SE 3rd St Unit Irisview 327-101 College Place, WA | 2.0 | 1.0 | 800 | $1,295 | $1.62 | 43d | 1 | 1.05mi |
| 108 SE 6th St Apt 11 College Place, WA | 2.0 | 1.0 | 720 | $1,195 | $1.66 | 43d | 1 | 1.30mi |
| 623 W Whitman Dr Unit 623 Whitman College Place, WA | 2.0 | 1.5 | 900 | $1,575 | $1.75 | 43d | 1 | 1.37mi |
| 806 S College Ave College Place, WA | 1.0–2.0 | 1.0–2.0 | 738 | $1,750 | $2.37 | 43d | 3 | 1.45mi |
Listing history 22 events
-
2026-06-19days on market $80,000 Active 35 DOM
-
2026-06-18days on market $80,000 Active 34 DOM
-
2026-06-17days on market $80,000 Active 33 DOM
-
2026-06-16days on market $80,000 Active 32 DOM
-
2026-06-15days on market $80,000 Active 31 DOM
-
2026-06-14days on market $80,000 Active 29 DOM
-
2026-06-12days on market $80,000 Active 28 DOM
-
2026-06-09days on market $80,000 Active 25 DOM
-
2026-06-08days on market $80,000 Active 24 DOM
-
2026-06-07days on market $80,000 Active 23 DOM
-
2026-06-02days on market $80,000 Active 18 DOM
-
2026-06-01days on market $80,000 Active 17 DOM
-
2026-05-31days on market $80,000 Active 16 DOM
-
2026-05-30days on market $80,000 Active 15 DOM
-
2026-05-15$80,000 Active
-
2018-08-24soldstatus $22,000
-
2018-07-17$29,900
-
2014-11-17soldstatus $21,500
-
2014-05-15$21,500
-
2011-02-08soldstatus $29,000
-
2010-09-28soldstatus $20,000
-
2007-08-14soldstatus $18,000
ⓘ Source: listings_history table (triggers on properties + properties_extension) + one-shot
backfill from property_details.listing_events for pre-trigger history.
Tax reassessment forecast WA · Resets to sale price
- Current annual tax
- $337 · $28/mo
- Projected year-2 tax
- $784 · $65/mo
- Expected delta
- +$447/yr (+$37/mo · 132.4%)
ⓘ Screening estimate from a state-policy table — verify with the county assessor before closing.
Climate risk First Street
- Flood 1/10 Low 0% chance over 30 yrs
- Wildfire 3/10 Moderate
- Heat 4/10 Moderate 7 d/yr ≥98°F today · 15 d/yr by 30 yrs out
- Wind 1/10 Low
- Air quality 8/10 Severe 11 unhealthy d/yr today · 14 by 30 yrs out
Nearby sold comps map
Loading sold comps map…
Walkable amenities ~0.75 mi
Loading nearby amenities…
Taxation est. · year 1
- Rental income
- $19,556
- − Mortgage interest
- −$4,481
- − Property taxes
- −$337
- − Insurance
- −$400
- − Repairs & maintenance
- −$1,564
- − Management
- −$1,564
- − Depreciation
- −$2,327
- Taxable income
- $8,881
- Est. tax owed @ 24.0%
- −$2,131
- After-tax cash flow
- $7,546/yr
For passive investors: Depreciation is non-cash, so a rental often shows a tax loss while cash-flowing — sheltering income. Rental losses are passive: they offset passive income freely, and up to $25,000/yr can offset ordinary (W-2) income if you actively participate and your MAGI is under $100k (phasing out to $0 by $150k); unused losses carry forward. On sale, claimed depreciation is recaptured at up to 25%, and gains may owe capital-gains tax (a 1031 exchange can defer both). Figures are a year-1 estimate at your 24.0% rate — not tax advice; consult a CPA.
Schools (NCES district)
- District
- Walla Walla Public Schools
- NCES district ID
- 5309450
- Math proficiency
- 41% ▲ 3.00%
- Reading proficiency
- 50% ▼ -1.00%
- Median HH income
- $46,207
- Composite
- 40.88/100
- National rank
- #7531
- State rank
- #179 of 291 in WA
Livability — College Place
- Score
- 82/100
- State rank
- #71
- US rank
- #1277
Category grades
Schools grade is shown separately in the Schools card above.
Census & demographics
- Census place
- College Place, WA
- County
- Walla Walla County · 52,990 people
- City population
- 10,137
- Metro
- Walla Walla, WA
- Population (ZIP)
- 10,137
- Household income
- $62,839
- Rent vs Own
- Severe rent burden
- 400.0
Population outlook (Walla Walla County) Hauer SSP2
- Today (2025)
- 63,088 people
- By 2030
- 64,417 · +2.1%
- By 2040
- 66,563 · +5.5%
- By 2050
- 68,337 · +8.3%
- By 2075
- 73,235 · +16.1%
- By 2100
- 74,878 · +18.7%
Race, ethnicity, and origin ACS 2023
- Neighborhood character
- Predominantly White (72%)
- Race & ethnicity
- White 72% Hispanic / Latino 20% Two or more races 8% Asian 3%
- Hispanic origin (detail)
- Mexican 16%
- Common ancestry
- Italian 6% Lithuanian 4% Portuguese 4%
- Foreign-born
- 9% · Canada, China
- Languages at home
- 84% English-only · Spanish 12% French/Haitian/Cajun 1% Other Asian/Pacific 1%
Political lean MEDSL · Walla Walla
- 2024 margin
- Lean R (+8.1) · D 44.6% · R 52.7% · Other 2.7%
- 2008→2024 swing
- +8.5pp toward D · 2008: -16.6pp · 2024: -8.1pp
- All cycles
- 2024: R+8.1 2020: R+8.7 2016: R+16.4 2012: R+22.3 2008: R+16.6
Not yet ingested
- Civics
- —
Market trends
- HPI YoY
- ▼ -69.73%
- Current HPI
- 326.0923
- Rent YoY
- —
- Metro
- Walla Walla, WA
- State GDP YoY
- ▲ 4.65%
- F500 in state
- 22
Industry mix (Fortune 500 HQ in WA)
| Industry | F500 HQs | Revenue |
|---|---|---|
| Retail | 2 | $269B |
|
||
| Technology / Retail | 1 | $638B |
|
||
| Technology | 1 | $245B |
|
||
| Telecommunications | 1 | $38B |
|
||
| Food / Beverage | 1 | $36B |
|
||
| Automotive / Trucks | 1 | $34B |
|
||
Price history
+344.4% since first listed8 events — show timeline
- 2026-05-15 Listed $80,000 NWMLS as Distributed by MLS Grid
- 2018-08-24 Sold (MLS) $22,000 NWMLS as Distributed by MLS Grid
- 2018-07-17 Listed $29,900 NWMLS as Distributed by MLS Grid
- 2014-11-17 Sold (MLS) $21,500 NWMLS as Distributed by MLS Grid
- 2014-05-15 Listed $21,500 NWMLS as Distributed by MLS Grid
- 2011-02-08 Sold (Public Records) $29,000 Public Records
- 2010-09-28 Sold (Public Records) $20,000 Public Records
- 2007-08-14 Sold (Public Records) $18,000 Public Records
Property tax history
+103.9%/yrLatest (2026): $337 · -1.0% YoY. Source: county tax records.
Cash-flow waterfall
monthlySold comps — $/sqft
last 12 mo · ≤1 miLoading sold comps…