1008 Stiles St · Baltimore, MD
Flood risk 1/10 · Minimal
- FEMA flood zone
- X (unshaded)
- Chance of flooding over 30 yrs
- 0.0%
- Est. flood insurance / yr
- $473 – $860
Fire risk 1/10 · Minimal
- Est. fire insurance / yr
- $755 – $1,403
Heat risk 8/10 · Major
- Hot days now (above 103°F)
- 7 days/yr
- Hot days in 30 yrs
- 15 days/yr
Wind risk 6/10 · Moderate
- Chance of severe wind over 30 yrs
- 27.0%
Air-quality risk 4/10 · Minor
- Unhealthy air days now
- 6 days/yr
- Unhealthy air days in 30 yrs
- 7 days/yr
Risk factors via First Street. Map © Google.
Why this score? — see what drove the C grade
The composite is a weighted blend of 9 inputs, each scored 0–100. Each bar is that input's sub-score; the figure is the points it added to the 100-point composite (weight × sub-score).
- Cash flow +21.6/30.0
- ARV discount +15.0/15.0
- DSCR +6.9/10.0
- 1% rule +6.4/10.0
- Livability +3.8/5.0
- Rent growth +2.6/5.0
- Condition / age +2.5/5.0
- Schools +1.0/10.0
- Appreciation +0.0/10.0
$199,999
🖨 Deal sheet (PDF) 📄 Offer letter ✓ Due diligence
Listing remarks
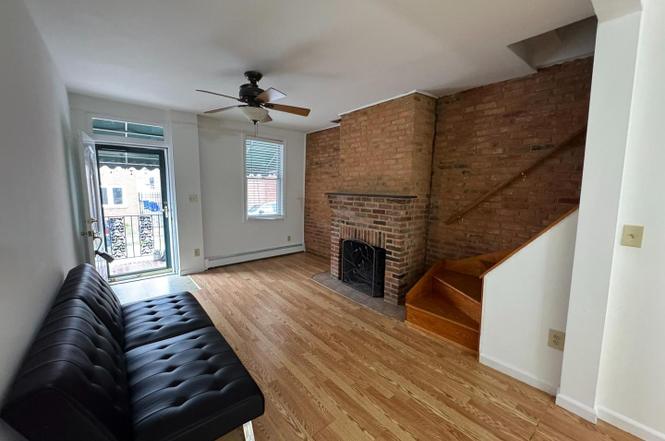
SELLER WELCOMES BACK UP OFFERS! THIS IS A GREAT OPPORTUNITY TO LIVE IN LITTLE ITALY AND INVEST IN YOUR FUTURE! This charming 3BR, 3BA townhouse offers the best of both worlds—affordable city living with income potential. Nestled in one of Baltimore’s most tight-knit and vibrant neighborhoods, this move-in ready home features newer carpet, a finished basement, and a private outdoor patio—perfect for relaxing or entertaining. Enjoy the unmatched walkability to Harbor East, the Inner Harbor, and Fells Point, with renowned dining, shopping, and entertainment just steps away. Embrace local traditions like evening bocce games and Friday night outdoor movies right in your communi
Key facts
- Finished basement
- Private entrance
- Built 1850
Tags
Property features AI
Finance
- Other: Not in a federal flood zone; Pets allowed with no restrictions; Total below-grade area: 384 finished/unfinished combined; Above-grade finished area reported (assessor)
Exterior
- Parking: On-street parking
- Utilities: Public water; Public sewer; Municipal trash collection; Natural gas hot water; Electric cooling
- Home design: Interior townhouse/rowhouse; Very good condition; Fee simple ownership; Year remodeled/effectively 2020
- Construction: Brick construction; Brick/mortar foundation; Asphalt roof; Double-hung, vinyl-clad windows; Building not winterized
- Exterior features: Patio(s); Daylight, partially below-grade basement with outside entrance; Fully finished basement (improved)
Interior
- Kitchen: Dishwasher; Disposal; Icemaker; Microwave; Gas range/oven; Range hood; Refrigerator
- Bedrooms: Two bedrooms on the first upper level; One bedroom on the second upper level; One bedroom on the first lower level
- Flooring: Carpet; Laminate plank
- Bathrooms: Two full bathrooms; One half bathroom; Full bathroom on first upper level; Full bathroom on first lower level; Half bath on main level
- Heating & cooling: Forced air heating; Natural gas heating fuel; Central air conditioning (electric)
- Interior features: Jetted bathtub; Ceiling fans; Combination dining and living area; Traditional floor plan; Galley kitchen; Upgraded countertops; Brick and drywall walls/ceilings; Not furnished
- Laundry & utility: Front-loading washer in unit; Front-loading dryer in unit; Main floor laundry; Water heater
Neighborhood map
What this means for you Summary
Snapshot
- This is a 4-bed/2.5-bath townhouse listed at $200k.
Deal economics
- At list price, monthly cash flow is $303 ($4k/yr) — positive.
- The deal already cash-flows at list — no discount required.
- Meets the 1% rule at list price ($2k rent vs $200k).
- Recommended offer: $176k (12.0% below list) — sets the bar for market timing.
- Cap rate 8.1% vs local median 6.0% in Baltimore — top-decile yield for the area; either an underpriced asset or a hidden risk that comps aren't pricing in. Stress-test before assuming the spread holds.
Location & tenants
- Location reads 76/100 on livability (#90 in MD, #3,396 nationally) — a middle-class / working-renter tenant base. Strengths: amenities A+, commute A+, housing A+; Watch: schools D, crime F.
- Baltimore City Public Schools (urban): math 7% / reading 16% proficiency, ranked #24 of 24 in MD (top 100%) — low school quality limits family demand, transient renter base, plan for 1-2y turnover; 79% free/reduced lunch — lower-income household profile, screen leases tightly.
- Market conditions: Rents flat; 135 active listings in the ZIP; 40 comparable units currently listed for rent nearby; rentals at typical pace (median 23d on market — plan ~3-4 weeks tenant-placement turnaround); 1,273 units permitted in Baltimore city in 2024 (1,104 in 5+ unit buildings).
- At $2,276/mo this rent would consume 46% of the median local household income ($59k/yr) (locally 1863% of renters already pay >50% of income on rent) — very limited rent-growth headroom before tenants either downsize or default.
Forward outlook
- Local home prices are declining (-3.0%/yr); year-one equity from $1k of loan paydown is wiped out by about $6k of value loss. Plan a longer hold.
- Baltimore County population projected to shrink 4% by 2050 — rents likely to lag national; underwrite the cash flow, not the appreciation.
Negotiation context
- It's been on market 231 days — a 12% lower offer ($176k) is reasonable based on typical stale-listing flexibility.
- 11 sale attempts since 26y ago; this cycle's ask is 10711% above the opening price — seller raised mid-cycle; expect resistance to lowballs.
- Current owner paid $60k; list at $200k implies a 236% gain — meaningful room to come down on a strong offer.
Risks & watch-outs
- Watch-outs: built in 1850 — expect roof / HVAC / electrical / plumbing capex.
- Climate carrying-cost: major wind risk, 27% chance of damaging wind over 30y; extreme-heat days projected 7→15/yr by 2055 (HVAC capex compounding) — expect insurance premiums to compound above CPI over the hold.
Questions for the listing agent
- It's been on market 231 days. Have you received any prior offers? Is the seller open to a 12% concession, seller financing, or rate buy-down credit?
- Built in 1850 — when were the roof, HVAC, electrical panel, plumbing, and water heater last replaced?
- Why hasn't it sold? Are there any deal-killer items the seller is aware of (foundation, flood, title, zoning, code violations)?
- Is there a deadline driving the sale (1031 exchange, divorce, estate, relocation)? That informs how much negotiation room exists.
- Schools are D-rated, which usually means shorter tenancies and higher turnover. Who's the typical renter profile here, and what's been the actual vacancy rate?
- Crime grade is F in this area — have there been break-ins, vandalism, or insurance claims at this property in the last 3 years? What carrier currently insures it and at what premium?
- What's the average days-on-market for RENTAL listings here right now (not sales)? A rising rental-DOM trend means longer vacancies and softer asking-rent achievability than the comps imply.
- What's the recent tenant-quality profile in this submarket — average credit score on applications, eviction rate, late-payment / NSF rate, and stable-employment percentage? A property-management company in the area should have these aggregated.
- How much new for-sale + rental construction is in the pipeline within 1–3 miles? Heavy new supply typically softens prices + rents 12–24 months out; constrained supply supports both.
Investment metrics
- 1% rule
- 1.14% ✓
- Cap rate
- 8.11%
- Cash-on-cash
- 6.48%
- DSCR
- 1.29
- GRM
- 7.3
CMA / ARV
- ARV (on-the-fly)
- $272,340
- Comps found
- 8
Show comp detail 8 sales within ~0.75 mi
| Address | Dist | Beds/Ba | Sqft | Sold | Price | $/sf | Match |
|---|---|---|---|---|---|---|---|
| 1008 Stiles St | 0.00mi | 4/2.5 | 1,068 (0%) | 1mo | $193,500 | $181 | 99 |
| 909 Eastern Ave | 0.17mi | 4/2.0 | 1,070 (+0%) | 20mo | $220,000 | $206 | 73 |
| 617 S Durham St | 0.60mi | 3/1.5 (-1) | 1,007 (-6%) | 0mo | $315,000 | $313 | 53 |
| 1533 Lancaster St | 0.46mi | 3/1.0 (-1) | 1,080 (+1%) | 22mo | $305,000 | $282 | 48 |
| 7 S Castle St | 0.73mi | 3/2.0 (-1) | 1,076 (+1%) | 14mo | $274,000 | $255 | 46 |
| 533 S Chapel St | 0.64mi | 3/2.0 (-1) | 984 (-8%) | 20mo | $285,000 | $290 | 34 |
| 1913 Bank St | 0.60mi | 3/1.0 (-1) | 1,202 (+12%) | 11mo | $275,000 | $229 | 31 |
| 619 S Wolfe St | 0.64mi | 3/1.0 (-1) | 924 (-14%) | 10mo | $183,000 | $198 | 29 |
Match score weights: distance 35% · size 25% · config 20% · recency 20%. Top-matched comps best support the ARV.
Projected returns pro-forma
-3.0% appreciation · 0.59% rent growth · sell at horizon
- IRR
- -9.2%
- Equity multiple
- 0.67×
- Total profit
- $-18,424
- Equity at exit
- $29,821
- IRR
- -3.6%
- Equity multiple
- 0.79×
- Total profit
- $-11,881
- Equity at exit
- $17,292
Cash invested: $56,000 (down + closing). Projections, not guarantees.
Landlord ↔ Tenant lean methodology
- Overall (CITY)
- 12 Strongly Tenant-Friendly
- State Maryland
- 27 Tenant-Leaning · D+14
- County
- — inherits STATE
- City Baltimore
- 12 Strongly Tenant-Friendly · D+58
ZIP-level market 21202
- Home prices YoY
- -8.0%
- Rents YoY
- 0.6%
- Active inventory
- 135
- Price-to-rent
- 7.3×
Monthly cashflow live
- Estimated rent
- $2,276 high interval (Pro) →
- Mortgage (P&I)
- −$1,049
- Tax from tax record
- −$364 /mo · $4,362/yr
- Insurance
- −$83
- HOA
- −$0
- Vacancy / Maint / Mgmt
- −$478
- Net cashflow
- $303
Break-even live
Sensitivity live
| Price | -10% $416 | -5% $359 | +0% $303 | +5% $246 | +10% $189 |
|---|---|---|---|---|---|
| Rent | -10% $123 | -5% $213 | +0% $303 | +5% $392 | +10% $482 |
| Rate | -1.0pp $403 | -0.5pp $353 | base $303 | +0.5pp $251 | +1.0pp $198 |
UW: 25.0% down · 7.5% · 30yr · 1.5% tax · 5.0% vac · 8.0% maint · 8.0% mgmt
Financing live
Cash to close
- Down payment
- $50,000
- Closing costs
- $6,000
- Reserves months
- —
- Total cash needed
- —
Loan-product check · same deal, 3 products live
Conventional
25% down · 7.5% · 30yr
- Down + closing
- —
- Monthly P&I
- —
- Monthly cashflow
- —
- DSCR
- —
- Eligible?
- —
Personal DTI + credit; lowest rate.
DSCR
20% down · 8.5% · 30yr
- Down + closing
- —
- Monthly P&I
- —
- Monthly cashflow
- —
- DSCR
- —
- Eligible?
- —
No personal income docs; deal must DSCR.
Hard money
10% down · 12.0% · 12mo
- Down + closing
- —
- Monthly P&I
- —
- Monthly cashflow
- —
- DSCR
- —
- Eligible?
- —
Short-term bridge; refi at stabilization.
Rent comps 40 comps
| Address | Beds | Baths | Sqft | Rent | $/sqft | DOM | Units | Dist |
|---|---|---|---|---|---|---|---|---|
| 555 President St Baltimore, MD | 3.0 | 1.0–4.0 | 1352 | $5,373 | $3.97 | 3d | 1 | 0.22mi |
| 414 Water St Baltimore, MD | 1.0–3.0 | 1.0–2.5 | 751 | $3,600 | $4.79 | 3d | 6 | 0.45mi |
| 414 Water St Baltimore, MD | 1.0–3.0 | 1.0–2.5 | 751 | $3,600 | $4.79 | 3d | 7 | 0.45mi |
| 706 S Bethel St Baltimore, MD | 3.0 | 2.0 | 1500 | $3,300 | $2.20 | 44d | 1 | 0.49mi |
| 1802 Gough St Baltimore, MD | 3.0 | 2.0 | 1368 | $2,595 | $1.90 | 44d | 1 | 0.52mi |
| 1816 Gough St Baltimore, MD | 4.0 | 2.0 | 1248 | $3,500 | $2.80 | 24d | 1 | 0.53mi |
| 1402 Point St Baltimore, MD | 2.0–3.0 | 2.5–3.0 | 1470 | $5,730 | $3.90 | 4d | 3 | 0.56mi |
| 100 E Redwood St Baltimore, MD | 3.0 | 1.0–2.0 | 950 | $4,751 | $5.00 | 2d | 23 | 0.66mi |
| 22 Light St Baltimore, MD | 2.0–3.0 | 1.0–2.0 | 956 | $1,395 | $1.46 | 4d | 1 | 0.70mi |
| 1418 E Monument St Baltimore, MD | 2.0–4.0 | 1.0–2.0 | 1265 | $1,920 | $1.52 | 15d | 5 | 0.71mi |
| 2015 E Fairmount Ave Baltimore, MD | 3.0 | 3.5 | 1402 | $2,500 | $1.78 | 44d | 1 | 0.73mi |
| 1226 E Madison St Baltimore, MD | 3.0 | 1.0 | 1100 | $2,179 | $1.98 | 5d | 1 | 0.78mi |
| 301 Warren Ave Baltimore, MD | 1.0–3.0 | 1.0–2.5 | 1533 | $3,865 | $2.52 | 2d | 9 | 0.79mi |
| 305 S Collington Ave Baltimore, MD | 3.0 | 2.5 | 722 | $2,895 | $4.01 | 18d | 1 | 0.82mi |
| 1205 Ashland Ave Baltimore, MD | 3.0 | 1.0 | 992 | $1,550 | $1.56 | 24d | 1 | 0.83mi |
| 1232 Ashland Ave Baltimore, MD | 3.0 | 1.0 | 1200 | $1,600 | $1.33 | 22d | 1 | 0.86mi |
| 2210 Cambridge St Baltimore, MD | 3.0 | 3.5 | 1450 | $2,725 | $1.88 | 44d | 1 | 0.90mi |
| 931 N Central Ave Baltimore, MD | 3.0 | 1.0 | 1085 | $1,400 | $1.29 | 24d | 1 | 0.91mi |
| 2242 E Fairmount Ave Baltimore, MD | 3.0 | 2.0 | 1345 | $2,850 | $2.12 | 44d | 1 | 0.93mi |
| 1317 E Eager St Baltimore, MD | 4.0 | 1.5 | 1400 | $1,900 | $1.36 | 22d | 1 | 0.93mi |
| 2208 Orleans St Baltimore, MD | 3.0 | 1.0 | 1310 | $1,775 | $1.35 | 44d | 1 | 0.96mi |
| 02 W Henrietta St Unit B Baltimore, MD | 3.0 | 2.0 | 1500 | $2,000 | $1.33 | 18d | 1 | 0.96mi |
| 724 S Hanover St Baltimore, MD | 3.0 | 2.5 | 1351 | $2,895 | $2.14 | 44d | 1 | 0.97mi |
| 14 Poultney St Baltimore, MD | 3.0 | 2.5 | 1344 | $2,500 | $1.86 | 13d | 1 | 0.99mi |
| 651 E Clement St Baltimore, MD | 3.0 | 3.5 | 1292 | $2,800 | $2.17 | 44d | 1 | 0.99mi |
| 2317 E Fayette St Baltimore, MD | 3.0 | 1.5 | 1315 | $2,000 | $1.52 | 13d | 1 | 0.99mi |
| 1009 Hillman St Baltimore, MD | 3.0 | 1.0 | 1200 | $1,650 | $1.38 | 21d | 1 | 0.99mi |
| 1027 N Central Ave Baltimore, MD | 3.0 | 1.0 | 1200 | $1,600 | $1.33 | 22d | 1 | 1.01mi |
| 300 W Fayette St Baltimore, MD | 3.0 | 1.0–3.0 | 1267 | $2,250 | $1.78 | 4d | 9 | 1.03mi |
| 2410 E Fayette St Baltimore, MD | 3.0 | 1.0 | 1224 | $1,800 | $1.47 | 44d | 1 | 1.06mi |
| 2308 Jefferson St Baltimore, MD | 3.0 | 1.0 | 907 | $1,450 | $1.60 | 44d | 1 | 1.08mi |
| 420 N Montford Ave Baltimore, MD | 3.0 | 1.0 | 1350 | $1,450 | $1.07 | 44d | 1 | 1.08mi |
| 118 E Gittings St Baltimore, MD | 3.0 | 2.5 | 1148 | $2,600 | $2.26 | 24d | 1 | 1.08mi |
| 1100 Greenmount Ave Baltimore, MD | 1.0–3.0 | 1.0–2.0 | 839 | $2,584 | $3.08 | 3d | 1 | 1.09mi |
| 226 E Eager St Baltimore, MD | 3.0 | 2.0 | 1484 | $650 | $0.44 | 44d | 1 | 1.09mi |
| 437 N Montford Ave Baltimore, MD | 3.0 | 1.5 | 1100 | $1,450 | $1.32 | 44d | 1 | 1.11mi |
| 1201 S Charles St Baltimore, MD | 2.0–3.0 | 2.0 | 1341 | $2,350 | $1.75 | 5d | 4 | 1.11mi |
| 104 N Rose St Baltimore, MD | 3.0 | 2.0 | 936 | $2,500 | $2.67 | 44d | 1 | 1.12mi |
| 1200 N Eden St Baltimore, MD | 5.0 | 4.5 | 1208 | $1,400 | $1.16 | 5d | 1 | 1.12mi |
| 821 N Collington Ave Baltimore, MD | 3.0 | 2.0 | 1150 | $1,950 | $1.70 | 44d | 1 | 1.15mi |
Listing history 36 events
-
2026-05-10status Pending
-
2026-04-23historical Active Under Contract
-
2026-03-28price $199,999
-
2026-03-21price $225,000
-
2026-03-06price $229,000
-
2026-02-07price $235,000
-
2026-01-08status Active
-
2026-01-01historical $1,850
-
2025-12-31historical Active Under Contract
-
2025-12-08$1,850
-
2025-11-14price $245,000
-
2025-10-14price $250,000
-
2025-10-12status Active
-
2025-09-25status Pending
-
2025-08-18historical Active Under Contract
-
2025-08-13price $249,999
-
2025-07-25price $275,000
-
2025-07-05price $295,000
-
2025-07-05status Active
-
2025-06-07historical
-
2025-06-06price $274,900
-
2025-06-06$275,000 Active
-
2014-09-09historical Withdrawn
-
2014-09-09historical
-
2014-08-11Active
-
2014-08-11$265,000
-
2009-05-05historical
-
2009-05-05historical
-
2008-09-19
-
2008-09-19$399,000
-
2007-12-01historical
-
2007-06-14
-
2000-04-27soldstatus $59,500
-
2000-04-20soldstatus $59,500
-
2000-02-28historical
-
2000-02-15$69,900
ⓘ Source: listings_history table (triggers on properties + properties_extension) + one-shot
backfill from property_details.listing_events for pre-trigger history.
Tax reassessment forecast MD · Partial reset (capped growth)
- Current annual tax
- $4,362 · $364/mo
- Projected year-2 tax
- $4,362 · $364/mo
- Expected delta
- $0/yr ($0/mo · 0.0%)
ⓘ Screening estimate from a state-policy table — verify with the county assessor before closing.
Climate risk First Street
- Flood 1/10 Low FEMA zone X (unshaded) · 0% chance over 30 yrs
- Wildfire 1/10 Low
- Heat 8/10 Severe 7 d/yr ≥103°F today · 15 d/yr by 30 yrs out
- Wind 6/10 Major 27% chance of damaging wind over 30 yrs
- Air quality 4/10 Moderate 6 unhealthy d/yr today · 7 by 30 yrs out
Nearby sold comps map
Loading sold comps map…
Walkable amenities ~0.75 mi
Loading nearby amenities…
Taxation est. · year 1
- Rental income
- $27,315
- − Mortgage interest
- −$11,203
- − Property taxes
- −$4,362
- − Insurance
- −$1,000
- − Repairs & maintenance
- −$2,185
- − Management
- −$2,185
- − Depreciation
- −$5,818
- Taxable income
- $561
- Est. tax owed @ 24.0%
- −$135
- After-tax cash flow
- $3,496/yr
For passive investors: Depreciation is non-cash, so a rental often shows a tax loss while cash-flowing — sheltering income. Rental losses are passive: they offset passive income freely, and up to $25,000/yr can offset ordinary (W-2) income if you actively participate and your MAGI is under $100k (phasing out to $0 by $150k); unused losses carry forward. On sale, claimed depreciation is recaptured at up to 25%, and gains may owe capital-gains tax (a 1031 exchange can defer both). Figures are a year-1 estimate at your 24.0% rate — not tax advice; consult a CPA.
Schools (NCES district)
- District
- Baltimore City Public Schools
- NCES district ID
- 2400090
- Math proficiency
- 7% ▼ -9.00%
- Reading proficiency
- 16% ▼ -5.00%
- Median HH income
- $42,108
- Composite
- 10.08/100
- National rank
- #9805
- State rank
- #24 of 24 in MD
Livability — Baltimore
- Score
- 76/100
- State rank
- #90
- US rank
- #3396
Category grades
Schools grade is shown separately in the Schools card above.
Census & demographics
- Census place
- Baltimore, MD
- County
- Baltimore City · 558,601 people
- City population
- 588,727
- Metro
- Baltimore-Columbia-Towson, MD
- Population (ZIP)
- 20,683
- Household income
- $59,377
- Rent vs Own
- Severe rent burden
- 1863.0
Population outlook (Baltimore County) Hauer SSP2
- Today (2025)
- 624,249 people
- By 2030
- 621,541 · -0.4%
- By 2040
- 609,756 · -2.3%
- By 2050
- 597,249 · -4.3%
- By 2075
- 552,236 · -11.5%
- By 2100
- 513,934 · -17.7%
Race, ethnicity, and origin ACS 2023
- Neighborhood character
- Diverse neighborhood (Simpson 0.63)
- Race & ethnicity
- Black 52% White 31% Hispanic / Latino 7% Two or more races 6% Asian 5%
- Hispanic origin (detail)
- Mexican 2%
- Common ancestry
- Lithuanian 2% Romanian 2% Slovak 1%
- Foreign-born
- 12% · Canada, South Korea, China
- Languages at home
- 87% English-only · Spanish 4% Other Indo-European 2% Arabic 1%
Political lean MEDSL · Baltimore
- 2024 margin
- Solid D (+73.0) · D 85.2% · R 12.2% · Other 2.6%
- 2008→2024 swing
- -2.5pp toward R · 2008: 75.5pp · 2024: 73.0pp
- All cycles
- 2024: D+73.0 2020: D+76.6 2016: D+74.6 2012: D+76.4 2008: D+75.5
Not yet ingested
- Civics
- —
Market trends
- HPI YoY
- ▼ -25.44%
- Current HPI
- 291.3702
- Rent YoY
- ▲ 0.59%
- Metro
- Baltimore-Columbia-Towson, MD
- State GDP YoY
- ▲ 2.97%
- F500 in state
- 12
Industry mix (Fortune 500 HQ in MD)
| Industry | F500 HQs | Revenue |
|---|---|---|
| Aerospace / Defense | 1 | $71B |
|
||
| Utilities | 1 | $25B |
|
||
| Hotels | 1 | $24B |
|
||
| Consumer Goods | 1 | $7B |
|
||
| Real Estate | 1 | $6B |
|
||
| Chemicals | 1 | $2B |
|
||
Price history
+186.1% since first listed36 events — show timeline
- 2026-05-10 Pending — BRIGHT MLS
- 2026-04-23 Contingent — BRIGHT MLS
- 2026-03-28 Price Changed $199,999 BRIGHT MLS
- 2026-03-21 Price Changed $225,000 BRIGHT MLS
- 2026-03-06 Price Changed $229,000 BRIGHT MLS
- 2026-02-07 Price Changed $235,000 BRIGHT MLS
- 2026-01-08 Relisted — BRIGHT MLS
- 2026-01-01 Rental Removed $1,850 BRIGHTMLS
- 2025-12-31 Contingent — BRIGHT MLS
- 2025-12-08 Listed for Rent $1,850 BRIGHTMLS
- 2025-11-14 Price Changed $245,000 BRIGHT MLS
- 2025-10-14 Price Changed $250,000 BRIGHT MLS
- 2025-10-12 Relisted — BRIGHT MLS
- 2025-09-25 Pending — BRIGHT MLS
- 2025-08-18 Contingent — BRIGHT MLS
- 2025-08-13 Price Changed $249,999 BRIGHT MLS
- 2025-07-25 Price Changed $275,000 BRIGHT MLS
- 2025-07-05 Price Changed $295,000 BRIGHT MLS
- 2025-07-05 Relisted — BRIGHT MLS
- 2025-06-07 Listing Removed — BRIGHT MLS
- 2025-06-06 Price Changed $274,900 BRIGHT MLS
- 2025-06-06 Listed $275,000 BRIGHT MLS
- 2014-09-09 Delisted — MRIS
- 2014-09-09 Listing Removed — BRIGHT MLS
- 2014-08-11 Listed — MRIS
- 2014-08-11 Listed $265,000 BRIGHT MLS
- 2009-05-05 Delisted — MRIS
- 2009-05-05 Listing Removed — BRIGHT MLS
- 2008-09-19 Listed — MRIS
- 2008-09-19 Listed $399,000 BRIGHT MLS
- 2007-12-01 Delisted — MRIS
- 2007-06-14 Listed — MRIS
- 2000-04-27 Sold (MLS) $59,500 MRIS
- 2000-04-20 Sold (Public Records) $59,500 Public Records
- 2000-02-28 Delisted — MRIS
- 2000-02-15 Listed $69,900 MRIS
Property tax history
+0.6%/yrLatest (2025): $4,362 · +161.1% YoY. Source: county tax records.
Cash-flow waterfall
monthlySold comps — $/sqft
last 12 mo · ≤1 miLoading sold comps…