20876 E Quail Run Dr · Cordes Lakes, AZ
Flood risk 1/10 · Minimal
- FEMA flood zone
- X (unshaded)
- Chance of flooding over 30 yrs
- 0.0%
- Est. flood insurance / yr
- $507 – $1,088
Fire risk 6/10 · Moderate
- Est. fire insurance / yr
- $610 – $1,132
Heat risk 6/10 · Moderate
- Hot days now (above 102°F)
- 5 days/yr
- Hot days in 30 yrs
- 11 days/yr
Wind risk 1/10 · Minimal
- Chance of severe wind over 30 yrs
- —
Air-quality risk 2/10 · Minimal
- Unhealthy air days now
- 1 days/yr
- Unhealthy air days in 30 yrs
- 1 days/yr
Risk factors via First Street. Map © Google.
Why this score? — see what drove the D- grade
The composite is a weighted blend of 9 inputs, each scored 0–100. Each bar is that input's sub-score; the figure is the points it added to the 100-point composite (weight × sub-score).
- Appreciation +10.0/10.0
- Cash flow +8.7/30.0
- ARV discount +3.2/15.0
- Livability +3.0/5.0
- 1% rule +2.7/10.0
- Rent growth +2.5/5.0
- Condition / age +2.5/5.0
- DSCR +2.4/10.0
- Schools +2.0/10.0
$260,000
🖨 Deal sheet (PDF) 📄 Offer letter ✓ Due diligence
Listing remarks
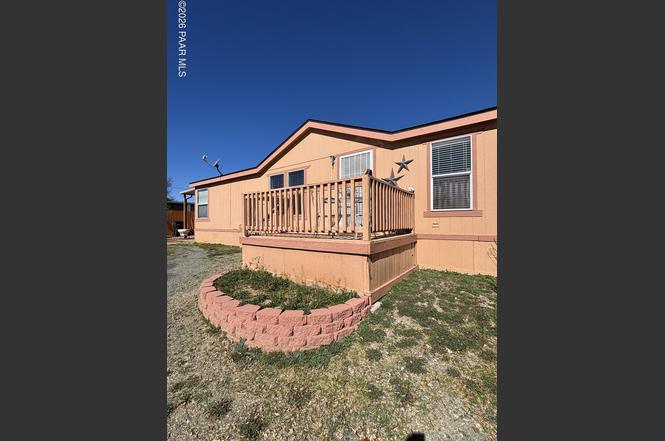
home has been loved by these original owners. Beautiful covered side patio detached carportfenced back yard with a large 12 x 12 shedcome and enjoy the mild 4 seasons all year round. Great central location in Arizona
Key facts
- Detached carport
- Fenced back yard
- Central location
Tags
Property features AI
Finance
- Other: Zoning: R1-10; Road maintenance by county; Road frontage on a county road (asphalt/paved)
- HOA & community: Not a senior community
Exterior
- Parking: Detached carport (1 vehicle); Asphalt parking surface; Total parking for 1 vehicle
- Security: Smoke detectors
- Utilities: Private water source; Septic system (WWT - Septic Conv); Propane available; 220V electrical service
- Home design: Manufactured double-wide home; Single-story
- Construction: Frame construction; Composition roof; Crawl space foundation; Built area approximately 1,296
- Exterior features: Covered deck; Shed(s); Back yard perimeter fencing; Level lot
Interior
- Kitchen: Dishwasher; Microwave; Refrigerator
- Flooring: Laminate
- Bathrooms: 2 full bathrooms
- Heating & cooling: Central air; Ceiling fans; Forced air heating; Propane heating
- Interior features: Ceiling fans; Eat-in kitchen / Kitchen-dining combo; Vaulted ceilings; Washer/dryer connection; Laundry room
- Laundry & utility: Washer/dryer connection; Electric water heater
Neighborhood map
What this means for you Summary
Snapshot
- This is a 3-bed/2.0-bath manufactured listed at $260k.
Deal economics
- At list price, monthly cash flow is $-217 ($-3k/yr) — negative.
- To cash-flow at today's rent, offer at most $229k (12.1% below list).
- To meet the 1% rule (rent ≥ 1% of price), the offer needs to be $200k (23.1% below list).
- Recommended offer: $200k (23.1% below list) — sets the bar for 1% rule.
Location & tenants
- Location reads 60/100 on livability (#181 in AZ) — a middle-class / working-renter tenant base. Strengths: cost of living A+, housing A+, crime A-; Watch: amenities F, commute F, employment F.
- Mayer Unified School District (4473) (rural): math 23% / reading 26% proficiency, ranked #165 of 249 in AZ (top 66%) — low school quality limits family demand, transient renter base, plan for 1-2y turnover; 80% free/reduced lunch — lower-income household profile, screen leases tightly.
- Zoned schools: Mayer Elementary School (math 26% / reading 32%, grade F, #570 of 1,109 statewide, top 52%, 373 students, 93% FRL); Mayer High School (math 5% / reading 5%, grade F, #364 of 381 statewide, top 100%, 200 students, 66% FRL) — zoned schools at 79% FRL track the district average.
- Market conditions: 244 active listings in the ZIP; 2,062 units permitted in Yavapai County in 2024 (98 in 5+ unit buildings).
Forward outlook
- In year one you build about $28k of equity ($2k loan paydown + $26k appreciation (10.0% local appreciation)).
- Yavapai County population projected at +10% by 2050 — modest demand growth; plan on rents tracking national, not racing it.
- By year 2, paydown + projected appreciation supports a ~$45k cash-out refi (75% LTV) — recoverable capital for the next deal without selling this one.
Negotiation context
- It's been on market 56 days — a 3% lower offer ($252k) is reasonable based on typical stale-listing flexibility.
- Current owner paid $10k; list at $260k implies a 2500% gain — meaningful room to come down on a strong offer.
Risks & watch-outs
- Climate carrying-cost: major wildfire risk; extreme-heat days projected 5→11/yr by 2055 (HVAC capex compounding) — expect insurance premiums to compound above CPI over the hold.
Questions for the listing agent
- What do current leases actually rent for vs. the listed asking? Can we see a recent rent roll and the last 12 months of T-12 income?
- It's been on market 56 days. Have you received any prior offers? Is the seller open to a 23% concession, seller financing, or rate buy-down credit?
- Is there a deadline driving the sale (1031 exchange, divorce, estate, relocation)? That informs how much negotiation room exists.
- Schools are F-rated, which usually means shorter tenancies and higher turnover. Who's the typical renter profile here, and what's been the actual vacancy rate?
- The area grade is low — what's the realistic commute time and amenity access for the typical tenant pool here? Any planned neighborhood developments (good or bad) we should know about?
- What's the average days-on-market for RENTAL listings here right now (not sales)? A rising rental-DOM trend means longer vacancies and softer asking-rent achievability than the comps imply.
- What's the recent tenant-quality profile in this submarket — average credit score on applications, eviction rate, late-payment / NSF rate, and stable-employment percentage? A property-management company in the area should have these aggregated.
- How much new for-sale + rental construction is in the pipeline within 1–3 miles? Heavy new supply typically softens prices + rents 12–24 months out; constrained supply supports both.
Investment metrics
- 1% rule
- 0.77% ✗
- Cap rate
- 5.29%
- Cash-on-cash
- -3.58%
- DSCR
- 0.84
- GRM
- 10.8
CMA / ARV
- ARV (on-the-fly)
- $237,168
- Comps found
- 12
Show comp detail 12 sales within ~0.75 mi
| Address | Dist | Beds/Ba | Sqft | Sold | Price | $/sf | Match |
|---|---|---|---|---|---|---|---|
| 20809 E Antelope Rd | 0.34mi | 3/2.0 | 1,350 (+4%) | 3mo | $239,900 | $178 | 74 |
| 20721 E Mingus Dr | 0.17mi | 3/2.0 | 1,152 (-11%) | 8mo | $190,000 | $165 | 67 |
| 20907 E Marble Canyon Way | 0.37mi | 2/2.0 (-1) | 1,287 (-1%) | 13mo | $235,000 | $183 | 65 |
| 20850 E Cedar Dr | 0.29mi | 2/2.0 (-1) | 1,184 (-9%) | 3mo | $74,000 | $63 | 64 |
| 20605 E Conestoga Dr | 0.38mi | 3/2.0 | 1,420 (+10%) | 6mo | $260,000 | $183 | 62 |
| 20415 E Sierra Dr E #8 | 0.56mi | 3/2.0 | 1,380 (+6%) | 4mo | $289,000 | $209 | 60 |
| 20629 E Prickly Pear Dr | 0.48mi | 3/2.0 | 1,407 (+9%) | 7mo | $199,900 | $142 | 58 |
| 20518 E Sierra Dr | 0.53mi | 3/2.0 | 1,210 (-7%) | 14mo | $224,900 | $186 | 53 |
| 20921 E Skyview Ln | 0.56mi | 2/2.0 (-1) | 1,414 (+9%) | 3mo | $340,000 | $240 | 51 |
| 20524 E Concho Ln | 0.41mi | 3/1.0 | 1,119 (-14%) | 5mo | $199,000 | $178 | 50 |
| 20929 E Coyote Ln | 0.48mi | 2/2.0 (-1) | 1,477 (+14%) | 1mo | $205,000 | $139 | 48 |
| 20225 E Conestoga Dr | 0.66mi | 3/2.0 | 1,173 (-10%) | 16mo | $239,000 | $204 | 40 |
Match score weights: distance 35% · size 25% · config 20% · recency 20%. Top-matched comps best support the ARV.
Projected returns pro-forma
10.0% appreciation · 3.0% rent growth · sell at horizon
- IRR
- 21.7%
- Equity multiple
- 2.76×
- Total profit
- $127,816
- Equity at exit
- $234,229
- IRR
- 19.6%
- Equity multiple
- 6.32×
- Total profit
- $387,322
- Equity at exit
- $505,123
Cash invested: $72,800 (down + closing). Projections, not guarantees.
Landlord ↔ Tenant lean methodology
- Overall (STATE)
- 87 Strongly Landlord-Friendly
- State Arizona
- 87 Strongly Landlord-Friendly · R+3
- County
- — inherits STATE
- City
- — inherits STATE
ZIP-level market 86333
- Home prices YoY
- 17.3%
- Active inventory
- 244
- Price-to-rent
- 10.8×
Monthly cashflow live
- Estimated rent
- $2,000 medium interval (Pro) →
- Mortgage (P&I)
- −$1,363
- Tax est. 1.5%
- −$325 /mo · $3,900/yr
- Insurance
- −$108
- HOA
- −$0
- Vacancy / Maint / Mgmt
- −$420
- Net cashflow
- $-217
Break-even live
Sensitivity live
| Price | -10% $-37 | -5% $-127 | +0% $-217 | +5% $-307 | +10% $-397 |
|---|---|---|---|---|---|
| Rent | -10% $-375 | -5% $-296 | +0% $-217 | +5% $-138 | +10% $-59 |
| Rate | -1.0pp $-86 | -0.5pp $-151 | base $-217 | +0.5pp $-284 | +1.0pp $-353 |
UW: 25.0% down · 7.5% · 30yr · 1.5% tax · 5.0% vac · 8.0% maint · 8.0% mgmt
Financing live
Cash to close
- Down payment
- $65,000
- Closing costs
- $7,800
- Reserves months
- —
- Total cash needed
- —
Loan-product check · same deal, 3 products live
Conventional
25% down · 7.5% · 30yr
- Down + closing
- —
- Monthly P&I
- —
- Monthly cashflow
- —
- DSCR
- —
- Eligible?
- —
Personal DTI + credit; lowest rate.
DSCR
20% down · 8.5% · 30yr
- Down + closing
- —
- Monthly P&I
- —
- Monthly cashflow
- —
- DSCR
- —
- Eligible?
- —
No personal income docs; deal must DSCR.
Hard money
10% down · 12.0% · 12mo
- Down + closing
- —
- Monthly P&I
- —
- Monthly cashflow
- —
- DSCR
- —
- Eligible?
- —
Short-term bridge; refi at stabilization.
Listing history 5 events
-
2026-04-30status Pending
-
2026-04-22price $260,000
-
2026-04-02price $271,000
-
2026-03-03$279,000 Active
-
1996-08-29soldstatus $10,000
ⓘ Source: listings_history table (triggers on properties + properties_extension) + one-shot
backfill from property_details.listing_events for pre-trigger history.
Climate risk First Street
- Flood 1/10 Low FEMA zone X (unshaded) · 0% chance over 30 yrs
- Wildfire 6/10 Major
- Heat 6/10 Major 5 d/yr ≥102°F today · 11 d/yr by 30 yrs out
- Wind 1/10 Low
- Air quality 2/10 Low 1 unhealthy d/yr today · 1 by 30 yrs out
Nearby sold comps map
Loading sold comps map…
Walkable amenities ~0.75 mi
Loading nearby amenities…
Taxation est. · year 1
- Rental income
- $23,998
- − Mortgage interest
- −$14,564
- − Property taxes
- −$3,900
- − Insurance
- −$1,300
- − Repairs & maintenance
- −$1,920
- − Management
- −$1,920
- − Depreciation
- −$7,564
- Taxable loss
- −$7,169
- Est. tax savings @ 24.0%
- +$1,721
- After-tax cash flow
- $-883/yr
For passive investors: Depreciation is non-cash, so a rental often shows a tax loss while cash-flowing — sheltering income. Rental losses are passive: they offset passive income freely, and up to $25,000/yr can offset ordinary (W-2) income if you actively participate and your MAGI is under $100k (phasing out to $0 by $150k); unused losses carry forward. On sale, claimed depreciation is recaptured at up to 25%, and gains may owe capital-gains tax (a 1031 exchange can defer both). Figures are a year-1 estimate at your 24.0% rate — not tax advice; consult a CPA.
Schools (NCES district)
- District
- Mayer Unified School District (4473)
- NCES district ID
- 0404820
- Math proficiency
- 23% ▼ -11.00%
- Reading proficiency
- 26% ▼ -13.00%
- Median HH income
- $35,108
- Composite
- 20.22/100
- National rank
- #8627
- State rank
- #165 of 249 in AZ
Livability — Cordes Lakes
- Score
- 60/100
- State rank
- #181
- US rank
- #19144
Category grades
Schools grade is shown separately in the Schools card above.
Census & demographics
- Census place
- Cordes Lakes, AZ
- Population (ZIP)
- 6,425
Population outlook (Yavapai County) Hauer SSP2
- Today (2025)
- 241,389 people
- By 2030
- 249,523 · +3.4%
- By 2040
- 259,966 · +7.7%
- By 2050
- 264,736 · +9.7%
- By 2075
- 269,334 · +11.6%
- By 2100
- 256,505 · +6.3%
Race, ethnicity, and origin ACS 2023
- Neighborhood character
- Predominantly White (77%)
- Race & ethnicity
- White 77% Two or more races 15% Hispanic / Latino 14%
- Hispanic origin (detail)
- Mexican 11% Puerto Rican 1%
- Common ancestry
- Lithuanian 6% Iranian 3% Romanian 3%
- Foreign-born
- 5% · Canada
- Languages at home
- 93% English-only · Spanish 6% Russian/Polish/Slavic 1%
Political lean MEDSL · Yavapai
- 2024 margin
- Solid R (+33.9) · D 32.6% · R 66.5%
- 2008→2024 swing
- -9.5pp toward R · 2008: -24.4pp · 2024: -33.9pp
- All cycles
- 2024: R+33.9 2020: R+29.3 2016: R+31.4 2012: R+30.7 2008: R+24.4
Not yet ingested
- Civics
- —
Market trends
- HPI YoY
- ▲ 55.51%
- Current HPI
- 376.0374
- Rent YoY
- —
- Metro
- —
- State GDP YoY
- ▲ 4.54%
- F500 in state
- 20
Industry mix (Fortune 500 HQ in AZ)
| Industry | F500 HQs | Revenue |
|---|---|---|
| Technology | 2 | $13B |
|
||
| Mining / Metals | 1 | $23B |
|
||
| Environmental Services | 1 | $16B |
|
||
| Metals / Steel | 1 | $14B |
|
||
| Technology Distribution | 1 | $9B |
|
||
| Homebuilding | 1 | $8B |
|
||
Price history
+2500.0% since first listed5 events — show timeline
- 2026-04-30 Pending — PAARMLS as Distributed by MLS Grid
- 2026-04-22 Price Changed $260,000 PAARMLS as Distributed by MLS Grid
- 2026-04-02 Price Changed $271,000 PAARMLS as Distributed by MLS Grid
- 2026-03-03 Listed $279,000 PAARMLS as Distributed by MLS Grid
- 1996-08-29 Sold (Public Records) $10,000 Public Records
Property tax history
-0.8%/yrLatest (2025): $415 · +6.6% YoY. Source: county tax records.
Cash-flow waterfall
monthlySold comps — $/sqft
last 12 mo · ≤1 miLoading sold comps…