6655 Huntington Lakes Cir #202 · Island Walk, FL
Flood risk 1/10 · Minimal
- FEMA flood zone
- X (unshaded)
- Chance of flooding over 30 yrs
- 0.0%
- Est. flood insurance / yr
- $507 – $1,088
Fire risk 1/10 · Minimal
- Est. fire insurance / yr
- $947 – $1,759
Heat risk 10/10 · Severe
- Hot days now (above 108°F)
- 7 days/yr
- Hot days in 30 yrs
- 31 days/yr
Wind risk 10/10 · Severe
- Chance of severe wind over 30 yrs
- 99.0%
Air-quality risk 2/10 · Minimal
- Unhealthy air days now
- 2 days/yr
- Unhealthy air days in 30 yrs
- 2 days/yr
Risk factors via First Street. Map © Google.
Why this score? — see what drove the C- grade
The composite is a weighted blend of 9 inputs, each scored 0–100. Each bar is that input's sub-score; the figure is the points it added to the 100-point composite (weight × sub-score).
- Cash flow +17.7/30.0
- ARV discount +7.5/15.0
- 1% rule +6.7/10.0
- DSCR +5.5/10.0
- Schools +5.0/10.0
- Livability +3.2/5.0
- Condition / age +2.5/5.0
- Rent growth +1.9/5.0
- Appreciation +0.0/10.0
$299,950
🖨 Deal sheet (PDF) 📄 Offer letter ✓ Due diligence
Listing remarks
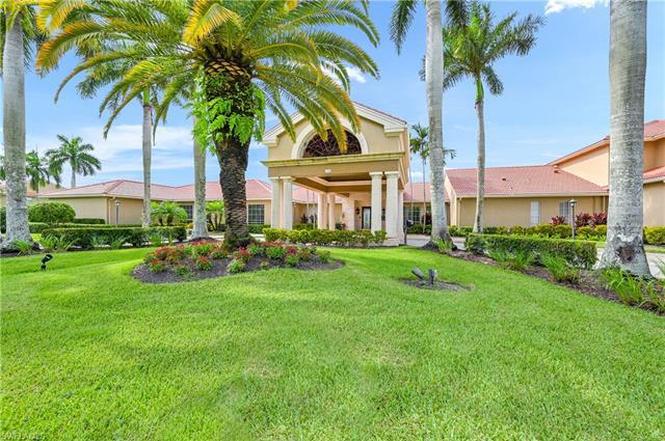
Experience the best of Naples living at Huntington Lakes, a highly sought-after community that seamlessly blends relaxation and recreation. Located in North Naples, residents enjoy convenient access to shopping, the airport, and I-75, making it easy to explore all that the area has to offer. The community's impressive array of amenities, including three swimming pools, a hot tub, and beautifully landscaped grounds, creates a tranquil oasis perfect for unwinding. Residents can engage in a wide range of pursuits, from sports and fitness to social events and games. This stunning condo boasts modern amenities, including a new dishwasher and air conditioner, and the community's low maintenance f
Key facts
- Hot tub
- Landscaped grounds
- Three swimming pools
Tags
Property features AI
Finance
- Other: Part of Huntington Lakes development; 648 units in complex; 8 units in building; 2 units per floor; 1 floor in this building
- HOA & community: Mandatory HOA; HOA fee $824 quarterly; Master HOA fee $1,100 quarterly; Master and association maintenance covers cable, insurance, internet/Wi‑Fi, irrigation water, lawn/land maintenance, legal/accounting, manager, interior pest control, street lights, street maintenance, trash removal, and water; Community amenities include clubhouse, community pool and spa/hot tub, exercise room, sauna, billiards, library, hobby room, internet access, BBQ/picnic area, bocce court, tennis court, sidewalks, and streetlights; Total annual recurring fees $7,696; one-time fees $150
Exterior
- Parking: 1 assigned covered parking; Detached 1-car carport
- Security: Gated community
- Utilities: Water assessments paid; Sewer assessments paid; Cable available
- Home design: Residential low-rise building (1–3 stories); 2-story building; Rear exposure facing west; Unit 202
- Construction: Concrete block construction; Tile roof; Built in 2006
- Exterior features: Automatic sprinkler system; Arched and double-hung windows; Stucco exterior; Preserve view; Zero lot line
Interior
- Kitchen: Electric cooktop; Dishwasher; Disposal; Microwave; Refrigerator/freezer; Pantry
- Bedrooms: 2 bedrooms
- Flooring: Vinyl
- Bathrooms: 2 full bathrooms; Master bath with dual sinks and a shower (no tub)
- Heating & cooling: Central electric heating; Central electric air conditioning
- Interior features: Built-in cabinets; Cable prewire; High-speed internet available; Pantry; Smoke detectors; Vaulted ceiling; Dining area in living room; Screened lanai/porch; Furnished; 4 ceiling fans; Split bedroom floor plan
- Laundry & utility: Washer/dryer hookup; Dryer
Neighborhood map
What this means for you Summary
Snapshot
- This is a 2-bed/2.0-bath condo listed at $300k.
Deal economics
- At list price, monthly cash flow is $241 ($3k/yr) — positive.
- The deal already cash-flows at list — no discount required.
- Meets the 1% rule at list price ($4k rent vs $300k).
- Recommended offer: $264k (12.0% below list) — sets the bar for market timing.
Location & tenants
- Location reads 64/100 on livability (#692 in FL) — a middle-class / working-renter tenant base. Strengths: crime A+, employment A+, housing B+; Watch: health & safety D, amenities F, commute F.
- Collier (suburban): math 60% / reading 56% proficiency, ranked #16 of 73 in FL (top 22%) — acceptable for families but not a draw, mixed tenant base, ~2y average lease.
- Zoned schools: Veterans Memorial Elementary School (math 78% / reading 79%, grade A, #141 of 2,144 statewide, top 7%, 743 students, 22% FRL); North Naples Middle School (math 79% / reading 73%, grade A, #34 of 571 statewide, top 6%, 903 students, 25% FRL); Gulf Coast High School (math 57% / reading 68%, grade B-, #93 of 667 statewide, top 14%, 2,447 students, 20% FRL) — zoned schools average 22% FRL vs 55% district-wide (33 pts lower); this property's tenant base skews higher-income than the district average.
- Zoned-school proficiency averages 72% at this address vs 58% district-wide (+14 pts) — the actual schools serving this property are materially stronger than the Collier average implies; a family-tenant draw the district grade alone would hide.
- Market conditions: Rents soft (-2.5%/yr); 590 active listings in the ZIP; 40 comparable units currently listed for rent nearby; rentals at typical pace (median 25d on market — plan ~3-4 weeks tenant-placement turnaround); high-income renter base; 3,520 units permitted in Collier County in 2024 (959 in 5+ unit buildings).
- This rent runs 37% of the median local income ($113k/yr) — at the standard rent-burdened threshold; future hikes will face affordability resistance.
Forward outlook
- Local home prices are declining (-3.0%/yr); year-one equity from $2k of loan paydown is wiped out by about $9k of value loss. Plan a longer hold.
- Collier County population projected at +30% by 2050 — long-run rental-demand tailwind backs the buy-and-hold thesis.
Negotiation context
- It's been on market 341 days — a 12% lower offer ($264k) is reasonable based on typical stale-listing flexibility.
- 9 sale attempts since 11y ago with the ask held roughly flat each time — persistent listings suggest the price (not the market) is what's stuck; bring a comps-based counter.
Risks & watch-outs
- Climate carrying-cost: severe wind risk, 99% chance of damaging wind over 30y; extreme-heat days projected 7→31/yr by 2055 (HVAC capex compounding) — expect insurance premiums to compound above CPI over the hold.
Questions for the listing agent
- It's been on market 341 days. Have you received any prior offers? Is the seller open to a 12% concession, seller financing, or rate buy-down credit?
- What does the HOA fee cover, when was the last increase, and are there any pending special assessments or reserve-fund shortfalls?
- Any open or pending special assessments — roof, HVAC, plumbing, elevator, façade? What's the per-unit balance and payoff schedule, and is the seller paying it off at close or rolling it to the buyer?
- Why hasn't it sold? Are there any deal-killer items the seller is aware of (foundation, flood, title, zoning, code violations)?
- Is there a deadline driving the sale (1031 exchange, divorce, estate, relocation)? That informs how much negotiation room exists.
- What's the average days-on-market for RENTAL listings here right now (not sales)? A rising rental-DOM trend means longer vacancies and softer asking-rent achievability than the comps imply.
- What's the recent tenant-quality profile in this submarket — average credit score on applications, eviction rate, late-payment / NSF rate, and stable-employment percentage? A property-management company in the area should have these aggregated.
- How much new apartment / multifamily construction is in the pipeline within 1–3 miles? Heavy new supply (>2% of stock underway) typically softens rents 12–24 months out; light construction supports rent growth.
Investment metrics
- 1% rule
- 1.17% ✓
- Cap rate
- 7.26%
- Cash-on-cash
- 3.45%
- DSCR
- 1.15
- GRM
- 7.1
CMA / ARV
No comps found within radius.
Projected returns pro-forma
-3.0% appreciation · 0.0% rent growth · sell at horizon
- IRR
- -14.9%
- Equity multiple
- 0.49×
- Total profit
- $-43,206
- Equity at exit
- $44,724
- IRR
- -13.9%
- Equity multiple
- 0.33×
- Total profit
- $-56,322
- Equity at exit
- $25,934
Cash invested: $83,986 (down + closing). Projections, not guarantees.
Landlord ↔ Tenant lean methodology
- Overall (STATE)
- 87 Strongly Landlord-Friendly
- State Florida
- 87 Strongly Landlord-Friendly · R+3
- County
- — inherits STATE
- City
- — inherits STATE
ZIP-level market 34119
- Rents YoY
- -2.5%
- Active inventory
- 590
- Price-to-rent
- 7.1×
Monthly cashflow live
- Estimated rent
- $3,522 high interval (Pro) →
- Mortgage (P&I)
- −$1,573
- Tax from tax record
- −$202 /mo · $2,420/yr
- Insurance
- −$125
- HOA
- −$641
- Vacancy / Maint / Mgmt
- −$740
- Net cashflow
- $241
Break-even live
Sensitivity live
| Price | -10% $411 | -5% $326 | +0% $241 | +5% $157 | +10% $72 |
|---|---|---|---|---|---|
| Rent | -10% $-37 | -5% $102 | +0% $241 | +5% $381 | +10% $520 |
| Rate | -1.0pp $393 | -0.5pp $318 | base $241 | +0.5pp $164 | +1.0pp $85 |
UW: 25.0% down · 7.5% · 30yr · 1.5% tax · 5.0% vac · 8.0% maint · 8.0% mgmt
Financing live
Cash to close
- Down payment
- $74,988
- Closing costs
- $8,998
- Reserves months
- —
- Total cash needed
- —
Loan-product check · same deal, 3 products live
Conventional
25% down · 7.5% · 30yr
- Down + closing
- —
- Monthly P&I
- —
- Monthly cashflow
- —
- DSCR
- —
- Eligible?
- —
Personal DTI + credit; lowest rate.
DSCR
20% down · 8.5% · 30yr
- Down + closing
- —
- Monthly P&I
- —
- Monthly cashflow
- —
- DSCR
- —
- Eligible?
- —
No personal income docs; deal must DSCR.
Hard money
10% down · 12.0% · 12mo
- Down + closing
- —
- Monthly P&I
- —
- Monthly cashflow
- —
- DSCR
- —
- Eligible?
- —
Short-term bridge; refi at stabilization.
Rent comps 40 comps
| Address | Beds | Baths | Sqft | Rent | $/sqft | DOM | Units | Dist |
|---|---|---|---|---|---|---|---|---|
| 2700 Cypress Trace Cir #3112 Naples, FL | 2.0 | 2.0 | 1232 | $2,100 | $1.70 | 25d | 1 | 0.06mi |
| 2690 Cypress Trace Cir #3212 Naples, FL | 2.0 | 2.0 | 1232 | $5,300 | $4.30 | 25d | 1 | 0.07mi |
| 2710 Cypress Trace Cir Naples, FL | 2.0 | 2.0 | 1213 | $3,425 | $2.82 | 25d | 2 | 0.09mi |
| 6670 Huntington Lakes Cir #103 Naples, FL | 2.0 | 2.0 | 1107 | $4,250 | $3.84 | 25d | 1 | 0.10mi |
| 6670 Huntington Lakes Cir #103 Naples, FL | 2.0 | 2.0 | 1107 | $4,000 | $3.61 | 15d | 1 | 0.10mi |
| 6605 Huntington Lakes Cir #203 Naples, FL | 2.0 | 2.0 | 1107 | $2,400 | $2.17 | 25d | 1 | 0.10mi |
| 2720 Cypress Trace Cir Naples, FL | 2.0–3.0 | 2.0 | 1283 | $2,100 | $1.64 | 25d | 3 | 0.12mi |
| 2925 Cypress Trace Cir #201 Naples, FL | 2.0 | 2.0 | 1094 | $4,500 | $4.11 | 25d | 1 | 0.16mi |
| 2870 Cypress Trace Cir #1713 Naples, FL | 2.0 | 2.0 | 1414 | $2,900 | $2.05 | 25d | 1 | 0.17mi |
| 2880 Cypress Trace Cir #103 Naples, FL | 2.0 | 2.0 | 1372 | $5,500 | $4.01 | 25d | 1 | 0.17mi |
| 6920 Huntington Lakes Cir #103 Naples, FL | 2.0 | 2.0 | 1107 | $2,700 | $2.44 | 25d | 1 | 0.19mi |
| 2895 Cypress Trace Cir #104 Naples, FL | 2.0 | 2.0 | 1252 | $4,800 | $3.83 | 25d | 1 | 0.21mi |
| 2895 Cypress Trace Cir #202 Naples, FL | 2.0 | 2.0 | 1232 | $4,500 | $3.65 | 25d | 1 | 0.21mi |
| 2820 Cypress Trace Cir Naples, FL | 2.0 | 2.0 | 1254 | $3,748 | $2.99 | 25d | 3 | 0.22mi |
| 2855 Cypress Trace Cir #102 Naples, FL | 2.0 | 2.0 | 1232 | $2,000 | $1.62 | 15d | 1 | 0.22mi |
| 2855 Cypress Trace Cir #202 Naples, FL | 2.0 | 2.0 | 1232 | $4,800 | $3.90 | 15d | 1 | 0.22mi |
| 2730 Cypress Trace Cir Unit 2836S Naples, FL | 2.0 | 2.0 | 1194 | $5,000 | $4.19 | 25d | 1 | 0.23mi |
| 2730 Cypress Trace Cir Unit 2836A Naples, FL | 2.0 | 2.0 | 1194 | $2,000 | $1.68 | 25d | 1 | 0.23mi |
| 2730 Cypress Trace Cir Unit 1 Naples, FL | 2.0 | 2.0 | 1232 | $5,500 | $4.46 | 25d | 1 | 0.23mi |
| 6750 Huntington Lakes Cir #103 Naples, FL | 2.0 | 2.0 | 1185 | $2,300 | $1.94 | 22d | 1 | 0.24mi |
| 2835 Cypress Trace Cir Unit 1049710P Naples, FL | 3.0 | 2.0 | 1248 | $4,110 | $3.29 | 15d | 1 | 0.24mi |
| 2740 Cypress Trace Cir Naples, FL | 2.0 | 2.0 | 1493 | $3,488 | $2.34 | 25d | 3 | 0.26mi |
| 6880 Huntington Lakes Cir #203 Naples, FL | 2.0 | 2.0 | 1231 | $3,750 | $3.05 | 25d | 1 | 0.27mi |
| 2790 Cypress Trace Cir Naples, FL | 2.0 | 2.0 | 1537 | $5,000 | $3.25 | 25d | 2 | 0.31mi |
| 2469 Millcreek Ln #102 Naples, FL | 2.0 | 2.0 | 1107 | $3,495 | $3.16 | 25d | 1 | 0.32mi |
| 6655 Huntington Lakes Cir #204 Naples, FL | 3.0 | 2.0 | 1315 | $3,500 | $2.66 | 25d | 1 | 0.34mi |
| 2456 Millcreek Ln #102 Naples, FL | 2.0 | 2.0 | 1107 | $2,375 | $2.15 | 25d | 1 | 0.37mi |
| 2408 Millcreek Ln #202 Naples, FL | 2.0 | 2.0 | 1207 | $2,200 | $1.82 | 25d | 1 | 0.38mi |
| 6544 Huntington Lakes Cir Unit 9-204 Naples, FL | 3.0 | 2.0 | 1382 | $4,250 | $3.08 | 25d | 1 | 0.40mi |
| 5693 Heron Ln #502 Naples, FL | 2.0 | 2.0 | 1490 | $6,800 | $4.56 | 25d | 1 | 0.47mi |
| 5045 Cedar Springs Dr #103 Naples, FL | 2.0 | 2.0 | 1202 | $5,000 | $4.16 | 25d | 1 | 0.95mi |
| 5045 Cedar Springs Dr #203 Naples, FL | 2.0 | 2.0 | 1427 | $4,200 | $2.94 | 25d | 1 | 0.95mi |
| 5025 Cedar Springs Dr #102 Naples, FL | 2.0 | 2.0 | 1202 | $1,590 | $1.32 | 15d | 1 | 0.95mi |
| 5025 Cedar Springs Dr #102 Naples, FL | 2.0 | 2.5 | 1202 | $3,510 | $2.92 | 25d | 1 | 0.95mi |
| 5455 Worthington Ln #202 Naples, FL | 2.0 | 2.0 | 1427 | $3,900 | $2.73 | 25d | 1 | 0.95mi |
| 5455 Worthington Ln #103 Naples, FL | 2.0 | 2.0 | 1202 | $5,000 | $4.16 | 25d | 1 | 0.95mi |
| 4970 Deerfield Way Unit F-203 Naples, FL | 2.0 | 2.0 | 1388 | $1,990 | $1.43 | 15d | 1 | 0.98mi |
| 4910 Deerfield Way Unit A-203 Naples, FL | 2.0 | 2.0 | 1388 | $5,500 | $3.96 | 15d | 1 | 0.99mi |
| 4910 Deerfield Way #103 Naples, FL | 2.0 | 2.0 | 1200 | $4,800 | $4.00 | 22d | 1 | 0.99mi |
| 4960 Deerfield Way Unit E102 Naples, FL | 2.0 | 2.0 | 1202 | $4,250 | $3.54 | 15d | 1 | 1.01mi |
HOA detail condo
- Monthly dues
- $641 · $7,692/yr
- Likely covers
- landscapingpool
- Assessments
- None detected in remarks — confirm with the listing agent.
Listing history 33 events
-
2026-05-31days on market $299,950 Active 341 DOM
-
2026-05-30days on market $299,950 Active 340 DOM
-
2025-08-19price $299,950
-
2025-06-24$308,900 Active
-
2025-05-16historical
-
2025-03-29price $309,900
-
2025-03-03status Active
-
2025-02-28historical
-
2025-01-10price $319,900
-
2024-10-25price $329,900
-
2024-10-16status Active
-
2024-09-23status Pending
-
2024-07-08price $339,900
-
2024-05-13price $349,900
-
2024-05-02$359,900 Active
-
2024-04-23historical
-
2024-01-11$380,000 Active
-
2023-12-31historical
-
2023-11-22price $382,500
-
2023-09-27price $387,500
-
2023-08-14price $392,500
-
2023-07-11$397,500 Active
-
2022-03-05soldstatus $325,000
-
2022-03-01soldstatus $325,000 Sold
-
2022-02-02status Pending
-
2022-01-08status Pending With Contingencies
-
2022-01-06status Active
-
2022-01-03status Pending With Contingencies
-
2021-12-30$324,900 Active
-
2015-05-14$285,000
-
2007-01-15historical
-
2005-03-04soldstatus $222,500
-
2005-02-25soldstatus $185,000
ⓘ Source: listings_history table (triggers on properties + properties_extension) + one-shot
backfill from property_details.listing_events for pre-trigger history.
Tax reassessment forecast FL · Resets to sale price
- Current annual tax
- $2,420 · $202/mo
- Projected year-2 tax
- $2,490 · $207/mo
- Expected delta
- +$69/yr (+$6/mo · 2.9%)
ⓘ Screening estimate from a state-policy table — verify with the county assessor before closing.
Climate risk First Street
- Flood 1/10 Low FEMA zone X (unshaded) · 0% chance over 30 yrs
- Wildfire 1/10 Low
- Heat 10/10 Extreme 7 d/yr ≥108°F today · 31 d/yr by 30 yrs out
- Wind 10/10 Extreme 99% chance of damaging wind over 30 yrs
- Air quality 2/10 Low 2 unhealthy d/yr today · 2 by 30 yrs out
Nearby sold comps map
Loading sold comps map…
Walkable amenities ~0.75 mi
Loading nearby amenities…
Taxation est. · year 1
- Rental income
- $42,260
- − Mortgage interest
- −$16,802
- − Property taxes
- −$2,420
- − Insurance
- −$1,500
- − Repairs & maintenance
- −$3,381
- − Management
- −$3,381
- − HOA
- −$7,692
- − Depreciation
- −$8,726
- Taxable loss
- −$1,642
- Est. tax savings @ 24.0%
- +$394
- After-tax cash flow
- $3,291/yr
For passive investors: Depreciation is non-cash, so a rental often shows a tax loss while cash-flowing — sheltering income. Rental losses are passive: they offset passive income freely, and up to $25,000/yr can offset ordinary (W-2) income if you actively participate and your MAGI is under $100k (phasing out to $0 by $150k); unused losses carry forward. On sale, claimed depreciation is recaptured at up to 25%, and gains may owe capital-gains tax (a 1031 exchange can defer both). Figures are a year-1 estimate at your 24.0% rate — not tax advice; consult a CPA.
Schools (NCES district)
- District
- Collier
- NCES district ID
- 1200330
- Math proficiency
- 60% ▼ -4.00%
- Reading proficiency
- 56% ▼ -2.00%
- Median HH income
- $58,275
- Composite
- 50.23/100
- National rank
- #1892
- State rank
- #16 of 73 in FL
Livability — Island Walk
- Score
- 64/100
- State rank
- #692
- US rank
- #14444
Category grades
Schools grade is shown separately in the Schools card above.
Census & demographics
- County
- Collier County · 396,295 people
- Metro
- Naples-Marco Island, FL
- Population (ZIP)
- 36,807
- Household income
- $113,391
- Rent vs Own
- Severe rent burden
- 741.0
Population outlook (Collier County) Hauer SSP2
- Today (2025)
- 420,858 people
- By 2030
- 450,054 · +6.9%
- By 2040
- 502,232 · +19.3%
- By 2050
- 544,932 · +29.5%
- By 2075
- 627,203 · +49.0%
- By 2100
- 659,015 · +56.6%
Race, ethnicity, and origin ACS 2023
- Neighborhood character
- Predominantly White (74%)
- Race & ethnicity
- White 74% Hispanic / Latino 20% Two or more races 14% Black 1%
- Hispanic origin (detail)
- Mexican 6% Puerto Rican 2% Cuban 4% Dominican 2%
- Common ancestry
- Romanian 4% Lithuanian 2% Italian 2%
- Foreign-born
- 17% · Canada, Jamaica, Dominican Republic
- Languages at home
- 78% English-only · Spanish 15% Other Indo-European 3% Russian/Polish/Slavic 1%
Political lean MEDSL · Collier
- 2024 margin
- Solid R (+33.1) · D 33.1% · R 66.2%
- 2008→2024 swing
- -10.6pp toward R · 2008: -22.5pp · 2024: -33.1pp
- All cycles
- 2024: R+33.1 2020: R+24.7 2016: R+26.0 2012: R+30.1 2008: R+22.5
Not yet ingested
- Civics
- —
Market trends
- HPI YoY
- ▼ -243.12%
- Current HPI
- 269.3208
- Rent YoY
- ▼ -2.51%
- Metro
- Naples-Marco Island, FL
- State GDP YoY
- ▲ 3.28%
- F500 in state
- 36
Industry mix (Fortune 500 HQ in FL)
| Industry | F500 HQs | Revenue |
|---|---|---|
| Industrial Technology | 2 | $29B |
|
||
| Insurance | 2 | $17B |
|
||
| Retail | 1 | $60B |
|
||
| Technology Distribution | 1 | $58B |
|
||
| Homebuilding | 1 | $35B |
|
||
| Technology Manufacturing | 1 | $35B |
|
||
Price history
+62.1% since first listed31 events — show timeline
- 2025-08-19 Price Changed $299,950 NAPLESMLS
- 2025-06-24 Listed $308,900 NAPLESMLS
- 2025-05-16 Listing Removed — NAPLESMLS
- 2025-03-29 Price Changed $309,900 NAPLESMLS
- 2025-03-03 Relisted — NAPLESMLS
- 2025-02-28 Listing Removed — NAPLESMLS
- 2025-01-10 Price Changed $319,900 NAPLESMLS
- 2024-10-25 Price Changed $329,900 NAPLESMLS
- 2024-10-16 Relisted — NAPLESMLS
- 2024-09-23 Pending — NAPLESMLS
- 2024-07-08 Price Changed $339,900 NAPLESMLS
- 2024-05-13 Price Changed $349,900 NAPLESMLS
- 2024-05-02 Listed $359,900 NAPLESMLS
- 2024-04-23 Listing Removed — NAPLESMLS
- 2024-01-11 Listed $380,000 NAPLESMLS
- 2023-12-31 Listing Removed — NAPLESMLS
- 2023-11-22 Price Changed $382,500 NAPLESMLS
- 2023-09-27 Price Changed $387,500 NAPLESMLS
- 2023-08-14 Price Changed $392,500 NAPLESMLS
- 2023-07-11 Listed $397,500 NAPLESMLS
- 2022-03-05 Sold (Public Records) $325,000 Public Records
- 2022-03-01 Sold (MLS) $325,000 NAPLESMLS
- 2022-02-02 Pending — NAPLESMLS
- 2022-01-08 Pending — NAPLESMLS
- 2022-01-06 Relisted — NAPLESMLS
- 2022-01-03 Pending — NAPLESMLS
- 2021-12-30 Listed $324,900 NAPLESMLS
- 2015-05-14 Listed $285,000 FORTMLS
- 2007-01-15 Listing Removed — FORTMLS
- 2005-03-04 Sold (Public Records) $222,500 Public Records
- 2005-02-25 Sold (Public Records) $185,000 Public Records
Property tax history
+7.1%/yrLatest (2025): $2,420 · -0.7% YoY. Source: county tax records.
Cash-flow waterfall
monthlySold comps — $/sqft
last 12 mo · ≤1 miLoading sold comps…