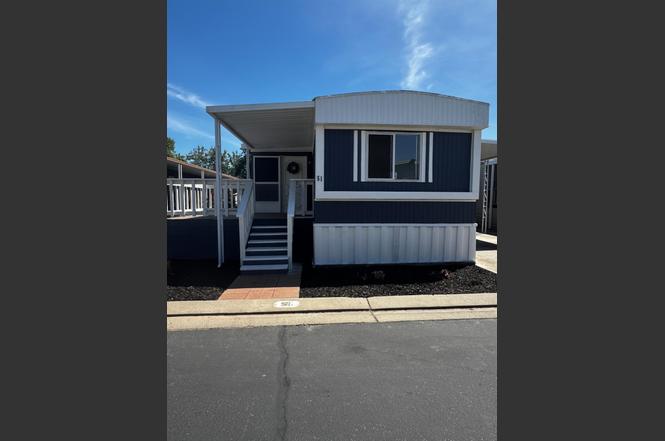
1200 S Carpenter Rd #51 · Modesto, CA
Flood risk 1/10 · Minimal
- FEMA flood zone
- X (unshaded)
- Chance of flooding over 30 yrs
- 0.0%
- Est. flood insurance / yr
- $507 – $1,088
Fire risk 6/10 · Moderate
- Est. fire insurance / yr
- $659 – $1,223
Heat risk 6/10 · Moderate
- Hot days now (above 102°F)
- 7 days/yr
- Hot days in 30 yrs
- 15 days/yr
Wind risk 1/10 · Minimal
- Chance of severe wind over 30 yrs
- —
Air-quality risk 10/10 · Severe
- Unhealthy air days now
- 33 days/yr
- Unhealthy air days in 30 yrs
- 38 days/yr
Risk factors via First Street. Map © Google.
Why this score? — see what drove the B- grade
The composite is a weighted blend of 9 inputs, each scored 0–100. Each bar is that input's sub-score; the figure is the points it added to the 100-point composite (weight × sub-score).
- Cash flow +30.0/30.0
- 1% rule +10.0/10.0
- DSCR +10.0/10.0
- ARV discount +7.5/15.0
- Livability +3.2/5.0
- Rent growth +2.5/5.0
- Condition / age +2.5/5.0
- Schools +1.7/10.0
- Appreciation +0.0/10.0
$50,000
🖨 Deal sheet 📄 Offer letter ✓ Due diligence
Listing remarks
* * Charming Senior Living Retreat - Recently Remodeled Mobile Home * * Discover easy living in this beautifully remodeled 2-bedroom, 1-bath mobile home located in a secure, gated senior community. This inviting residence offers a modern, refreshed interior featuring updated flooring, contemporary finishes, and ample natural light. The open-concept living area flows seamlessly into the well-appointed kitchen, perfect for casual dining or entertaining. Nestled in a prime location within the community, you'll enjoy easy access to amenities, including a sparkling pool ideal for relaxing and socializing. Experience the comfort of a welcoming, close-knit neighborhood while being convenient
Key facts
- Natural light
- Updated flooring
- Parking
Tags
Property features AI
Finance
- Financial info: Land lease: No (land lease amount field present but property marked No)
- HOA & community: No homeowners association; Senior community
Exterior
- Parking: Deck (used as parking feature)
- Utilities: Public water; Sewer: other; Individual electric meter; Master gas meter; 220V in kitchen
- Home design: Manufactured in park; Single wide; Built in 1981
- Construction: Metal skirting
- Exterior features: Garden; Deck
Interior
- Kitchen: Laminate countertops; Breakfast area
- Bedrooms: 2 bedrooms
- Flooring: Other flooring
- Bathrooms: 1 full bathroom; Tile bath; Tub; Tub with shower over
- Heating & cooling: Central heating; Central air; Ceiling fan(s); Wall unit(s)
- Interior features: Breakfast nook; Breakfast area; Laminate countertops; Living room with unspecified other feature
- Laundry & utility: Electric laundry; 220V in laundry
Neighborhood map
What this means for you Summary
Snapshot
- This is a 2-bed/1.0-bath manufactured listed at $50k.
Deal economics
- At list price, monthly cash flow is $801 ($10k/yr) — positive.
- The deal already cash-flows at list — no discount required.
- Meets the 1% rule at list price ($1k rent vs $50k).
- Recommended offer: $44k (12.0% below list) — sets the bar for market timing.
- Cap rate 25.5% vs local median 3.2% in Modesto — top-decile yield for the area; either an underpriced asset or a hidden risk that comps aren't pricing in. Stress-test before assuming the spread holds.
Location & tenants
- Location reads 63/100 on livability (#451 in CA) — a middle-class / working-renter tenant base. Strengths: housing A+; Watch: amenities C-, schools D+, health & safety D+.
- Modesto City Elementary (urban): math 15% / reading 26% proficiency, ranked #462 of 517 in CA (top 89%) — low school quality limits family demand, transient renter base, plan for 1-2y turnover; 77% free/reduced lunch — lower-income household profile, screen leases tightly.
- Market conditions: 109 active listings in the ZIP; 1 comparable units currently listed for rent nearby; 923 units permitted in Stanislaus County in 2024 (63 in 5+ unit buildings).
Forward outlook
- Local home prices are declining (-3.0%/yr); year-one equity from $346 of loan paydown is wiped out by about $2k of value loss. Plan a longer hold.
- Stanislaus County population projected at +14% by 2050 — modest demand growth; plan on rents tracking national, not racing it.
- At projected returns (-3.0% appreciation + 3.0% rent growth), your $14k cash investment doubles in ~2 years — after that, you're playing with house money.
Negotiation context
- It's been on market 302 days — a 12% lower offer ($44k) is reasonable based on typical stale-listing flexibility.
Risks & watch-outs
- Climate carrying-cost: major wildfire risk; extreme-heat days projected 7→15/yr by 2055 (HVAC capex compounding) — expect insurance premiums to compound above CPI over the hold.
Questions for the listing agent
- It's been on market 302 days. Have you received any prior offers? Is the seller open to a 12% concession, seller financing, or rate buy-down credit?
- Why hasn't it sold? Are there any deal-killer items the seller is aware of (foundation, flood, title, zoning, code violations)?
- Is there a deadline driving the sale (1031 exchange, divorce, estate, relocation)? That informs how much negotiation room exists.
- Schools are D-rated, which usually means shorter tenancies and higher turnover. Who's the typical renter profile here, and what's been the actual vacancy rate?
- Crime grade is F in this area — have there been break-ins, vandalism, or insurance claims at this property in the last 3 years? What carrier currently insures it and at what premium?
- What's the average days-on-market for RENTAL listings here right now (not sales)? A rising rental-DOM trend means longer vacancies and softer asking-rent achievability than the comps imply.
- What's the recent tenant-quality profile in this submarket — average credit score on applications, eviction rate, late-payment / NSF rate, and stable-employment percentage? A property-management company in the area should have these aggregated.
- How much new for-sale + rental construction is in the pipeline within 1–3 miles? Heavy new supply typically softens prices + rents 12–24 months out; constrained supply supports both.
Investment metrics
- 1% rule
- 2.90% ✓
- Cap rate
- 25.52%
- Cash-on-cash
- 68.67%
- DSCR
- 4.06
- GRM
- 2.9
CMA / ARV
No comps found within radius.
Projected returns pro-forma
-3.0% appreciation · 3.0% rent growth · sell at horizon
- IRR
- 68.1%
- Equity multiple
- 4.07×
- Total profit
- $42,947
- Equity at exit
- $7,455
- IRR
- 72.3%
- Equity multiple
- 8.37×
- Total profit
- $103,193
- Equity at exit
- $4,323
Cash invested: $14,000 (down + closing). Projections, not guarantees.
Landlord ↔ Tenant lean methodology
- Overall (STATE)
- 18 Strongly Tenant-Friendly
- State California
- 18 Strongly Tenant-Friendly · D+13
- County
- — inherits STATE
- City
- — inherits STATE
ZIP-level market 95351
- Active inventory
- 109
- Price-to-rent
- 2.9×
Monthly cashflow live
- Estimated rent
- $1,452 medium interval (Pro) →
- Mortgage (P&I)
- −$262
- Tax est. 1.5%
- −$62 /mo · $750/yr
- Insurance
- −$21
- HOA
- −$0
- Vacancy / Maint / Mgmt
- −$305
- Net cashflow
- $801
Break-even live
UW: 25.0% down · 7.5% · 30yr · 1.5% tax · 5.0% vac · 8.0% maint · 8.0% mgmt
Financing live
Cash to close
- Down payment
- $12,500
- Closing costs
- $1,500
- Reserves months
- —
- Total cash needed
- —
Loan-product check · same deal, 3 products live
Conventional
25% down · 7.5% · 30yr
- Down + closing
- —
- Monthly P&I
- —
- Monthly cashflow
- —
- DSCR
- —
- Eligible?
- —
Personal DTI + credit; lowest rate.
DSCR
20% down · 8.5% · 30yr
- Down + closing
- —
- Monthly P&I
- —
- Monthly cashflow
- —
- DSCR
- —
- Eligible?
- —
No personal income docs; deal must DSCR.
Hard money
10% down · 12.0% · 12mo
- Down + closing
- —
- Monthly P&I
- —
- Monthly cashflow
- —
- DSCR
- —
- Eligible?
- —
Short-term bridge; refi at stabilization.
Rent comps 1 comps
| Address | Beds | Baths | Sqft | Rent | $/sqft | DOM | Units | Dist |
|---|---|---|---|---|---|---|---|---|
| 814 2nd St Unit 2 Modesto, CA | 2.0 | 1.0 | 700 | $1,350 | $1.93 | 21d | 1 | 1.26mi |
Listing history 10 events
-
2026-06-18days on market $50,000 Active 302 DOM
-
2026-06-17days on market $50,000 Active 301 DOM
-
2026-06-16days on market $50,000 Active 300 DOM
-
2026-06-15days on market $50,000 Active 299 DOM
-
2026-06-14days on market $50,000 Active 297 DOM
-
2026-06-13statusdays on market $50,000 Active 296 DOM
-
2026-06-02status $50,000 Pending 294 DOM
-
2026-06-01days on market $50,000 Active 294 DOM
-
2026-05-31days on market $50,000 Active 293 DOM
-
2026-05-30days on market $50,000 Active 292 DOM
ⓘ Source: listings_history table (triggers on properties + properties_extension) + one-shot
backfill from property_details.listing_events for pre-trigger history.
Climate risk First Street
- Flood 1/10 Low FEMA zone X (unshaded) · 0% chance over 30 yrs
- Wildfire 6/10 Major
- Heat 6/10 Major 7 d/yr ≥102°F today · 15 d/yr by 30 yrs out
- Wind 1/10 Low
- Air quality 10/10 Extreme 33 unhealthy d/yr today · 38 by 30 yrs out
Nearby sold comps map
Loading sold comps map…
Walkable amenities ~0.75 mi
Loading nearby amenities…
Taxation est. · year 1
- Rental income
- $17,418
- − Mortgage interest
- −$2,801
- − Property taxes
- −$750
- − Insurance
- −$250
- − Repairs & maintenance
- −$1,393
- − Management
- −$1,393
- − Depreciation
- −$1,455
- Taxable income
- $9,376
- Est. tax owed @ 24.0%
- −$2,250
- After-tax cash flow
- $7,364/yr
For passive investors: Depreciation is non-cash, so a rental often shows a tax loss while cash-flowing — sheltering income. Rental losses are passive: they offset passive income freely, and up to $25,000/yr can offset ordinary (W-2) income if you actively participate and your MAGI is under $100k (phasing out to $0 by $150k); unused losses carry forward. On sale, claimed depreciation is recaptured at up to 25%, and gains may owe capital-gains tax (a 1031 exchange can defer both). Figures are a year-1 estimate at your 24.0% rate — not tax advice; consult a CPA.
Schools (NCES district)
- District
- Modesto City Elementary
- NCES district ID
- 0625130
- Math proficiency
- 15% ▼ -7.00%
- Reading proficiency
- 26% ▼ -5.00%
- Median HH income
- $39,725
- Composite
- 17.31/100
- National rank
- #9083
- State rank
- #462 of 517 in CA
Livability — Modesto
- Score
- 63/100
- State rank
- #451
- US rank
- #15229
Category grades
Schools grade is shown separately in the Schools card above.
Census & demographics
- Census place
- Modesto, CA
- County
- Stanislaus County · 445,786 people
- City population
- 225,261
- Metro
- Modesto, CA
- Population (ZIP)
- 48,498
- Household income
- $58,275
- Rent vs Own
- Severe rent burden
- 1964.0
Population outlook (Stanislaus County) Hauer SSP2
- Today (2025)
- 579,493 people
- By 2030
- 598,000 · +3.2%
- By 2040
- 630,930 · +8.9%
- By 2050
- 658,300 · +13.6%
- By 2075
- 712,363 · +22.9%
- By 2100
- 719,805 · +24.2%
Race, ethnicity, and origin ACS 2023
- Neighborhood character
- Predominantly Hispanic (76%)
- Race & ethnicity
- Hispanic / Latino 76% Two or more races 40% White 13% Asian 5% Black 3% Native American 2%
- Hispanic origin (detail)
- Mexican 72%
- Common ancestry
- Russian 1% Lithuanian 1% Slovak 1%
- Foreign-born
- 30% · Canada
- Languages at home
- 34% English-only · Spanish 62% Other Asian/Pacific 2% Other Indo-European 1%
Political lean MEDSL · Stanislaus
- 2024 margin
- R (+11.0) · D 43.2% · R 54.2% · Other 2.6%
- 2008→2024 swing
- -12.7pp toward R · 2008: 1.7pp · 2024: -11.0pp
- All cycles
- 2024: R+11.0 2020: D+0.8 2016: D+0.6 2012: D+0.7 2008: D+1.7
Not yet ingested
- Civics
- —
Market trends
- HPI YoY
- ▼ -405.77%
- Current HPI
- 360.246
- Rent YoY
- —
- Metro
- Modesto, CA
- State GDP YoY
- ▲ 3.21%
- F500 in state
- 116
Industry mix (Fortune 500 HQ in CA)
| Industry | F500 HQs | Revenue |
|---|---|---|
| Technology | 27 | $1,492B |
|
||
| Financial Services | 3 | $174B |
|
||
| Retail | 3 | $44B |
|
||
| Insurance | 3 | $26B |
|
||
| Media / Entertainment | 2 | $115B |
|
||
| Pharmaceuticals / Biotech | 2 | $62B |
|
||
Cash-flow waterfall
monthlySold comps — $/sqft
last 12 mo · ≤1 miLoading sold comps…