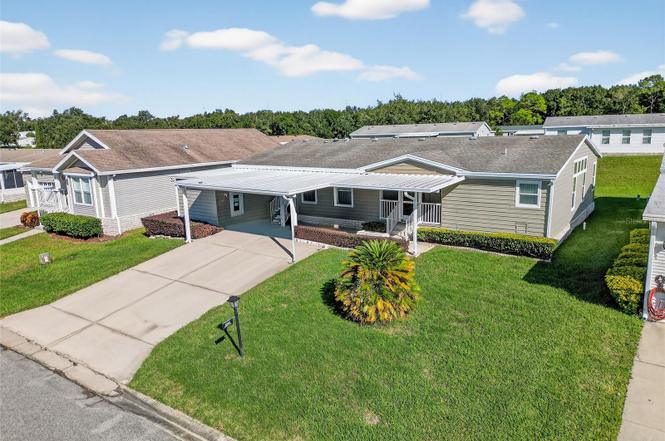
4017 Myrtle Oak Ct #841 · Zellwood, FL
Flood risk 1/10 · Minimal
- FEMA flood zone
- X (unshaded)
- Chance of flooding over 30 yrs
- 0.0%
- Est. flood insurance / yr
- $507 – $1,088
Fire risk 5/10 · Moderate
- Est. fire insurance / yr
- $947 – $1,759
Heat risk 8/10 · Major
- Hot days now (above 108°F)
- 7 days/yr
- Hot days in 30 yrs
- 22 days/yr
Wind risk 9/10 · Severe
- Chance of severe wind over 30 yrs
- 99.0%
Air-quality risk 1/10 · Minimal
- Unhealthy air days now
- 0 days/yr
- Unhealthy air days in 30 yrs
- 0 days/yr
Risk factors via First Street. Map © Google.
Why this score? — see what drove the C grade
The composite is a weighted blend of 9 inputs, each scored 0–100. Each bar is that input's sub-score; the figure is the points it added to the 100-point composite (weight × sub-score).
- Cash flow +18.6/30.0
- ARV discount +7.5/15.0
- 1% rule +6.4/10.0
- Appreciation +6.3/10.0
- DSCR +5.8/10.0
- Schools +4.1/10.0
- Livability +3.8/5.0
- Rent growth +2.5/5.0
- Condition / age +2.5/5.0
$224,900
🖨 Deal sheet 📄 Offer letter ✓ Due diligence
Listing remarks
Under contract-accepting backup offers. This Gorgeous Executive 4 Bedroom/3 Full Bath Home has a BONUS ROOM (COULD BE AN DEN/OFFICE) 2260 sq. ft. Open Floor Plan * Vaulted Ceilings * PET FRIENDLY * MANY UPGRADES. Optimal Entertaining Home with views from Extra Large Chef's Kitchen into Oversized Formal Living and Dining Rooms then onto ONE of the Screened Porches. Split Plan. Primary Bedroom is Huge with Setting Area plus Primary EnSuite has Double vanity, modern soaker tub AND separate walk in shower. Closets and Cabinet Storage Galore! Second Bedrooms on the other side of the home with access to FULL private bathroom. TWO MORE Bedrooms up front with another Full bath plus Another Bonus
Key facts
- Double vanity
- Open floor plan
- Screened back porch
Tags
Property features AI
Finance
- Other: Lease restrictions apply
- Financial info: Total annual association fees approximately $4,980
- HOA & community: Monthly HOA fee of $415; Association requires approval and fees are required; Association amenities include clubhouse, fitness center, pool, spa/hot tub, tennis and pickleball courts, shuffleboard, trails, storage, gated entry, vehicle restrictions, cable TV, internet, management, private road maintenance, recreational facilities, and trash service; Community features: clubhouse, community mailbox, deed restrictions, fitness center, golf (golf carts allowed), pool, tennis courts, and other community restrictions; Senior community; Pets allowed with restrictions (cats OK, dogs OK, breed and number limits)
Exterior
- Parking: Carport with 2 covered spaces
- Security: Gated community with 24-hour guard (community amenity); Security services included in association
- Utilities: Public water; Public sewer; Electricity available and connected; Cable available; High-speed internet/BB & HS internet available; Fiber optics available; Underground utilities; Water and sewer connected
- Home design: Manufactured double-wide home; Single-story; Faces east; Completed/ready condition; Crawlspace foundation
- Construction: Vinyl siding; Shingle roof; Crawlspace foundation; Built as a double-wide manufactured home
- Exterior features: Covered front and rear porches, including a screened porch; Rain gutters; On-site storage; Tennis court(s) on property or in community; Located on a cul-de-sac; Near golf course; Paved (asphalt) roads; Private maintained road
Interior
- Kitchen: Built-in oven; Cooktop; Range; Dishwasher; Disposal; Refrigerator
- Bedrooms: 4 bedrooms
- Flooring: Carpet; Ceramic tile
- Bathrooms: 3 full bathrooms
- Heating & cooling: Central heating (electric); Central air conditioning
- Interior features: Ceiling fans; High ceilings; Formal dining; Open floor plan; Split bedroom layout; Vaulted ceilings; Walk-in closets; Window treatments
- Laundry & utility: Laundry room with washer and electric dryer hookups
Neighborhood map
What this means for you Summary
Snapshot
- This is a 3-bed/2.0-bath manufactured listed at $225k.
Deal economics
- At list price, monthly cash flow is $216 ($3k/yr) — positive.
- The deal already cash-flows at list — no discount required.
- Meets the 1% rule at list price ($3k rent vs $225k).
- Recommended offer: $218k (3.0% below list) — sets the bar for market timing.
Location & tenants
- Location reads 75/100 on livability (#248 in FL, #3,918 nationally) — a middle-class / working-renter tenant base. Strengths: crime A+, cost of living A+, housing A+; Watch: schools D+, amenities F, commute D-.
- Orange (suburban): math 46% / reading 51% proficiency, ranked #43 of 73 in FL (top 59%) — families likely to look elsewhere, expect single-tenant / working-renter base with shorter leases.
- Market conditions: 103 active listings in the ZIP; 3 comparable units currently listed for rent nearby; rentals at typical pace (median 22d on market — plan ~3-4 weeks tenant-placement turnaround); 8,053 units permitted in Orange County in 2024 (3,133 in 5+ unit buildings).
Forward outlook
- In year one you build about $7k of equity ($2k loan paydown + $6k appreciation (2.5% local appreciation)).
- Orange County population projected at +52% by 2050 — long-run rental-demand tailwind backs the buy-and-hold thesis.
- At projected returns (2.5% appreciation + 3.0% rent growth), your $63k cash investment doubles in ~6 years — after that, you're playing with house money.
- By year 5, paydown + projected appreciation supports a ~$31k cash-out refi (75% LTV) — recoverable capital for the next deal without selling this one.
Negotiation context
- It's been on market 31 days — a 3% lower offer ($218k) is reasonable based on typical stale-listing flexibility.
- 2 sale attempts; this cycle's ask has dropped $20k (8%) from the opening price — seller is motivated, your offer sets the floor, not the list.
- Current owner paid $21k; list at $225k implies a 981% gain — meaningful room to come down on a strong offer.
Risks & watch-outs
- Climate carrying-cost: severe wind risk, 99% chance of damaging wind over 30y; moderate wildfire risk; extreme-heat days projected 7→22/yr by 2055 (HVAC capex compounding) — expect insurance premiums to compound above CPI over the hold.
Questions for the listing agent
- It's been on market 31 days. Have you received any prior offers? Is the seller open to a 3% concession, seller financing, or rate buy-down credit?
- What does the HOA fee cover, when was the last increase, and are there any pending special assessments or reserve-fund shortfalls?
- Is there a deadline driving the sale (1031 exchange, divorce, estate, relocation)? That informs how much negotiation room exists.
- Schools are D-rated, which usually means shorter tenancies and higher turnover. Who's the typical renter profile here, and what's been the actual vacancy rate?
- What's the average days-on-market for RENTAL listings here right now (not sales)? A rising rental-DOM trend means longer vacancies and softer asking-rent achievability than the comps imply.
- What's the recent tenant-quality profile in this submarket — average credit score on applications, eviction rate, late-payment / NSF rate, and stable-employment percentage? A property-management company in the area should have these aggregated.
- How much new for-sale + rental construction is in the pipeline within 1–3 miles? Heavy new supply typically softens prices + rents 12–24 months out; constrained supply supports both.
Investment metrics
- 1% rule
- 1.14% ✓
- Cap rate
- 7.45%
- Cash-on-cash
- 4.12%
- DSCR
- 1.18
- GRM
- 7.3
CMA / ARV
- ARV (on-the-fly)
- $85,880
- Comps found
- 1
Show comp detail 1 sale within ~0.75 mi
| Address | Dist | Beds/Ba | Sqft | Sold | Price | $/sf | Match |
|---|---|---|---|---|---|---|---|
| 2057 Live Oak Ln #3 | 0.74mi | 2/2.0 (-1) | 1,956 (-14%) | 13mo | $75,000 | $38 | 28 |
Match score weights: distance 35% · size 25% · config 20% · recency 20%. Top-matched comps best support the ARV.
Projected returns pro-forma
2.5% appreciation · 3.0% rent growth · sell at horizon
- IRR
- 10.0%
- Equity multiple
- 1.56×
- Total profit
- $35,189
- Equity at exit
- $94,886
- IRR
- 12.7%
- Equity multiple
- 2.81×
- Total profit
- $113,710
- Equity at exit
- $141,554
Cash invested: $62,972 (down + closing). Projections, not guarantees.
Landlord ↔ Tenant lean methodology
- Overall (STATE)
- 87 Strongly Landlord-Friendly
- State Florida
- 87 Strongly Landlord-Friendly · R+3
- County
- — inherits STATE
- City
- — inherits STATE
ZIP-level market 32798
- Home prices YoY
- 1.0%
- Active inventory
- 103
- Price-to-rent
- 7.3×
Monthly cashflow live
- Estimated rent
- $2,554 medium interval (Pro) →
- Mortgage (P&I)
- −$1,179
- Tax from tax record
- −$113 /mo · $1,357/yr
- Insurance
- −$94
- HOA
- −$415
- Vacancy / Maint / Mgmt
- −$536
- Net cashflow
- $216
Break-even live
UW: 25.0% down · 7.5% · 30yr · 1.5% tax · 5.0% vac · 8.0% maint · 8.0% mgmt
Financing live
Cash to close
- Down payment
- $56,225
- Closing costs
- $6,747
- Reserves months
- —
- Total cash needed
- —
Loan-product check · same deal, 3 products live
Conventional
25% down · 7.5% · 30yr
- Down + closing
- —
- Monthly P&I
- —
- Monthly cashflow
- —
- DSCR
- —
- Eligible?
- —
Personal DTI + credit; lowest rate.
DSCR
20% down · 8.5% · 30yr
- Down + closing
- —
- Monthly P&I
- —
- Monthly cashflow
- —
- DSCR
- —
- Eligible?
- —
No personal income docs; deal must DSCR.
Hard money
10% down · 12.0% · 12mo
- Down + closing
- —
- Monthly P&I
- —
- Monthly cashflow
- —
- DSCR
- —
- Eligible?
- —
Short-term bridge; refi at stabilization.
Rent comps 3 comps
| Address | Beds | Baths | Sqft | Rent | $/sqft | DOM | Units | Dist |
|---|---|---|---|---|---|---|---|---|
| 3875 Denali Dr Apopka, FL | 3.0 | 2.5 | 1734 | $2,450 | $1.41 | 22d | 1 | 1.11mi |
| 3941 Cuyahoga Valley Ct Apopka, FL | 3.0 | 2.5 | 2138 | $2,650 | $1.24 | 22d | 1 | 1.16mi |
| 3979 Capital Reef Way Apopka, FL | 3.0 | 2.5 | 2128 | $2,545 | $1.20 | 15d | 1 | 1.21mi |
HOA detail
- Monthly dues
- $415 · $4,980/yr
Listing history 14 events
-
2026-06-13statusdays on market $224,900 Pending 31 DOM
-
2026-06-09days on market $224,900 Active 30 DOM
-
2026-06-08days on market $224,900 Active 29 DOM
-
2026-06-07days on market $224,900 Active 28 DOM
-
2026-06-04days on market $224,900 Active 25 DOM
-
2026-06-03days on market $224,900 Active 24 DOM
-
2026-06-02days on market $224,900 Active 23 DOM
-
2026-06-01days on market $224,900 Active 22 DOM
-
2026-05-31days on market $224,900 Active 21 DOM
-
2026-05-12status Active
-
2026-05-04price $224,900
-
2025-10-26status Pending
-
2025-10-24$245,000 Active
-
1993-11-01soldstatus $20,800
ⓘ Source: listings_history table (triggers on properties + properties_extension) + one-shot
backfill from property_details.listing_events for pre-trigger history.
Tax reassessment forecast FL · Resets to sale price
- Current annual tax
- $1,357 · $113/mo
- Projected year-2 tax
- $1,867 · $156/mo
- Expected delta
- +$510/yr (+$42/mo · 37.6%)
ⓘ Screening estimate from a state-policy table — verify with the county assessor before closing.
Climate risk First Street
- Flood 1/10 Low FEMA zone X (unshaded) · 0% chance over 30 yrs
- Wildfire 5/10 Major
- Heat 8/10 Severe 7 d/yr ≥108°F today · 22 d/yr by 30 yrs out
- Wind 9/10 Extreme 99% chance of damaging wind over 30 yrs
- Air quality 1/10 Low 0 unhealthy d/yr today · 0 by 30 yrs out
Nearby sold comps map
Loading sold comps map…
Walkable amenities ~0.75 mi
Loading nearby amenities…
Taxation est. · year 1
- Rental income
- $30,644
- − Mortgage interest
- −$12,598
- − Property taxes
- −$1,357
- − Insurance
- −$1,124
- − Repairs & maintenance
- −$2,451
- − Management
- −$2,451
- − HOA
- −$4,980
- − Depreciation
- −$6,543
- Taxable loss
- −$861
- Est. tax savings @ 24.0%
- +$207
- After-tax cash flow
- $2,801/yr
For passive investors: Depreciation is non-cash, so a rental often shows a tax loss while cash-flowing — sheltering income. Rental losses are passive: they offset passive income freely, and up to $25,000/yr can offset ordinary (W-2) income if you actively participate and your MAGI is under $100k (phasing out to $0 by $150k); unused losses carry forward. On sale, claimed depreciation is recaptured at up to 25%, and gains may owe capital-gains tax (a 1031 exchange can defer both). Figures are a year-1 estimate at your 24.0% rate — not tax advice; consult a CPA.
Schools (NCES district)
- District
- Orange
- NCES district ID
- 1201440
- Math proficiency
- 46% ▼ -9.00%
- Reading proficiency
- 51% ▼ -2.00%
- Median HH income
- $49,350
- Composite
- 41.47/100
- National rank
- #3461
- State rank
- #43 of 73 in FL
Livability — Zellwood
- Score
- 75/100
- State rank
- #248
- US rank
- #3918
Category grades
Schools grade is shown separately in the Schools card above.
Census & demographics
- Census place
- Zellwood, FL
- City population
- 2,159
- Population (ZIP)
- 2,159
Population outlook (Orange County) Hauer SSP2
- Today (2025)
- 1,618,226 people
- By 2030
- 1,787,404 · +10.5%
- By 2040
- 2,125,621 · +31.4%
- By 2050
- 2,454,016 · +51.6%
- By 2075
- 3,173,711 · +96.1%
- By 2100
- 3,607,781 · +122.9%
Race, ethnicity, and origin ACS 2023
- Neighborhood character
- Predominantly White (86%)
- Race & ethnicity
- White 86% Hispanic / Latino 10% Two or more races 8%
- Hispanic origin (detail)
- Puerto Rican 10%
- Common ancestry
- Iranian 5% Lithuanian 5% Romanian 2%
- Foreign-born
- 5%
- Languages at home
- 89% English-only · Spanish 9% German/W. Germanic 3%
Political lean MEDSL · Orange
- 2024 margin
- D (+13.6) · D 56.1% · R 42.5% · Other 1.3%
- 2008→2024 swing
- -5.0pp toward R · 2008: 18.6pp · 2024: 13.6pp
- All cycles
- 2024: D+13.6 2020: D+23.1 2016: D+24.6 2012: D+18.2 2008: D+18.6
Not yet ingested
- Civics
- —
Market trends
- HPI YoY
- ▲ 2.50%
- Current HPI
- 254.7681
- Rent YoY
- —
- Metro
- —
- State GDP YoY
- ▲ 3.28%
- F500 in state
- 36
Industry mix (Fortune 500 HQ in FL)
| Industry | F500 HQs | Revenue |
|---|---|---|
| Industrial Technology | 2 | $29B |
|
||
| Insurance | 2 | $17B |
|
||
| Retail | 1 | $60B |
|
||
| Technology Distribution | 1 | $58B |
|
||
| Homebuilding | 1 | $35B |
|
||
| Technology Manufacturing | 1 | $35B |
|
||
Price history
+981.2% since first listed5 events — show timeline
- 2026-05-12 Relisted — Stellar MLS as Distributed by MLS Grid
- 2026-05-04 Price Changed $224,900 Stellar MLS as Distributed by MLS Grid
- 2025-10-26 Pending — Stellar MLS as Distributed by MLS Grid
- 2025-10-24 Listed $245,000 Stellar MLS as Distributed by MLS Grid
- 1993-11-01 Sold (Public Records) $20,800 Public Records
Property tax history
-2.9%/yrLatest (2025): $1,357 · +3.9% YoY. Source: county tax records.
Cash-flow waterfall
monthlySold comps — $/sqft
last 12 mo · ≤1 miLoading sold comps…