 Duplex
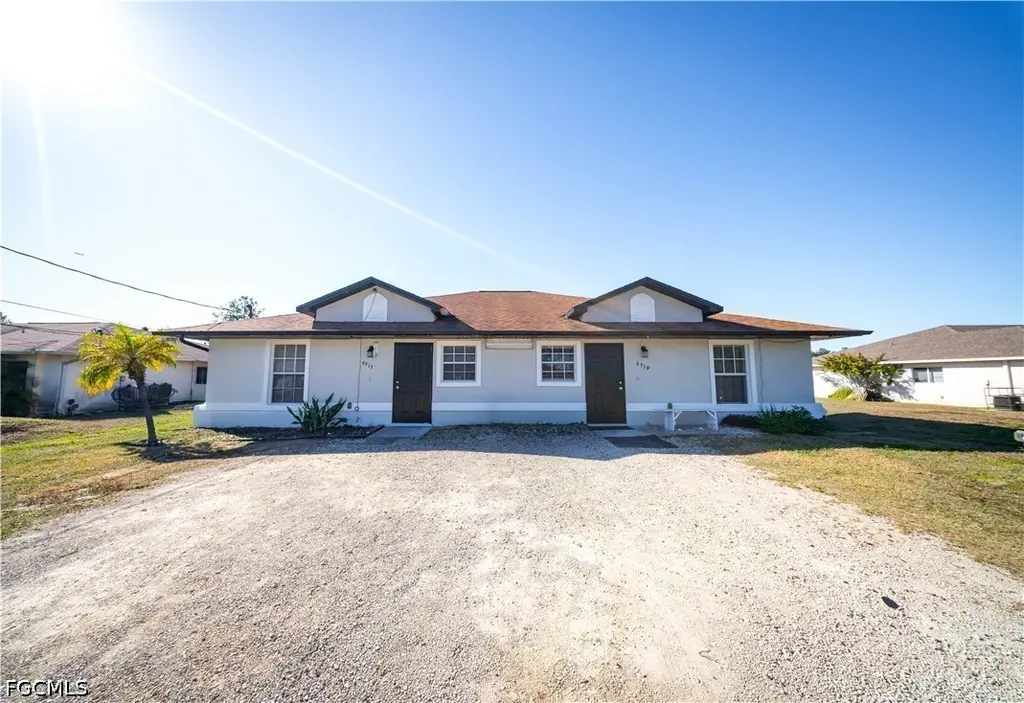
4519 25th St SW · Lehigh Acres, FL
Flood risk No data
- FEMA flood zone
- —
- Chance of flooding over 30 yrs
- —
- Est. flood insurance / yr
- —
Fire risk No data
- Est. fire insurance / yr
- —
Heat risk No data
- Hot days now (above threshold)
- —
- Hot days in 30 yrs
- —
Wind risk No data
- Chance of severe wind over 30 yrs
- —
Air-quality risk No data
- Unhealthy air days now
- —
- Unhealthy air days in 30 yrs
- —
Risk factors via First Street. Map © Google.
Why this score? — see what drove the D grade
The composite is a weighted blend of 9 inputs, each scored 0–100. Each bar is that input's sub-score; the figure is the points it added to the 100-point composite (weight × sub-score).
- Cash flow +15.0/30.0
- ARV discount +7.5/15.0
- DSCR +4.6/10.0
- Schools +4.1/10.0
- Condition / age +3.8/5.0
- 1% rule +3.7/10.0
- Livability +3.0/5.0
- Appreciation +0.8/10.0
- Rent growth +0.8/5.0
$360,000
🖨 Deal sheet (PDF) 📄 Offer letter ✓ Due diligence
Multi-family units
County records classify this as Multi-Family (2-4 Unit). Listing-text estimate: 2 units. confirmed
Listing remarks
LOW-PRICED DUPLEX IN BOOMING LEHIGH ACRES! Don’t miss this incredible deal in one of Southwest Florida’s fastest-growing areas. Priced to sell! Both units are currently rented—start generating income from day one. Featuring a new roof, new A/C, and new water heater, this is the perfect low-maintenance, high-potential investment.
Key facts
- 0.28 acre lot
- Built 2005
- Listed 64 days
Property features AI
Finance
- Financial info: Gross scheduled income: $38,400; Operating expenses: $8,000; Current actual rent for the unit: $3,200; Pro forma rent: $3,200; Tenant pays electricity; Pets allowed
- HOA & community: Non-gated community; No association fee
Exterior
- Utilities: Cable available; Septic tank; Private well
- Home design: RM-2 zoning; Resale property
- Construction: Built with block, concrete and stucco; Shingle roof
- Exterior features: Oversized lot; No additional exterior features listed
Interior
- Bedrooms: One unit with 4 bedrooms (laundry in residence)
- Flooring: Carpet; Tile
- Bathrooms: 4 full bathrooms
- Heating & cooling: Central electric heating; Central electric cooling
- Interior features: Double-hung windows
- Laundry & utility: In-unit laundry
Neighborhood map
What this means for you Summary
Snapshot
- This is a 2 × 2-bed/2.0-bath units multifamily listed at $360k. Condition is rated good.
Deal economics
- At list price, monthly cash flow is $111 ($1k/yr) — positive. Per door: $55/mo.
- The deal already cash-flows at list — no discount required.
- To meet the 1% rule (rent ≥ 1% of price), the offer needs to be $315k (12.5% below list).
- Recommended offer: $315k (12.5% below list) — sets the bar for 1% rule.
- Cap rate 6.7% vs local median 4.7% in Lehigh Acres — top-decile yield for the area; either an underpriced asset or a hidden risk that comps aren't pricing in. Stress-test before assuming the spread holds.
Location & tenants
- Location reads 59/100 on livability (#826 in FL) — a working-class tenant base; expect higher turnover. Strengths: cost of living A+, housing A+; Watch: crime C-, employment D+, amenities F.
- Lee (suburban): math 47% / reading 50% proficiency, ranked #42 of 73 in FL (top 58%) — families likely to look elsewhere, expect single-tenant / working-renter base with shorter leases.
- Zoned schools: Veterans Park Academy For The Arts (math 41% / reading 45%, grade F, #1,366 of 2,144 statewide, top 64%, 2,133 students, 36% FRL); Oak Hammock Middle School (math 43% / reading 41%, grade D-, #340 of 571 statewide, top 61%, 1,563 students, 56% FRL); Lehigh Senior High School (math 23% / reading 45%, grade F, #394 of 667 statewide, top 60%, 2,476 students, 57% FRL).
- Market conditions: Rents falling (-7.0%/yr); 295 active listings in the ZIP; 40 comparable units currently listed for rent nearby; rentals at typical pace (median 23d on market — plan ~3-4 weeks tenant-placement turnaround); 15,411 units permitted in Lee County in 2024 (4,686 in 5+ unit buildings).
- At $3,149/mo this rent would consume 62% of the median local household income ($61k/yr) (locally 1142% of renters already pay >50% of income on rent) — very limited rent-growth headroom before tenants either downsize or default.
Forward outlook
- Local home prices are declining (-3.0%/yr); year-one equity from $2k of loan paydown is wiped out by about $11k of value loss. Plan a longer hold.
- Lee County population projected at +44% by 2050 — long-run rental-demand tailwind backs the buy-and-hold thesis.
Negotiation context
- It's been on market 65 days — a 6% lower offer ($338k) is reasonable based on typical stale-listing flexibility.
- 2 sale attempts with the ask held roughly flat each time — persistent listings suggest the price (not the market) is what's stuck; bring a comps-based counter.
Questions for the listing agent
- It's been on market 65 days. Have you received any prior offers? Is the seller open to a 13% concession, seller financing, or rate buy-down credit?
- Can we see the unit-by-unit rent roll, current vacancy, and any below-market leases? What's the average tenancy length?
- What capital expenditures (roof, boiler, parking lot, exteriors) have been made in the last 5 years, and what's planned in the next 2?
- Why hasn't it sold? Are there any deal-killer items the seller is aware of (foundation, flood, title, zoning, code violations)?
- Is there a deadline driving the sale (1031 exchange, divorce, estate, relocation)? That informs how much negotiation room exists.
- Schools are D-rated, which usually means shorter tenancies and higher turnover. Who's the typical renter profile here, and what's been the actual vacancy rate?
- The area grade is low — what's the realistic commute time and amenity access for the typical tenant pool here? Any planned neighborhood developments (good or bad) we should know about?
- What's the average days-on-market for RENTAL listings here right now (not sales)? A rising rental-DOM trend means longer vacancies and softer asking-rent achievability than the comps imply.
- What's the recent tenant-quality profile in this submarket — average credit score on applications, eviction rate, late-payment / NSF rate, and stable-employment percentage? A property-management company in the area should have these aggregated.
- How much new apartment / multifamily construction is in the pipeline within 1–3 miles? Heavy new supply (>2% of stock underway) typically softens rents 12–24 months out; light construction supports rent growth.
Investment metrics
- 1% rule
- 0.87% ✗
- Cap rate
- 6.66%
- Cash-on-cash
- 1.32%
- DSCR
- 1.06
- GRM
- 9.5
CMA / ARV
No comps found within radius.
Projected returns pro-forma
-3.0% appreciation · 0.0% rent growth · sell at horizon
- IRR
- -17.5%
- Equity multiple
- 0.40×
- Total profit
- $-60,538
- Equity at exit
- $53,677
- IRR
- -16.2%
- Equity multiple
- 0.21×
- Total profit
- $-79,389
- Equity at exit
- $31,126
Cash invested: $100,800 (down + closing). Projections, not guarantees.
Landlord ↔ Tenant lean methodology
- Overall (STATE)
- 87 Strongly Landlord-Friendly
- State Florida
- 87 Strongly Landlord-Friendly · R+3
- County
- — inherits STATE
- City
- — inherits STATE
ZIP-level market 33973
- Home prices YoY
- -3.4%
- Rents YoY
- -7.0%
- Active inventory
- 295
- Price-to-rent
- 19.1×
Monthly cashflow live
- Estimated rent
- $3,149 high interval (Pro) →
- Mortgage (P&I)
- −$1,888
- Tax from tax record
- −$339 /mo · $4,070/yr
- Insurance
- −$150
- HOA
- −$0
- Vacancy / Maint / Mgmt
- −$661
- Net cashflow
- $111
Break-even live
Sensitivity live
| Price | -10% $314 | -5% $213 | +0% $111 | +5% $9 | +10% $-93 |
|---|---|---|---|---|---|
| Rent | -10% $-138 | -5% $-14 | +0% $111 | +5% $235 | +10% $359 |
| Rate | -1.0pp $292 | -0.5pp $202 | base $111 | +0.5pp $17 | +1.0pp $-78 |
2-unit breakdown (identical units grouped — click to expand)
| Units | Beds | Baths | Est. rent |
|---|---|---|---|
| 2× units | 2 | 2 | $3,148 |
| #1 | 2 | 2 | $1,574 |
| #2 | 2 | 2 | $1,574 |
| Total (2 units) | $3,149 | ||
UW: 25.0% down · 7.5% · 30yr · 1.5% tax · 5.0% vac · 8.0% maint · 8.0% mgmt
Financing live
Cash to close
- Down payment
- $90,000
- Closing costs
- $10,800
- Reserves months
- —
- Total cash needed
- —
Loan-product check · same deal, 3 products live
Conventional
25% down · 7.5% · 30yr
- Down + closing
- —
- Monthly P&I
- —
- Monthly cashflow
- —
- DSCR
- —
- Eligible?
- —
Personal DTI + credit; lowest rate.
DSCR
20% down · 8.5% · 30yr
- Down + closing
- —
- Monthly P&I
- —
- Monthly cashflow
- —
- DSCR
- —
- Eligible?
- —
No personal income docs; deal must DSCR.
Hard money
10% down · 12.0% · 12mo
- Down + closing
- —
- Monthly P&I
- —
- Monthly cashflow
- —
- DSCR
- —
- Eligible?
- —
Short-term bridge; refi at stabilization.
Rent comps 40 comps
| Address | Beds | Baths | Sqft | Rent | $/sqft | DOM | Units | Dist |
|---|---|---|---|---|---|---|---|---|
| 4449 26th St SW Lehigh Acres, FL | 3.0 | 2.0 | 2242 | $1,900 | $0.85 | 25d | 1 | 0.14mi |
| 4421 25th St SW Lehigh Acres, FL | 3.0 | 2.0 | 1253 | $1,250 | $1.00 | 12d | 1 | 0.26mi |
| 4541 21st St SW Lehigh Acres, FL | 3.0 | 2.0 | 2228 | $1,695 | $0.76 | 25d | 1 | 0.28mi |
| 4543 21st St SW Lehigh Acres, FL | 3.0 | 2.0 | 1228 | $1,600 | $1.30 | 5d | 1 | 0.28mi |
| 4543 21st St SW Lehigh Acres, FL | 3.0 | 2.0 | 1228 | $1,600 | $1.30 | 4d | 1 | 0.28mi |
| 2202 Haviland Ave S Lehigh Acres, FL | 3.0 | 2.0 | 1288 | $1,900 | $1.48 | 5d | 1 | 0.29mi |
| 4614 25th St SW Lehigh Acres, FL | 3.0 | 2.0 | 2328 | $1,300 | $0.56 | 23d | 1 | 0.34mi |
| 4621 25th St SW Lehigh Acres, FL | 3.0 | 2.0 | 1280 | $1,950 | $1.52 | 21d | 1 | 0.37mi |
| 4621 25th St SW Lehigh Acres, FL | 3.0 | 2.0 | 1280 | $1,950 | $1.52 | 25d | 1 | 0.37mi |
| 1578 Gretchen Ave S Lehigh Acres, FL | 3.0 | 2.0 | 1728 | $2,000 | $1.16 | 25d | 1 | 0.38mi |
| 4646 24th St SW Lehigh Acres, FL | 3.0 | 2.0 | 1600 | $1,600 | $1.00 | 25d | 1 | 0.50mi |
| 10525 Timber Creek Dr Fort Myers, FL | 4.0 | 3.0 | 2032 | $3,100 | $1.53 | 16d | 1 | 0.50mi |
| 10525 Timber Creek Dr Fort Myers, FL | 4.0 | 3.0 | 2032 | $3,100 | $1.53 | 5d | 1 | 0.50mi |
| 14279 Winding Cedar Way Fort Myers, FL | 4.0 | 3.0 | 2032 | $3,000 | $1.48 | 4d | 1 | 0.51mi |
| 4700-4702 22nd St SW Unit 4700 Lehigh Acres, FL | 3.0 | 2.0 | 1260 | $2,050 | $1.63 | 25d | 1 | 0.53mi |
| 4660 26th St SW Unit 4662 Lehigh Acres, FL | 3.0 | 2.0 | 2246 | $1,700 | $0.76 | 21d | 1 | 0.56mi |
| 4501 15th St SW Unit 4501 Lehigh Acres, FL | 3.0 | 2.0 | 2383 | $1,800 | $0.76 | 25d | 1 | 0.58mi |
| 4708 27th St SW Lehigh Acres, FL | 3.0 | 2.0 | 1500 | $1,700 | $1.13 | 25d | 1 | 0.63mi |
| 4710 27th St SW Lehigh Acres, FL | 3.0 | 2.0 | 1500 | $1,700 | $1.13 | 25d | 1 | 0.63mi |
| 1502 Gretchen Ave S Lehigh Acres, FL | 3.0 | 2.0 | 1270 | $2,000 | $1.57 | 5d | 1 | 0.63mi |
| 10575 Timber Creek Dr Fort Myers, FL | 3.0 | 3.0 | 2434 | $10,000 | $4.11 | 25d | 1 | 0.63mi |
| 4734 22nd St SW Lehigh Acres, FL | 3.0 | 2.0 | 2349 | $1,850 | $0.79 | 25d | 1 | 0.67mi |
| 4518 14th St SW Lehigh Acres, FL | 3.0 | 2.0 | 2376 | $2,000 | $0.84 | 25d | 1 | 0.67mi |
| 4221 18th St SW Lehigh Acres, FL | 3.0 | 2.5 | 1600 | $2,600 | $1.62 | 15d | 1 | 0.68mi |
| 4719 28th St SW Lehigh Acres, FL | 3.0 | 2.0 | 2000 | $1,850 | $0.93 | 25d | 1 | 0.68mi |
| 14158 Gardeners Way Fort Myers, FL | 3.0 | 2.5 | 1871 | $2,600 | $1.39 | 4d | 1 | 0.68mi |
| 4203 23rd St SW Lehigh Acres, FL | 4.0 | 2.0 | 1833 | $1,850 | $1.01 | 21d | 1 | 0.70mi |
| 4720 29th St SW Unit 4722 Lehigh Acres, FL | 3.0 | 2.0 | 2394 | $2,400 | $1.00 | 25d | 1 | 0.70mi |
| 4722 29th St SW Lehigh Acres, FL | 3.0 | 2.0 | 1227 | $1,800 | $1.47 | 25d | 1 | 0.71mi |
| 4713 13th St SW Lehigh Acres, FL | 3.0 | 2.0 | 2320 | $1,600 | $0.69 | 5d | 1 | 0.72mi |
| 11091 Canopy Loop Fort Myers, FL | 4.0 | 3.0 | 2032 | $3,300 | $1.62 | 5d | 1 | 0.73mi |
| 4743 14th St SW Lehigh Acres, FL | 3.0 | 2.0 | 2340 | $1,700 | $0.73 | 25d | 1 | 0.74mi |
| 11127 Canopy Loop Fort Myers, FL | 3.0 | 3.0 | 2434 | $3,275 | $1.35 | 25d | 1 | 0.75mi |
| 11171 Canopy Loop Fort Myers, FL | 3.0 | 3.0 | 2434 | $3,000 | $1.23 | 15d | 1 | 0.82mi |
| 1110 Hightower Ave S Lehigh Acres, FL | 3.0 | 2.0 | 1227 | $1,325 | $1.08 | 25d | 1 | 0.83mi |
| 4800 15th St SW Lehigh Acres, FL | 3.0 | 2.0 | 2522 | $1,800 | $0.71 | 23d | 1 | 0.92mi |
| 4021 28th St SW Lehigh Acres, FL | 3.0 | 2.0 | 1529 | $1,800 | $1.18 | 25d | 1 | 0.96mi |
| 14129 Pine Lodge Ln Fort Myers, FL | 3.0 | 3.0 | 1934 | $2,300 | $1.19 | 23d | 1 | 0.96mi |
| 4101 33rd St SW Lehigh Acres, FL | 3.0 | 2.0 | 1698 | $2,200 | $1.30 | 16d | 1 | 1.00mi |
| 723 Ivan Ave S Lehigh Acres, FL | 3.0 | 2.0 | 2000 | $1,800 | $0.90 | 23d | 1 | 1.00mi |
Listing history 13 events
-
2026-06-10days on market $360,000 Active 65 DOM
-
2026-06-09days on market $360,000 Active 64 DOM
-
2026-06-07days on market $360,000 Active 62 DOM
-
2026-06-03days on market $360,000 Active 58 DOM
-
2026-06-02days on market $360,000 Active 57 DOM
-
2026-06-01days on market $360,000 Active 56 DOM
-
2026-06-01days on market $360,000 Active 55 DOM
-
2026-04-06$360,000 Active
-
2026-03-20status Pending
-
2026-03-19historical
-
2026-03-09price $360,000
-
2026-02-04price $383,800
-
2026-01-18$398,500 Active
ⓘ Source: listings_history table (triggers on properties + properties_extension) + one-shot
backfill from property_details.listing_events for pre-trigger history.
Tax reassessment forecast FL · Resets to sale price
- Current annual tax
- $4,070 · $339/mo
- Projected year-2 tax
- $4,070 · $339/mo
- Expected delta
- $0/yr ($0/mo · 0.0%)
ⓘ Screening estimate from a state-policy table — verify with the county assessor before closing.
Nearby sold comps map
Loading sold comps map…
Walkable amenities ~0.75 mi
Loading nearby amenities…
Taxation est. · year 1
- Rental income
- $37,788
- − Mortgage interest
- −$20,166
- − Property taxes
- −$4,070
- − Insurance
- −$1,800
- − Repairs & maintenance
- −$3,023
- − Management
- −$3,023
- − Depreciation
- −$10,473
- Taxable loss
- −$4,767
- Est. tax savings @ 24.0%
- +$1,144
- After-tax cash flow
- $2,472/yr
For passive investors: Depreciation is non-cash, so a rental often shows a tax loss while cash-flowing — sheltering income. Rental losses are passive: they offset passive income freely, and up to $25,000/yr can offset ordinary (W-2) income if you actively participate and your MAGI is under $100k (phasing out to $0 by $150k); unused losses carry forward. On sale, claimed depreciation is recaptured at up to 25%, and gains may owe capital-gains tax (a 1031 exchange can defer both). Figures are a year-1 estimate at your 24.0% rate — not tax advice; consult a CPA.
Condition & rehab AI · 12 photos
This well-maintained, low-maintenance multi-family property in Lehigh Acres offers a great investment opportunity with minimal repairs and updates needed.
Repairs flagged
- Minor kitchen countertops — Worn appearance suggests minor repairs needed.
- Minor paint touch-ups — Faded paint in living room suggests touch-ups are needed.
- Minor landscaping — Overgrown areas around the property suggest landscaping needs attention.
Value-add opportunities
- Both Paint touch-ups — Fresh paint enhances curb appeal and interior aesthetics.
- Both Landscaping — A well-maintained exterior can attract more potential buyers/tenants.
- Both New flooring in common areas — Fresh tile flooring can improve the overall look and feel of the property.
- Both New kitchen countertops — Modern countertops can increase the property's appeal and value.
- Both New paint in living room — Fresh paint can make the living room more inviting and visually appealing.
Renovation cost estimate screening
| Repair item | Severity | Est. cost |
|---|---|---|
| kitchen countertops · Worn appearance suggests minor repairs needed. | Minor | $500–3,000 |
| paint touch-ups · Faded paint in living room suggests touch-ups are needed. | Minor | $500–3,000 |
| landscaping · Overgrown areas around the property suggest landscaping needs attention. | Minor | $500–3,000 |
| Total estimated repair cost · 3 items | $1,500–9,000 |
Value-add ROI direction
- Both Paint touch-ups — Fresh paint enhances curb appeal and interior aesthetics. ↑
- Both Landscaping — A well-maintained exterior can attract more potential buyers/tenants. ↑
- Both New flooring in common areas — Fresh tile flooring can improve the overall look and feel of the property. ↑
- Both New kitchen countertops — Modern countertops can increase the property's appeal and value. ↑
- Both New paint in living room — Fresh paint can make the living room more inviting and visually appealing. ↑
ⓘ Cost ranges are severity-bucket heuristics (US national rule-of-thumb). Get contractor quotes + a written scope before underwriting a rehab budget.
Schools (NCES district)
- District
- Lee
- NCES district ID
- 1201080
- Math proficiency
- 47% ▼ -11.00%
- Reading proficiency
- 50% ▼ -4.00%
- Median HH income
- $49,518
- Composite
- 41.49/100
- National rank
- #3458
- State rank
- #42 of 73 in FL
Livability — Lehigh Acres
- Score
- 59/100
- State rank
- #826
- US rank
- #20055
Category grades
Schools grade is shown separately in the Schools card above.
Census & demographics
- Census place
- Lehigh Acres, FL
- County
- Lee County · 788,662 people
- City population
- 130,638
- Metro
- Cape Coral-Fort Myers, FL
- Population (ZIP)
- 14,392
- Household income
- $60,530
- Rent vs Own
- Severe rent burden
- 1142.0
Population outlook (Lee County) Hauer SSP2
- Today (2025)
- 871,946 people
- By 2030
- 955,468 · +9.6%
- By 2040
- 1,113,587 · +27.7%
- By 2050
- 1,256,891 · +44.1%
- By 2075
- 1,560,270 · +78.9%
- By 2100
- 1,726,848 · +98.0%
Race, ethnicity, and origin ACS 2023
- Neighborhood character
- Diverse neighborhood (Simpson 0.67)
- Race & ethnicity
- Hispanic / Latino 41% Black 36% Two or more races 21% White 18%
- Hispanic origin (detail)
- Mexican 21% Puerto Rican 7% Cuban 4% Dominican 1%
- Common ancestry
- Hispanic 14% Russian 1% Estonian 1%
- Foreign-born
- 23% · Canada, China
- Languages at home
- 54% English-only · Spanish 31% French/Haitian/Cajun 13% Other Indo-European 1%
Political lean MEDSL · Lee
- 2024 margin
- Strong R (+28.4) · D 35.5% · R 63.9%
- 2008→2024 swing
- -18.0pp toward R · 2008: -10.4pp · 2024: -28.4pp
- All cycles
- 2024: R+28.4 2020: R+19.2 2016: R+20.4 2012: R+16.6 2008: R+10.4
Not yet ingested
- Civics
- —
Market trends
- HPI YoY
- ▼ -8.43%
- Current HPI
- 237.694
- Rent YoY
- ▼ -6.99%
- Metro
- Cape Coral-Fort Myers, FL
- State GDP YoY
- ▲ 3.28%
- F500 in state
- 36
Industry mix (Fortune 500 HQ in FL)
| Industry | F500 HQs | Revenue |
|---|---|---|
| Industrial Technology | 2 | $29B |
|
||
| Insurance | 2 | $17B |
|
||
| Retail | 1 | $60B |
|
||
| Technology Distribution | 1 | $58B |
|
||
| Homebuilding | 1 | $35B |
|
||
| Technology Manufacturing | 1 | $35B |
|
||
Price history
-9.7% since first listed6 events — show timeline
- 2026-04-06 Listed $360,000 FORTMLS
- 2026-03-20 Pending — FORTMLS
- 2026-03-19 Listing Removed — FORTMLS
- 2026-03-09 Price Changed $360,000 FORTMLS
- 2026-02-04 Price Changed $383,800 FORTMLS
- 2026-01-18 Listed $398,500 FORTMLS
Cash-flow waterfall
monthlySold comps — $/sqft
last 12 mo · ≤1 miLoading sold comps…