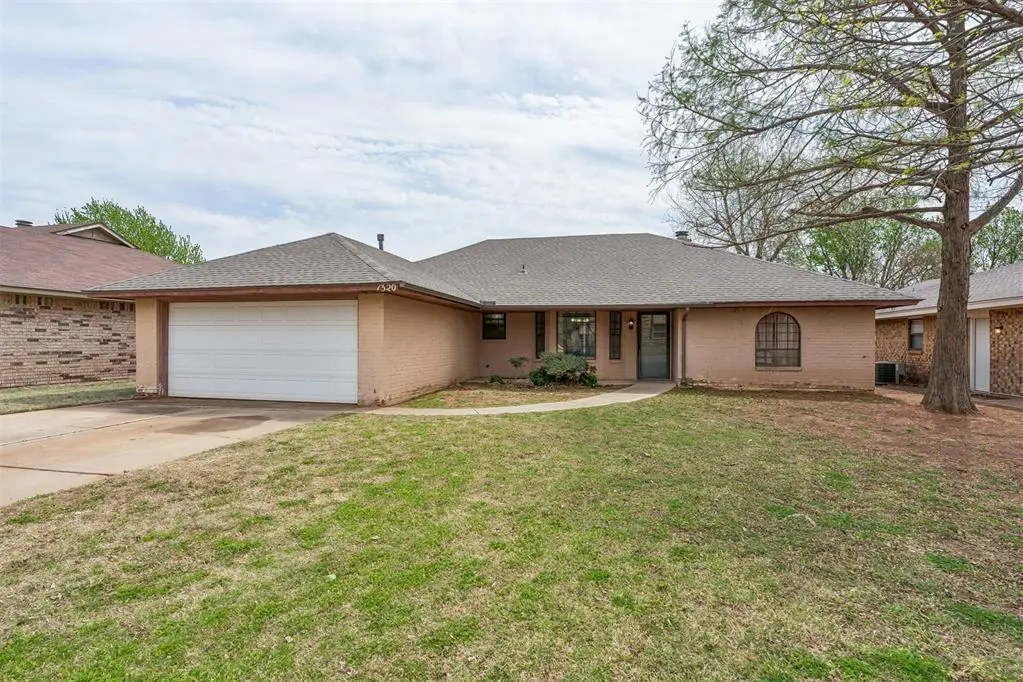
1320 Kelly Park Rd · Edmond, OK
Flood risk 1/10 · Minimal
- FEMA flood zone
- X (unshaded)
- Chance of flooding over 30 yrs
- 0.0%
- Est. flood insurance / yr
- $507 – $1,088
Fire risk 3/10 · Minor
- Est. fire insurance / yr
- $2,463 – $4,575
Heat risk 6/10 · Moderate
- Hot days now (above 107°F)
- 7 days/yr
- Hot days in 30 yrs
- 19 days/yr
Wind risk 2/10 · Minimal
- Chance of severe wind over 30 yrs
- 3.0%
Air-quality risk 2/10 · Minimal
- Unhealthy air days now
- 2 days/yr
- Unhealthy air days in 30 yrs
- 2 days/yr
Risk factors via First Street. Map © Google.
Why this score? — see what drove the C+ grade
The composite is a weighted blend of 9 inputs, each scored 0–100. Each bar is that input's sub-score; the figure is the points it added to the 100-point composite (weight × sub-score).
- Cash flow +21.3/30.0
- ARV discount +15.0/15.0
- DSCR +6.8/10.0
- 1% rule +5.4/10.0
- Livability +3.9/5.0
- Schools +3.6/10.0
- Rent growth +3.5/5.0
- Condition / age +2.5/5.0
- Appreciation +0.0/10.0
$175,000
🖨 Deal sheet 📄 Offer letter ✓ Due diligence
Listing remarks MLS
Move-in-Ready,Bring Your Picky Buyers to Preview 3 Bed,2 Bath,2 Car Updates Include:(New Carpet,New Pergo Wood Floors Kitchen/Dining,New Dishwasher,New Tile Both Bathrooms and New Shower Faucets, New Garage Door,New Fence,Freshly Painted),MIL Plan,Open Floor Plan,Call Jerry 413-3085,Hurry!!!
Key facts
- 7,802 sq ft lot
- 2 garage spots
- Built 1981
Property features AI
Finance
- Other: Lot size approximately 0.1791 acre
- Financial info: Court approval required for sale; Vacant and not occupied
- HOA & community: No mandatory association dues
Exterior
- Parking: 2-car garage
- Utilities: No storm shelter
- Home design: Single family residence; One story; Faces west; Residential property
- Construction: Brick and frame construction; Composition roof (new 2026); Aluminum frame double-pane windows; Slab foundation
- Exterior features: Covered porch; Rain gutters; Wood fence; Interior lot
Interior
- Kitchen: Kitchen
- Bedrooms: 3 bedrooms; Primary bedroom
- Flooring: Carpet; Tile
- Bathrooms: 2 full bathrooms
- Interior features: In-law plan; Carpet and tile flooring; Wood-burning fireplace
Neighborhood map
What this means for you Summary
Snapshot
- This is a 3-bed/2.0-bath single-family listed at $175k.
Deal economics
- At list price, monthly cash flow is $257 ($3k/yr) — positive.
- The deal already cash-flows at list — no discount required.
- Meets the 1% rule at list price ($2k rent vs $175k).
- Recommended offer: $172k (1.5% below list) — sets the bar for market timing.
- Cap rate 8.1% vs local median 3.4% in Edmond — top-decile yield for the area; either an underpriced asset or a hidden risk that comps aren't pricing in. Stress-test before assuming the spread holds.
Location & tenants
- Location reads 78/100 on livability (#6 in OK, #2,383 nationally) — a middle-class / working-renter tenant base. Strengths: employment A+, housing A+, crime A-; Watch: health & safety C-, commute F.
- Edmond (suburban): math 38% / reading 40% proficiency, ranked #11 of 270 in OK (top 4%) — families likely to look elsewhere, expect single-tenant / working-renter base with shorter leases.
- Zoned schools: Sunset Es (math 18% / reading 18%, grade F, #534 of 845 statewide, top 64%, 670 students, 0% FRL); Santa Fe Hs (math 36% / reading 52%, grade F, #18 of 447 statewide, top 4%, 2,796 students, 0% FRL) — zoned schools average 0% FRL vs 22% district-wide (22 pts lower); this property's tenant base skews higher-income than the district average.
- Market conditions: Rents rising (+3.9%/yr); 215 active listings in the ZIP; 40 comparable units currently listed for rent nearby; rentals leasing fast (median 12d on market — plan ~1-2 weeks tenant-placement turnaround); solid renter incomes; 5,365 units permitted in Oklahoma County in 2024 (569 in 5+ unit buildings).
Forward outlook
- Local home prices are declining (-3.0%/yr); year-one equity from $1k of loan paydown is wiped out by about $5k of value loss. Plan a longer hold.
- Oklahoma County population projected at +41% by 2050 — long-run rental-demand tailwind backs the buy-and-hold thesis.
Negotiation context
- It's been on market 15 days — a 2% lower offer ($172k) is reasonable based on typical stale-listing flexibility.
- 4 sale attempts since 24y ago with the ask held roughly flat each time — persistent listings suggest the price (not the market) is what's stuck; bring a comps-based counter.
- Current owner paid $122k; 43% above their basis — modest negotiation headroom, anchor on the comps not their cost.
Risks & watch-outs
- Climate carrying-cost: extreme-heat days projected 7→19/yr by 2055 (HVAC capex compounding) — expect insurance premiums to compound above CPI over the hold.
Questions for the listing agent
- Is there a deadline driving the sale (1031 exchange, divorce, estate, relocation)? That informs how much negotiation room exists.
- Schools are A-rated — typically a magnet for longer-tenancy family renters. What's the average tenant stay here, and is there a school-zone premium baked into asking?
- What's the average days-on-market for RENTAL listings here right now (not sales)? A rising rental-DOM trend means longer vacancies and softer asking-rent achievability than the comps imply.
- What's the recent tenant-quality profile in this submarket — average credit score on applications, eviction rate, late-payment / NSF rate, and stable-employment percentage? A property-management company in the area should have these aggregated.
- How much new for-sale + rental construction is in the pipeline within 1–3 miles? Heavy new supply typically softens prices + rents 12–24 months out; constrained supply supports both.
Investment metrics
- 1% rule
- 1.04% ✓
- Cap rate
- 8.05%
- Cash-on-cash
- 6.28%
- DSCR
- 1.28
- GRM
- 8.1
CMA / ARV
- ARV (on-the-fly)
- $234,354
- Comps found
- 12
Show comp detail 12 sales within ~0.75 mi
| Address | Dist | Beds/Ba | Sqft | Sold | Price | $/sf | Match |
|---|---|---|---|---|---|---|---|
| 1320 Kelly Park Rd | 0.00mi | 3/2.0 | 1,686 (0%) | 1mo | $175,000 | $104 | 99 |
| 1319 W Aries Rd | 0.11mi | 3/2.0 | 1,668 (-1%) | 0mo | $230,500 | $138 | 93 |
| 1213 Kelly Park Rd | 0.09mi | 3/2.0 | 1,778 (+6%) | 1mo | $220,000 | $124 | 86 |
| 1215 Taurus Dr | 0.04mi | 3/2.0 | 1,557 (-8%) | 4mo | $213,000 | $137 | 82 |
| 1701 Green Leaf Ln | 0.33mi | 3/2.0 | 1,757 (+4%) | 2mo | $244,900 | $139 | 76 |
| 1402 W Aries Rd | 0.10mi | 3/2.0 | 1,910 (+13%) | 4mo | $299,900 | $157 | 70 |
| 1908 Magnolia Ln | 0.47mi | 3/2.0 | 1,574 (-7%) | 2mo | $221,000 | $140 | 66 |
| 1413 Del Norte Dr | 0.27mi | 3/2.0 | 1,446 (-14%) | 2mo | $236,000 | $163 | 62 |
| 2109 Tanglewood Dr | 0.67mi | 3/2.0 | 1,760 (+4%) | 2mo | $237,500 | $135 | 60 |
| 601 Firelane Rd | 0.70mi | 3/2.0 | 1,622 (-4%) | 3mo | $249,500 | $154 | 59 |
| 1909 Fountain Vw | 0.47mi | 3/2.0 | 1,506 (-11%) | 3mo | $199,000 | $132 | 58 |
| 815 W 7th St | 0.72mi | 3/2.0 | 1,481 (-12%) | 4mo | $230,000 | $155 | 43 |
Match score weights: distance 35% · size 25% · config 20% · recency 20%. Top-matched comps best support the ARV.
Projected returns pro-forma
-3.0% appreciation · 3.86% rent growth · sell at horizon
- IRR
- -5.7%
- Equity multiple
- 0.79×
- Total profit
- $-10,431
- Equity at exit
- $26,093
- IRR
- 5.0%
- Equity multiple
- 1.38×
- Total profit
- $18,582
- Equity at exit
- $15,131
Cash invested: $49,000 (down + closing). Projections, not guarantees.
Landlord ↔ Tenant lean methodology
- Overall (STATE)
- 83 Strongly Landlord-Friendly
- State Oklahoma
- 83 Strongly Landlord-Friendly · R+20
- County
- — inherits STATE
- City
- — inherits STATE
ZIP-level market 73003
- Home prices YoY
- -31.2%
- Rents YoY
- 3.9%
- Active inventory
- 215
- Price-to-rent
- 8.1×
Monthly cashflow live
- Estimated rent
- $1,812 high interval (Pro) →
- Mortgage (P&I)
- −$918
- Tax from tax record
- −$184 /mo · $2,207/yr
- Insurance
- −$73
- HOA
- −$0
- Vacancy / Maint / Mgmt
- −$380
- Net cashflow
- $257
Break-even live
UW: 25.0% down · 7.5% · 30yr · 1.5% tax · 5.0% vac · 8.0% maint · 8.0% mgmt
Financing live
Cash to close
- Down payment
- $43,750
- Closing costs
- $5,250
- Reserves months
- —
- Total cash needed
- —
Loan-product check · same deal, 3 products live
Conventional
25% down · 7.5% · 30yr
- Down + closing
- —
- Monthly P&I
- —
- Monthly cashflow
- —
- DSCR
- —
- Eligible?
- —
Personal DTI + credit; lowest rate.
DSCR
20% down · 8.5% · 30yr
- Down + closing
- —
- Monthly P&I
- —
- Monthly cashflow
- —
- DSCR
- —
- Eligible?
- —
No personal income docs; deal must DSCR.
Hard money
10% down · 12.0% · 12mo
- Down + closing
- —
- Monthly P&I
- —
- Monthly cashflow
- —
- DSCR
- —
- Eligible?
- —
Short-term bridge; refi at stabilization.
Rent comps 40 comps
| Address | Beds | Baths | Sqft | Rent | $/sqft | DOM | Units | Dist |
|---|---|---|---|---|---|---|---|---|
| 1321 Kelly Park Rd Edmond, OK | 4.0 | 2.0 | 1991 | $1,995 | $1.00 | 1d | 1 | 0.04mi |
| 1404 S Gemini Rd Edmond, OK | 3.0 | 2.0 | 1267 | $1,650 | $1.30 | 23d | 1 | 0.19mi |
| 1404 S Gemini Rd Edmond, OK | 3.0 | 2.0 | 1267 | $1,650 | $1.30 | 21d | 1 | 0.19mi |
| 1013 Kelly Park Rd Edmond, OK | 4.0 | 2.0 | 1450 | $1,550 | $1.07 | 1d | 1 | 0.20mi |
| 1120 Mars Rd Edmond, OK | 4.0 | 2.0 | 1917 | $1,745 | $0.91 | 3d | 1 | 0.28mi |
| 1504 Apollo Rd Edmond, OK | 3.0 | 2.0 | 1435 | $1,475 | $1.03 | 11d | 1 | 0.36mi |
| 1121 Charlton Rd Edmond, OK | 4.0 | 3.0 | 2072 | $2,300 | $1.11 | 1d | 1 | 0.44mi |
| 808 Mars Cir Unit 1 Edmond, OK | 3.0 | 1.0 | 1401 | $1,375 | $0.98 | 19d | 1 | 0.44mi |
| 1909 Fountain Vw Edmond, OK | 3.0 | 2.0 | 1506 | $1,999 | $1.33 | 1d | 1 | 0.49mi |
| 2116 Camino del Plaza Ln Edmond, OK | 3.0 | 2.0 | 1396 | $1,645 | $1.18 | 23d | 1 | 0.68mi |
| 2125 Buena Vida Ln Edmond, OK | 3.0 | 2.5 | 1458 | $1,699 | $1.17 | 1d | 1 | 0.69mi |
| 2501 Kelley Pointe Pkwy Edmond, OK | 1.0–2.0 | 1.0–2.0 | 909 | $1,979 | $2.18 | 1d | 18 | 0.69mi |
| 2108 Buena Vida Ln Edmond, OK | 3.0 | 2.5 | 1357 | $1,640 | $1.21 | 23d | 1 | 0.69mi |
| 2149 Buena Vida Ln Edmond, OK | 3.0 | 2.5 | 1300 | $1,645 | $1.27 | 1d | 1 | 0.70mi |
| 2172 Camino del Plaza Ln Edmond, OK | 3.0 | 2.0 | 1274 | $1,600 | $1.26 | 23d | 1 | 0.71mi |
| 2172 Camino del Plaza Ln Edmond, OK | 3.0 | 2.0 | 1287 | $1,600 | $1.24 | 3d | 1 | 0.71mi |
| 2013 Vanishing Trl Edmond, OK | 3.0 | 2.0 | 1555 | $1,705 | $1.10 | 14d | 1 | 0.75mi |
| 1318 Pennington Ave Edmond, OK | 2.0 | 2.0 | 1150 | $1,300 | $1.13 | 23d | 1 | 0.78mi |
| 1028 Mollie Rausch Ln Edmond, OK | 3.0 | 2.0 | 1495 | $1,650 | $1.10 | 23d | 1 | 0.81mi |
| 804 Stag Trl Edmond, OK | 3.0 | 2.0 | 1250 | $1,550 | $1.24 | 23d | 1 | 0.89mi |
| 804 Stag Trl Edmond, OK | 3.0 | 2.0 | 1250 | $1,550 | $1.24 | 3d | 1 | 0.89mi |
| 16420 Del Mar Dr Edmond, OK | 3.0 | 2.0 | 1404 | $1,741 | $1.24 | 11d | 1 | 0.91mi |
| 575 S Fretz Ave Edmond, OK | 3.0 | 2.5 | 1530 | $2,000 | $1.31 | 2d | 1 | 0.99mi |
| 541 S Fretz Ave Edmond, OK | 2.0 | 2.5 | 1682 | $1,795 | $1.07 | 23d | 1 | 0.99mi |
| 13 NW 156th St Edmond, OK | 3.0 | 2.0 | 1746 | $2,200 | $1.26 | 23d | 1 | 1.02mi |
| 463 S Fretz Ave Edmond, OK | 2.0 | 2.0 | 1550 | $1,695 | $1.09 | 14d | 1 | 1.05mi |
| 612 W 2nd St Unit 100 Edmond, OK | 3.0 | 2.5 | 1414 | $1,895 | $1.34 | 21d | 1 | 1.05mi |
| 645 W 2nd St Edmond, OK | 3.0 | 2.0 | 1660 | $1,975 | $1.19 | 14d | 1 | 1.06mi |
| 1113 Countrywood Ln Edmond, OK | 3.0 | 2.0 | 1606 | $1,785 | $1.11 | 3d | 1 | 1.07mi |
| 1800 Napa Valley Rd Edmond, OK | 3.0 | 2.5 | 1901 | $2,200 | $1.16 | 23d | 1 | 1.09mi |
| 1024 Carpe Diem Ct Edmond, OK | 3.0 | 2.0 | 1700 | $1,895 | $1.11 | 2d | 1 | 1.10mi |
| 1129 Carpe Diem Ct Edmond, OK | 3.0 | 2.0 | 1250 | $1,595 | $1.28 | 3d | 1 | 1.13mi |
| 1820 Chelsea Dr Edmond, OK | 3.0 | 2.0 | 1749 | $1,695 | $0.97 | 1d | 1 | 1.15mi |
| 1809 Courtney Ln Edmond, OK | 3.0 | 2.0 | 1633 | $1,795 | $1.10 | 11d | 1 | 1.20mi |
| 1808 Ada Sage Ln Edmond, OK | 3.0 | 2.0 | 1918 | $2,290 | $1.19 | 1d | 1 | 1.20mi |
| 313 Dooley Creek Ln Edmond, OK | 3.0 | 2.0 | 1295 | $1,595 | $1.23 | 23d | 1 | 1.24mi |
| 317 Dooley Creek Ln Edmond, OK | 3.0 | 2.0 | 1295 | $1,595 | $1.23 | 14d | 1 | 1.25mi |
| 15 S Walnut St Edmond, OK | 2.0 | 1.0 | 1162 | $1,400 | $1.20 | 23d | 1 | 1.25mi |
| 118 Sahoma Ter Edmond, OK | 3.0 | 2.0 | 1200 | $1,350 | $1.12 | 2d | 1 | 1.28mi |
| 118 Sahoma Ter Edmond, OK | 3.0 | 2.0 | 1200 | $1,350 | $1.12 | 3d | 1 | 1.28mi |
Listing history 13 events
-
2026-04-18status Pending
-
2026-04-02$175,000 Active
-
2006-08-21soldstatus $122,000
-
2006-08-21soldstatus $122,000
-
2006-08-16soldstatus $122,000 292-char remark
Show marketing remark (292 chars)
Move-in-Ready,Bring Your Picky Buyers to Preview 3 Bed,2 Bath,2 Car Updates Include:(New Carpet,New Pergo Wood Floors Kitchen/Dining,New Dishwasher,New Tile Both Bathrooms and New Shower Faucets, New Garage Door,New Fence,Freshly Painted),MIL Plan,Open Floor Plan,Call Jerry 413-3085,Hurry!!!
-
2006-07-14$125,000 292-char remark
Show marketing remark (292 chars)
Move-in-Ready,Bring Your Picky Buyers to Preview 3 Bed,2 Bath,2 Car Updates Include:(New Carpet,New Pergo Wood Floors Kitchen/Dining,New Dishwasher,New Tile Both Bathrooms and New Shower Faucets, New Garage Door,New Fence,Freshly Painted),MIL Plan,Open Floor Plan,Call Jerry 413-3085,Hurry!!!
-
2003-04-16soldstatus $98,000
-
2003-04-14soldstatus $98,000 216-char remark
Show marketing remark (216 chars)
Great family home with master-in-law plan! Nice, open living rooms with wetbar, for easy entertaining your family and friends. Good size backyard for the kids to play in. TO SET UP SHOWINGS, PLEASE CALL DEREK DAVIS.
-
2003-01-22$98,000 216-char remark
Show marketing remark (216 chars)
Great family home with master-in-law plan! Nice, open living rooms with wetbar, for easy entertaining your family and friends. Good size backyard for the kids to play in. TO SET UP SHOWINGS, PLEASE CALL DEREK DAVIS.
-
2002-08-23historical
-
2002-07-03$99,500
-
1997-11-05soldstatus $78,000
-
1992-09-03soldstatus $55,000
ⓘ Source: listings_history table (triggers on properties + properties_extension) + one-shot
backfill from property_details.listing_events for pre-trigger history.
Tax reassessment forecast OK · Resets to sale price
- Current annual tax
- $2,207 · $184/mo
- Projected year-2 tax
- $2,207 · $184/mo
- Expected delta
- $0/yr ($0/mo · 0.0%)
ⓘ Screening estimate from a state-policy table — verify with the county assessor before closing.
Climate risk First Street
- Flood 1/10 Low FEMA zone X (unshaded) · 0% chance over 30 yrs
- Wildfire 3/10 Moderate
- Heat 6/10 Major 7 d/yr ≥107°F today · 19 d/yr by 30 yrs out
- Wind 2/10 Low 3% chance of damaging wind over 30 yrs
- Air quality 2/10 Low 2 unhealthy d/yr today · 2 by 30 yrs out
Nearby sold comps map
Loading sold comps map…
Walkable amenities ~0.75 mi
Loading nearby amenities…
Taxation est. · year 1
- Rental income
- $21,738
- − Mortgage interest
- −$9,803
- − Property taxes
- −$2,207
- − Insurance
- −$875
- − Repairs & maintenance
- −$1,739
- − Management
- −$1,739
- − Depreciation
- −$5,091
- Taxable income
- $284
- Est. tax owed @ 24.0%
- −$68
- After-tax cash flow
- $3,010/yr
For passive investors: Depreciation is non-cash, so a rental often shows a tax loss while cash-flowing — sheltering income. Rental losses are passive: they offset passive income freely, and up to $25,000/yr can offset ordinary (W-2) income if you actively participate and your MAGI is under $100k (phasing out to $0 by $150k); unused losses carry forward. On sale, claimed depreciation is recaptured at up to 25%, and gains may owe capital-gains tax (a 1031 exchange can defer both). Figures are a year-1 estimate at your 24.0% rate — not tax advice; consult a CPA.
Schools (NCES district)
- District
- Edmond
- NCES district ID
- 4010590
- Math proficiency
- 38% ▼ -12.00%
- Reading proficiency
- 40% ▼ -12.00%
- Median HH income
- $73,212
- Composite
- 35.88/100
- National rank
- #4814
- State rank
- #11 of 270 in OK
Livability — Edmond
- Score
- 78/100
- State rank
- #6
- US rank
- #2383
Category grades
Schools grade is shown separately in the Schools card above.
Census & demographics
- Census place
- Edmond, OK
- County
- Oklahoma County · 771,644 people
- City population
- 177,083
- Metro
- Oklahoma City, OK
- Population (ZIP)
- 23,236
- Household income
- $78,149
- Rent vs Own
- Severe rent burden
- 988.0
Population outlook (Oklahoma County) Hauer SSP2
- Today (2025)
- 911,875 people
- By 2030
- 982,413 · +7.7%
- By 2040
- 1,130,468 · +24.0%
- By 2050
- 1,288,422 · +41.3%
- By 2075
- 1,711,482 · +87.7%
- By 2100
- 2,088,448 · +129.0%
Race, ethnicity, and origin ACS 2023
- Neighborhood character
- Predominantly White (69%)
- Race & ethnicity
- White 69% Two or more races 13% Black 9% Hispanic / Latino 9% Asian 3%
- Hispanic origin (detail)
- Mexican 7%
- Common ancestry
- Italian 2% Slovak 2% Lithuanian 1%
- Foreign-born
- 8% · Canada, China
- Languages at home
- 90% English-only · Spanish 5% Other Indo-European 2% Chinese 1%
Political lean MEDSL · Oklahoma
- 2024 margin
- Toss-up / Even · D 48.0% · R 49.7% · Other 2.3%
- 2008→2024 swing
- +15.1pp toward D · 2008: -16.8pp · 2024: -1.7pp
- All cycles
- 2024: R+1.7 2020: R+1.1 2016: R+10.5 2012: R+16.7 2008: R+16.8
Not yet ingested
- Civics
- —
Market trends
- HPI YoY
- ▼ -104.15%
- Current HPI
- 229.3899
- Rent YoY
- ▲ 3.86%
- Metro
- Oklahoma City, OK
- State GDP YoY
- ▲ 1.55%
- F500 in state
- 6
Industry mix (Fortune 500 HQ in OK)
| Industry | F500 HQs | Revenue |
|---|---|---|
| Energy | 3 | $48B |
|
||
Price history
+218.2% since first listed13 events — show timeline
- 2026-04-18 Pending — MLSOK
- 2026-04-02 Listed $175,000 MLSOK
- 2006-08-21 Sold (Public Records) $122,000 Public Records
- 2006-08-21 Sold (Public Records) $122,000 Public Records
- 2006-08-16 Sold (MLS) $122,000 MLSOK
- 2006-07-14 Listed $125,000 MLSOK
- 2003-04-16 Sold (Public Records) $98,000 Public Records
- 2003-04-14 Sold (MLS) $98,000 MLSOK
- 2003-01-22 Listed $98,000 MLSOK
- 2002-08-23 Listing Removed — MLSOK
- 2002-07-03 Listed $99,500 MLSOK
- 1997-11-05 Sold (Public Records) $78,000 Public Records
- 1992-09-03 Sold (Public Records) $55,000 Public Records
Property tax history
+3.4%/yrLatest (2025): $2,207 · +5.1% YoY. Source: county tax records.
Cash-flow waterfall
monthlySold comps — $/sqft
last 12 mo · ≤1 miLoading sold comps…