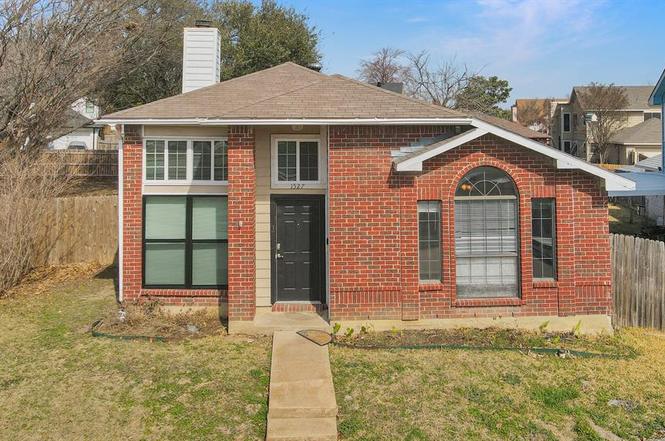
1527 Charleston Cv · Mesquite, TX
Flood risk 1/10 · Minimal
- FEMA flood zone
- X (unshaded)
- Chance of flooding over 30 yrs
- 0.0%
- Est. flood insurance / yr
- $507 – $1,088
Fire risk 3/10 · Minor
- Est. fire insurance / yr
- $1,222 – $2,270
Heat risk 8/10 · Major
- Hot days now (above 110°F)
- 7 days/yr
- Hot days in 30 yrs
- 24 days/yr
Wind risk 6/10 · Moderate
- Chance of severe wind over 30 yrs
- 27.0%
Air-quality risk 2/10 · Minimal
- Unhealthy air days now
- 1 days/yr
- Unhealthy air days in 30 yrs
- 2 days/yr
Risk factors via First Street. Map © Google.
Why this score? — see what drove the C- grade
The composite is a weighted blend of 9 inputs, each scored 0–100. Each bar is that input's sub-score; the figure is the points it added to the 100-point composite (weight × sub-score).
- ARV discount +15.0/15.0
- Cash flow +14.0/30.0
- 1% rule +5.6/10.0
- DSCR +4.2/10.0
- Livability +3.5/5.0
- Schools +2.9/10.0
- Rent growth +2.6/5.0
- Condition / age +2.5/5.0
- Appreciation +0.0/10.0
$189,000
🖨 Deal sheet (PDF) 📄 Offer letter ✓ Due diligence
Listing remarks
Ready to turn a solid 1980s classic into the comeback story of the neighborhood? Here's your chance! This 3-bedroom, 2-bath home with 1,251 square feet and a two-car garage has the kind of potential that will pique anybody's interest. The layout already works, the rooms are generously sized, and once updated, this place could go from “1986 called” to “wow, when can we close?” in a hurry. Imagine fresh LVP flowing through the main areas, modern cabinets and countertops in the kitchen, and bathrooms that don’t feel like a time capsule. The living and dining spaces have great bones and can easily become the kind of bright, inviting area buyers love to show off. Ou
Key facts
- Spacious lot
- Mature trees
- 0.24 acre lot
Tags
Neighborhood map
What this means for you Summary
Snapshot
- This is a 3-bed/2.0-bath single-family listed at $189k.
Deal economics
- At list price, monthly cash flow is $23 ($271/yr) — positive.
- The deal already cash-flows at list — no discount required.
- Meets the 1% rule at list price ($2k rent vs $189k).
- Recommended offer: $183k (3.0% below list) — sets the bar for market timing.
- Cap rate 6.4% vs local median 4.4% in Mesquite — top-decile yield for the area; either an underpriced asset or a hidden risk that comps aren't pricing in. Stress-test before assuming the spread holds.
Location & tenants
- Location reads 70/100 on livability (#358 in TX) — a middle-class / working-renter tenant base. Strengths: cost of living A+, housing A+, health & safety A-; Watch: crime F, commute F.
- Mesquite ISD (suburban): math 35% / reading 32% proficiency, ranked #536 of 826 in TX (top 65%) — families likely to look elsewhere, expect single-tenant / working-renter base with shorter leases; 63% free/reduced lunch — lower-income household profile, screen leases tightly.
- Zoned schools: Rutherford El (math 38% / reading 41%, grade F, #1,545 of 4,322 statewide, top 38%, 729 students, 78% FRL); Berry Middle (math 45% / reading 41%, grade D-, #540 of 1,662 statewide, top 33%, 579 students, 76% FRL); Horn H S (math 41% / reading 36%, grade F, #866 of 1,632 statewide, top 54%, 3,029 students, 74% FRL).
- Market conditions: Rents flat; 345 active listings in the ZIP; 40 comparable units currently listed for rent nearby; rentals at typical pace (median 15d on market — plan ~3-4 weeks tenant-placement turnaround); 12,577 units permitted in Dallas County in 2024 (6,829 in 5+ unit buildings).
- This rent runs 34% of the median local income ($71k/yr) — at the standard rent-burdened threshold; future hikes will face affordability resistance.
Forward outlook
- Local home prices are declining (-3.0%/yr); year-one equity from $1k of loan paydown is wiped out by about $6k of value loss. Plan a longer hold.
- Dallas County population projected at +35% by 2050 — long-run rental-demand tailwind backs the buy-and-hold thesis.
Negotiation context
- It's been on market 35 days — a 3% lower offer ($183k) is reasonable based on typical stale-listing flexibility.
- 3 sale attempts with the ask held roughly flat each time — persistent listings suggest the price (not the market) is what's stuck; bring a comps-based counter.
Risks & watch-outs
- Watch-outs: property tax is 3.1% of price.
- Climate carrying-cost: major wind risk, 27% chance of damaging wind over 30y; extreme-heat days projected 7→24/yr by 2055 (HVAC capex compounding) — expect insurance premiums to compound above CPI over the hold.
Questions for the listing agent
- It's been on market 35 days. Have you received any prior offers? Is the seller open to a 3% concession, seller financing, or rate buy-down credit?
- Property tax is high relative to price — has the assessment been appealed recently, and will the sale trigger a re-assessment?
- Is there a deadline driving the sale (1031 exchange, divorce, estate, relocation)? That informs how much negotiation room exists.
- Crime grade is F in this area — have there been break-ins, vandalism, or insurance claims at this property in the last 3 years? What carrier currently insures it and at what premium?
- What's the average days-on-market for RENTAL listings here right now (not sales)? A rising rental-DOM trend means longer vacancies and softer asking-rent achievability than the comps imply.
- What's the recent tenant-quality profile in this submarket — average credit score on applications, eviction rate, late-payment / NSF rate, and stable-employment percentage? A property-management company in the area should have these aggregated.
- How much new for-sale + rental construction is in the pipeline within 1–3 miles? Heavy new supply typically softens prices + rents 12–24 months out; constrained supply supports both.
Investment metrics
- 1% rule
- 1.06% ✓
- Cap rate
- 6.44%
- Cash-on-cash
- 0.51%
- DSCR
- 1.02
- GRM
- 7.9
CMA / ARV
- ARV (on-the-fly)
- $232,686
- Comps found
- 12
Show comp detail 12 sales within ~0.75 mi
| Address | Dist | Beds/Ba | Sqft | Sold | Price | $/sf | Match |
|---|---|---|---|---|---|---|---|
| 1527 Charleston Cv | 0.00mi | 3/2.0 | 1,251 (0%) | 1mo | $189,000 | $151 | 99 |
| 1529 Savannah St | 0.08mi | 3/2.0 | 1,192 (-5%) | 3mo | $225,000 | $189 | 86 |
| 438 Appomattox Dr | 0.22mi | 3/2.0 | 1,353 (+8%) | 0mo | $269,800 | $199 | 76 |
| 606 Las Brisas Dr | 0.41mi | 3/2.0 | 1,196 (-4%) | 1mo | $190,000 | $159 | 73 |
| 413 Lindo Dr | 0.38mi | 3/2.0 | 1,181 (-6%) | 1mo | $234,500 | $199 | 72 |
| 603 Las Brisas Dr | 0.42mi | 3/2.0 | 1,196 (-4%) | 3mo | $224,900 | $188 | 70 |
| 400 Seminary Rdg | 0.15mi | 4/2.0 (+1) | 1,112 (-11%) | 2mo | $249,999 | $225 | 67 |
| 426 Paldao Dr | 0.38mi | 3/2.0 | 1,389 (+11%) | 3mo | $249,999 | $180 | 61 |
| 905 Bluebonnet Ln | 0.61mi | 4/2.0 (+1) | 1,197 (-4%) | 1mo | $198,400 | $166 | 58 |
| 422 Paldao Dr | 0.38mi | 3/2.0 | 1,431 (+14%) | 2mo | $246,300 | $172 | 57 |
| 1417 Juniper Ln | 0.68mi | 3/2.0 | 1,390 (+11%) | 1mo | $250,000 | $180 | 49 |
| 624 Leyenda Dr | 0.63mi | 3/1.0 | 1,074 (-14%) | 2mo | $199,999 | $186 | 42 |
Match score weights: distance 35% · size 25% · config 20% · recency 20%. Top-matched comps best support the ARV.
Projected returns pro-forma
-3.0% appreciation · 0.22% rent growth · sell at horizon
- IRR
- -19.1%
- Equity multiple
- 0.35×
- Total profit
- $-34,432
- Equity at exit
- $28,181
- IRR
- -20.5%
- Equity multiple
- 0.08×
- Total profit
- $-48,457
- Equity at exit
- $16,341
Cash invested: $52,920 (down + closing). Projections, not guarantees.
Landlord ↔ Tenant lean methodology
- Overall (STATE)
- 87 Strongly Landlord-Friendly
- State Texas
- 87 Strongly Landlord-Friendly · R+5
- County
- — inherits STATE
- City
- — inherits STATE
ZIP-level market 75149
- Home prices YoY
- -27.4%
- Rents YoY
- 0.2%
- Active inventory
- 345
- Price-to-rent
- 7.9×
Monthly cashflow live
- Estimated rent
- $1,994 high interval (Pro) →
- Mortgage (P&I)
- −$991
- Tax from tax record
- −$483 /mo · $5,796/yr
- Insurance
- −$79
- HOA
- −$0
- Vacancy / Maint / Mgmt
- −$419
- Net cashflow
- $23
Break-even live
Sensitivity live
| Price | -10% $130 | -5% $76 | +0% $23 | +5% $-31 | +10% $-84 |
|---|---|---|---|---|---|
| Rent | -10% $-135 | -5% $-56 | +0% $23 | +5% $101 | +10% $180 |
| Rate | -1.0pp $118 | -0.5pp $71 | base $23 | +0.5pp $-26 | +1.0pp $-76 |
UW: 25.0% down · 7.5% · 30yr · 1.5% tax · 5.0% vac · 8.0% maint · 8.0% mgmt
Financing live
Cash to close
- Down payment
- $47,250
- Closing costs
- $5,670
- Reserves months
- —
- Total cash needed
- —
Loan-product check · same deal, 3 products live
Conventional
25% down · 7.5% · 30yr
- Down + closing
- —
- Monthly P&I
- —
- Monthly cashflow
- —
- DSCR
- —
- Eligible?
- —
Personal DTI + credit; lowest rate.
DSCR
20% down · 8.5% · 30yr
- Down + closing
- —
- Monthly P&I
- —
- Monthly cashflow
- —
- DSCR
- —
- Eligible?
- —
No personal income docs; deal must DSCR.
Hard money
10% down · 12.0% · 12mo
- Down + closing
- —
- Monthly P&I
- —
- Monthly cashflow
- —
- DSCR
- —
- Eligible?
- —
Short-term bridge; refi at stabilization.
Rent comps 40 comps
| Address | Beds | Baths | Sqft | Rent | $/sqft | DOM | Units | Dist |
|---|---|---|---|---|---|---|---|---|
| 1424 Savannah St Mesquite, TX | 3.0 | 2.0 | 1462 | $1,959 | $1.34 | 19d | 1 | 0.05mi |
| 1617 Savannah St Mesquite, TX | 3.0 | 2.0 | 1306 | $1,985 | $1.52 | 7d | 1 | 0.12mi |
| 450 Appomattox Dr Mesquite, TX | 3.0 | 2.0 | 1567 | $1,930 | $1.23 | 45d | 1 | 0.21mi |
| 608 Coolwood Ln Mesquite, TX | 3.0 | 2.0 | 1272 | $1,900 | $1.49 | 45d | 1 | 0.32mi |
| 612 Coolwood Ln Mesquite, TX | 3.0 | 2.0 | 1433 | $1,746 | $1.22 | 45d | 1 | 0.33mi |
| 711 Darnel Dr Mesquite, TX | 4.0 | 2.0 | 1370 | $1,939 | $1.42 | 9d | 1 | 0.36mi |
| 505 Picketts Dr Mesquite, TX | 3.0 | 2.0 | 1406 | $1,950 | $1.39 | 45d | 1 | 0.44mi |
| 1400 Paintbrush St Mesquite, TX | 3.0 | 2.5 | 1795 | $2,400 | $1.34 | 45d | 1 | 0.50mi |
| 1601 Chapman Dr Mesquite, TX | 3.0 | 2.0 | 1306 | $1,845 | $1.41 | 14d | 1 | 0.51mi |
| 1601 Hillwood Dr Mesquite, TX | 3.0 | 2.0 | 1284 | $2,095 | $1.63 | 9d | 1 | 0.62mi |
| 334 Freeman St Mesquite, TX | 3.0 | 2.0 | 1330 | $2,180 | $1.64 | 9d | 1 | 0.64mi |
| 1115 Casa Dr Mesquite, TX | 2.0 | 2.0 | 1215 | $1,850 | $1.52 | 26d | 1 | 0.66mi |
| 902 Lindo Dr Mesquite, TX | 3.0 | 1.0 | 982 | $1,695 | $1.73 | 9d | 1 | 0.74mi |
| 1011 Dandelion Dr Mesquite, TX | 3.0 | 2.0 | 1789 | $2,375 | $1.33 | 1d | 1 | 0.78mi |
| 608 Robinlynn St Mesquite, TX | 4.0 | 2.0 | 1716 | $2,235 | $1.30 | 45d | 1 | 0.92mi |
| 1416 Hackamore St Mesquite, TX | 3.0 | 2.0 | 1500 | $2,200 | $1.47 | 4d | 1 | 0.93mi |
| 1311 Caladium Dr Mesquite, TX | 3.0 | 1.5 | 1000 | $1,650 | $1.65 | 14d | 1 | 0.94mi |
| 1409 Hackamore St Mesquite, TX | 3.0 | 2.5 | 1360 | $1,965 | $1.44 | 14d | 1 | 0.97mi |
| 312 E Kimbrough St Mesquite, TX | 4.0 | 2.0 | 1560 | $2,100 | $1.35 | 45d | 1 | 0.97mi |
| 1336 E Park Dr Mesquite, TX | 3.0 | 1.0 | 1031 | $1,695 | $1.64 | 5d | 1 | 1.02mi |
| 2208 Browning Dr Mesquite, TX | 3.0 | 2.0 | 1406 | $1,955 | $1.39 | 45d | 1 | 1.02mi |
| 1512 Wheatfield Dr Mesquite, TX | 3.0 | 2.0 | 1406 | $2,000 | $1.42 | 9d | 1 | 1.03mi |
| 1700 Wheatfield Dr Mesquite, TX | 2.0 | 2.0 | 1282 | $1,700 | $1.33 | 1d | 1 | 1.04mi |
| 1232 Wheatfield Dr Mesquite, TX | 2.0 | 2.0 | 1204 | $1,825 | $1.52 | 26d | 1 | 1.05mi |
| 1436 Wheatfield Dr Mesquite, TX | 3.0 | 2.0 | 1317 | $2,180 | $1.66 | 45d | 1 | 1.05mi |
| 2345 Browning Dr Mesquite, TX | 3.0 | 2.0 | 1384 | $3,500 | $2.53 | 0d | 1 | 1.07mi |
| 1201 Wheatfield Dr Mesquite, TX | 2.0 | 2.0 | 1204 | $1,800 | $1.50 | 45d | 1 | 1.08mi |
| 1101 La Esperanza Dr Mesquite, TX | 3.0 | 2.0 | 1697 | $2,700 | $1.59 | 0d | 1 | 1.09mi |
| 2433 Baretta Dr Mesquite, TX | 3.0 | 2.0 | 1406 | $2,091 | $1.49 | 24d | 1 | 1.09mi |
| 1330 Planters Rd Mesquite, TX | 3.0 | 2.0 | 1707 | $2,095 | $1.23 | 21d | 1 | 1.11mi |
| 1330 Planters Rd Mesquite, TX | 3.0 | 2.5 | 1707 | $2,095 | $1.23 | 14d | 1 | 1.11mi |
| 1104 Ashland Dr Mesquite, TX | 3.0 | 1.0 | 1250 | $1,625 | $1.30 | 9d | 1 | 1.12mi |
| 908 Winchester Ln Mesquite, TX | 3.0 | 2.0 | 1386 | $2,049 | $1.48 | 4d | 1 | 1.12mi |
| 1128 Catalan Trl Mesquite, TX | 3.0 | 2.5 | 1600 | $2,300 | $1.44 | 45d | 1 | 1.14mi |
| 928 Winchester Ln Mesquite, TX | 3.0 | 2.0 | 1426 | $2,650 | $1.86 | 0d | 1 | 1.14mi |
| 724 Melinda Dr Mesquite, TX | 3.0 | 2.0 | 1400 | $1,950 | $1.39 | 4d | 1 | 1.18mi |
| 829 Broadmoor Dr Mesquite, TX | 3.0 | 2.0 | 1622 | $1,750 | $1.08 | 26d | 1 | 1.19mi |
| 213 Melinda Dr Mesquite, TX | 4.0 | 2.0 | 1668 | $2,095 | $1.26 | 26d | 1 | 1.22mi |
| 324 Crooked Ln Mesquite, TX | 2.0 | 2.0 | 1248 | $1,700 | $1.36 | 14d | 1 | 1.26mi |
| 337 Conger Dr Mesquite, TX | 3.0 | 2.0 | 1177 | $1,900 | $1.61 | 19d | 1 | 1.27mi |
Listing history 10 events
-
2026-04-04status Pending
-
2026-03-27historical Active Option Contract
-
2026-03-21status Active
-
2026-03-11historical Active Option Contract
-
2026-02-28$189,000 Active
-
2026-02-16historical $2,079
-
2026-01-14price $2,079
-
2026-01-05$2,099
-
2010-05-06soldstatus
-
2010-05-06soldstatus
ⓘ Source: listings_history table (triggers on properties + properties_extension) + one-shot
backfill from property_details.listing_events for pre-trigger history.
Tax reassessment forecast TX · Resets to sale price
- Current annual tax
- $5,796 · $483/mo
- Projected year-2 tax
- $5,796 · $483/mo
- Expected delta
- $0/yr ($0/mo · 0.0%)
ⓘ Screening estimate from a state-policy table — verify with the county assessor before closing.
Climate risk First Street
- Flood 1/10 Low FEMA zone X (unshaded) · 0% chance over 30 yrs
- Wildfire 3/10 Moderate
- Heat 8/10 Severe 7 d/yr ≥110°F today · 24 d/yr by 30 yrs out
- Wind 6/10 Major 27% chance of damaging wind over 30 yrs
- Air quality 2/10 Low 1 unhealthy d/yr today · 2 by 30 yrs out
Nearby sold comps map
Loading sold comps map…
Walkable amenities ~0.75 mi
Loading nearby amenities…
Taxation est. · year 1
- Rental income
- $23,932
- − Mortgage interest
- −$10,587
- − Property taxes
- −$5,796
- − Insurance
- −$945
- − Repairs & maintenance
- −$1,915
- − Management
- −$1,915
- − Depreciation
- −$5,498
- Taxable loss
- −$2,723
- Est. tax savings @ 24.0%
- +$654
- After-tax cash flow
- $925/yr
For passive investors: Depreciation is non-cash, so a rental often shows a tax loss while cash-flowing — sheltering income. Rental losses are passive: they offset passive income freely, and up to $25,000/yr can offset ordinary (W-2) income if you actively participate and your MAGI is under $100k (phasing out to $0 by $150k); unused losses carry forward. On sale, claimed depreciation is recaptured at up to 25%, and gains may owe capital-gains tax (a 1031 exchange can defer both). Figures are a year-1 estimate at your 24.0% rate — not tax advice; consult a CPA.
Schools (NCES district)
- District
- Mesquite ISD
- NCES district ID
- 4830390
- Math proficiency
- 35% ▼ -11.00%
- Reading proficiency
- 32% ▼ -7.00%
- Median HH income
- $49,372
- Composite
- 29.06/100
- National rank
- #6606
- State rank
- #536 of 826 in TX
Livability — Mesquite
- Score
- 70/100
- State rank
- #358
- US rank
- #7743
Category grades
Schools grade is shown separately in the Schools card above.
Census & demographics
- Census place
- Mesquite, TX
- County
- Dallas County · 2,612,404 people
- City population
- 150,788
- Metro
- Dallas-Fort Worth-Arlington, TX
- Population (ZIP)
- 58,262
- Household income
- $70,774
- Rent vs Own
- Severe rent burden
- 2266.0
Population outlook (Dallas County) Hauer SSP2
- Today (2025)
- 2,979,839 people
- By 2030
- 3,191,823 · +7.1%
- By 2040
- 3,619,611 · +21.5%
- By 2050
- 4,026,915 · +35.1%
- By 2075
- 4,957,073 · +66.4%
- By 2100
- 5,508,725 · +84.9%
Race, ethnicity, and origin ACS 2023
- Neighborhood character
- Diverse neighborhood (Simpson 0.65)
- Race & ethnicity
- Hispanic / Latino 49% White 25% Two or more races 21% Black 20% Asian 2% Native American 1%
- Hispanic origin (detail)
- Mexican 42% Cuban 1%
- Common ancestry
- Italian 1% Iranian 1% Serbian 1%
- Foreign-born
- 22% · Canada, Vietnam
- Languages at home
- 58% English-only · Spanish 39% Other Asian/Pacific 1% Vietnamese 1%
Political lean MEDSL · Dallas
- 2024 margin
- Strong D (+22.2) · D 60.2% · R 38.0% · Other 1.8%
- 2008→2024 swing
- +6.9pp toward D · 2008: 15.3pp · 2024: 22.2pp
- All cycles
- 2024: D+22.2 2020: D+31.6 2016: D+26.2 2012: D+15.4 2008: D+15.3
Not yet ingested
- Civics
- —
Market trends
- HPI YoY
- ▼ -130.12%
- Current HPI
- 345.6606
- Rent YoY
- ▲ 0.22%
- Metro
- Dallas-Fort Worth-Arlington, TX
- State GDP YoY
- ▲ 3.95%
- F500 in state
- 110
Industry mix (Fortune 500 HQ in TX)
| Industry | F500 HQs | Revenue |
|---|---|---|
| Energy | 16 | $1,198B |
|
||
| Technology | 5 | $198B |
|
||
| Engineering / Construction | 4 | $72B |
|
||
| Energy Services | 3 | $60B |
|
||
| Utilities | 3 | $41B |
|
||
| Healthcare | 2 | $330B |
|
||
Price history
+8904.3% since first listed10 events — show timeline
- 2026-04-04 Pending — NTREIS
- 2026-03-27 Contingent — NTREIS
- 2026-03-21 Relisted — NTREIS
- 2026-03-11 Contingent — NTREIS
- 2026-02-28 Listed $189,000 NTREIS
- 2026-02-16 Rental Removed $2,079 Tricon
- 2026-01-14 Price Changed $2,079 Tricon
- 2026-01-05 Listed for Rent $2,099 Tricon
- 2010-05-06 Sold (Public Records) — Public Records
- 2010-05-06 Sold (Public Records) — Public Records
Property tax history
+4.6%/yrLatest (2025): $5,796 · +1.1% YoY. Source: county tax records.
Cash-flow waterfall
monthlySold comps — $/sqft
last 12 mo · ≤1 miLoading sold comps…