 Multi-family
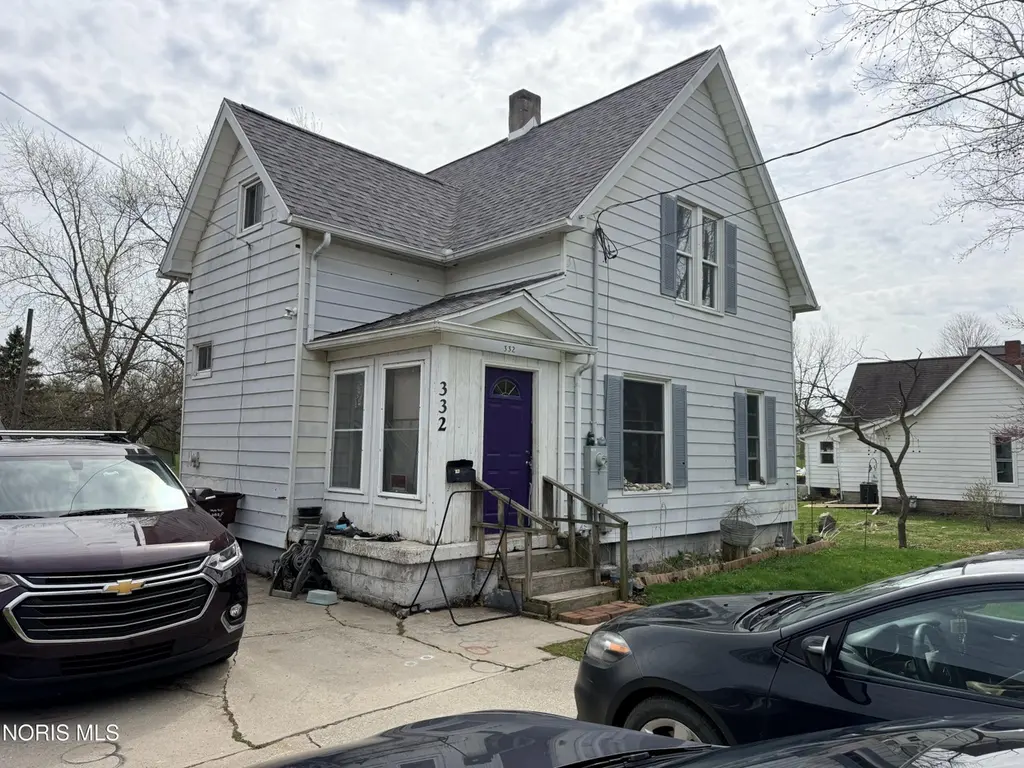
332 Lafayette St · Montpelier, OH
Flood risk 7/10 · Major
- FEMA flood zone
- X
- Chance of flooding over 30 yrs
- 0.76%
- Est. flood insurance / yr
- $473 – $860
Fire risk 1/10 · Minimal
- Est. fire insurance / yr
- $713 – $1,323
Heat risk 3/10 · Minor
- Hot days now (above 99°F)
- 7 days/yr
- Hot days in 30 yrs
- 17 days/yr
Wind risk 2/10 · Minimal
- Chance of severe wind over 30 yrs
- —
Air-quality risk 2/10 · Minimal
- Unhealthy air days now
- 1 days/yr
- Unhealthy air days in 30 yrs
- 2 days/yr
Risk factors via First Street. Map © Google.
Why this score? — see what drove the C grade
The composite is a weighted blend of 9 inputs, each scored 0–100. Each bar is that input's sub-score; the figure is the points it added to the 100-point composite (weight × sub-score).
- Cash flow +22.5/30.0
- ARV discount +7.5/15.0
- DSCR +7.2/10.0
- 1% rule +5.1/10.0
- Schools +4.7/10.0
- Livability +3.2/5.0
- Rent growth +2.5/5.0
- Condition / age +2.5/5.0
- Appreciation +0.0/10.0
$114,900
🖨 Deal sheet 📄 Offer letter ✓ Due diligence
Multi-family units
County records classify this as Multi-Family (2-4 Unit). Listing-text estimate: 1 unit. estimate disagrees with records
Listing remarks
Spacious three-bedroom, two full-bath home situated on a half-acre lot with plenty of natural light throughout. This property offers a flexible layout and could easily be converted back to a duplex, making it a great option for investors, multi-generational living, or buyers looking for added income potential. Enjoy generous living space, a bright and welcoming feel, and room to expand, garden, entertain, or simply relax outdoors. A versatile property with excellent potential!
Key facts
- 0.51 acre lot
- Built 1920
- Listed 11 days
Property features AI
Exterior
- Parking: Concrete driveway
- Utilities: Cable connected; Electricity connected; Natural gas connected; Sewer connected (public sewer); Water connected (public); Internet connected
- Home design: Single-family house; Two levels
- Construction: Aluminum siding; Block foundation; Block basement
- Exterior features: Shingle roof
Interior
- Kitchen: Kitchen on the main level
- Bedrooms: Bedroom 2 on the upper level; Bedroom 3 on the upper level; Bedroom 4 on the upper level
- Flooring: Carpet; Wood
- Bathrooms: 2 bathrooms
- Heating & cooling: Forced air heating; Natural gas heating; Has heating
- Interior features: Six total rooms; Other interior features
- Laundry & utility: Laundry located in the basement
Neighborhood map
What this means for you Summary
Snapshot
- This is a 3-bed/2.0-bath multifamily listed at $115k.
Deal economics
- At list price, monthly cash flow is $138 ($2k/yr) — positive.
- The deal already cash-flows at list — no discount required.
- Meets the 1% rule at list price ($1k rent vs $115k).
Location & tenants
- Location reads 65/100 on livability (#703 in OH) — a middle-class / working-renter tenant base. Strengths: cost of living A+, housing A+; Watch: amenities F, commute F, employment F.
- Montpelier Exempted Village (rural): math 53% / reading 59% proficiency, ranked #364 of 656 in OH (top 56%) — acceptable for families but not a draw, mixed tenant base, ~2y average lease.
- Zoned schools: Montpelier High School (math 47% / reading 67%, grade C, #275 of 781 statewide, top 37%, 325 students, 0% FRL) — zoned schools average 0% FRL vs 37% district-wide (37 pts lower); this property's tenant base skews higher-income than the district average.
- Market conditions: 59 active listings in the ZIP; 40 units permitted in Williams County in 2024 (0 in 5+ unit buildings).
Forward outlook
- Local home prices are declining (-3.0%/yr); year-one equity from $794 of loan paydown is wiped out by about $3k of value loss. Plan a longer hold.
- Williams County population projected at -14% by 2050 — secular population decline; favor cash flow + early exit over multi-decade hold.
Negotiation context
- Only 11 days on market — expect competitive offers; lowballing is unlikely to land.
- Current owner paid $55k; list at $115k implies a 110% gain — meaningful room to come down on a strong offer.
Risks & watch-outs
- Watch-outs: flood insurance adds $56/mo; built in 1920 — expect roof / HVAC / electrical / plumbing capex.
- Climate carrying-cost: major flood risk — expect insurance premiums to compound above CPI over the hold.
Questions for the listing agent
- Built in 1920 — when were the roof, HVAC, electrical panel, plumbing, and water heater last replaced?
- What's the actual annual flood-insurance premium (NFIP or private), and is the property in a SFHA with mandatory coverage?
- Is there a deadline driving the sale (1031 exchange, divorce, estate, relocation)? That informs how much negotiation room exists.
- What's the average days-on-market for RENTAL listings here right now (not sales)? A rising rental-DOM trend means longer vacancies and softer asking-rent achievability than the comps imply.
- What's the recent tenant-quality profile in this submarket — average credit score on applications, eviction rate, late-payment / NSF rate, and stable-employment percentage? A property-management company in the area should have these aggregated.
- How much new apartment / multifamily construction is in the pipeline within 1–3 miles? Heavy new supply (>2% of stock underway) typically softens rents 12–24 months out; light construction supports rent growth.
Investment metrics
- 1% rule
- 1.01% ✓
- Cap rate
- 8.32%
- Cash-on-cash
- 7.23%
- DSCR
- 1.32
- GRM
- 8.2
CMA / ARV
No comps found within radius.
Projected returns pro-forma
-3.0% appreciation · 3.0% rent growth · sell at horizon
- IRR
- -8.3%
- Equity multiple
- 0.70×
- Total profit
- $-9,796
- Equity at exit
- $17,132
- IRR
- 1.3%
- Equity multiple
- 1.09×
- Total profit
- $2,855
- Equity at exit
- $9,934
Cash invested: $32,172 (down + closing). Projections, not guarantees.
Landlord ↔ Tenant lean methodology
- Overall (STATE)
- 73 Landlord-Friendly
- State Ohio
- 73 Landlord-Friendly · R+6
- County
- — inherits STATE
- City
- — inherits STATE
ZIP-level market 43543
- Home prices YoY
- -14.4%
- Active inventory
- 59
- Price-to-rent
- 8.2×
Monthly cashflow live
- Estimated rent
- $1,162 medium interval (Pro) →
- Mortgage (P&I)
- −$603
- Tax from tax record
- −$74 /mo · $883/yr
- Insurance
- −$48
- Flood insurance flood zone
- −$56 /mo · $666/yr
- HOA
- −$0
- Vacancy / Maint / Mgmt
- −$244
- Net cashflow
- $138
Break-even live
UW: 25.0% down · 7.5% · 30yr · 1.5% tax · 5.0% vac · 8.0% maint · 8.0% mgmt
Financing live
Cash to close
- Down payment
- $28,725
- Closing costs
- $3,447
- Reserves months
- —
- Total cash needed
- —
Loan-product check · same deal, 3 products live
Conventional
25% down · 7.5% · 30yr
- Down + closing
- —
- Monthly P&I
- —
- Monthly cashflow
- —
- DSCR
- —
- Eligible?
- —
Personal DTI + credit; lowest rate.
DSCR
20% down · 8.5% · 30yr
- Down + closing
- —
- Monthly P&I
- —
- Monthly cashflow
- —
- DSCR
- —
- Eligible?
- —
No personal income docs; deal must DSCR.
Hard money
10% down · 12.0% · 12mo
- Down + closing
- —
- Monthly P&I
- —
- Monthly cashflow
- —
- DSCR
- —
- Eligible?
- —
Short-term bridge; refi at stabilization.
Listing history 19 events
-
2026-06-18days on market $114,900 Active 11 DOM
-
2026-06-17days on market $114,900 Active 10 DOM
-
2026-06-16days on market $114,900 Active 9 DOM
-
2026-06-15days on market $114,900 Active 8 DOM
-
2026-06-13days on market $114,900 Active 6 DOM
-
2026-06-12days on market $114,900 Active 5 DOM
-
2026-06-09days on market $114,900 Active 2 DOM
-
2026-06-08statusdays on market $114,900 Active 1 DOM
-
2026-06-05days on market $114,900 Coming Soon 19 DOM
-
2026-06-04days on market $114,900 Coming Soon 17 DOM
-
2026-06-02days on market $114,900 Coming Soon 16 DOM
-
2026-06-01days on market $114,900 Coming Soon 15 DOM
-
2026-05-31days on market $114,900 Coming Soon 14 DOM
-
2026-05-17historical $114,900
-
2018-09-21soldstatus $54,600
-
2014-05-31historical
-
2013-06-21$58,900
-
2000-11-06soldstatus $55,000
-
1985-04-24soldstatus $25,000
ⓘ Source: listings_history table (triggers on properties + properties_extension) + one-shot
backfill from property_details.listing_events for pre-trigger history.
Tax reassessment forecast OH · Partial reset (capped growth)
- Current annual tax
- $883 · $74/mo
- Projected year-2 tax
- $1,338 · $111/mo
- Expected delta
- +$455/yr (+$38/mo · 51.5%)
ⓘ Screening estimate from a state-policy table — verify with the county assessor before closing.
Climate risk First Street
- Flood 7/10 Severe FEMA zone X · 76% chance over 30 yrs
- Wildfire 1/10 Low
- Heat 3/10 Moderate 7 d/yr ≥99°F today · 17 d/yr by 30 yrs out
- Wind 2/10 Low
- Air quality 2/10 Low 1 unhealthy d/yr today · 2 by 30 yrs out
Nearby sold comps map
Loading sold comps map…
Walkable amenities ~0.75 mi
Loading nearby amenities…
Taxation est. · year 1
- Rental income
- $13,943
- − Mortgage interest
- −$6,436
- − Property taxes
- −$883
- − Insurance
- −$1,241
- − Repairs & maintenance
- −$1,115
- − Management
- −$1,115
- − Depreciation
- −$3,343
- Taxable loss
- −$190
- Est. tax savings @ 24.0%
- +$46
- After-tax cash flow
- $1,706/yr
For passive investors: Depreciation is non-cash, so a rental often shows a tax loss while cash-flowing — sheltering income. Rental losses are passive: they offset passive income freely, and up to $25,000/yr can offset ordinary (W-2) income if you actively participate and your MAGI is under $100k (phasing out to $0 by $150k); unused losses carry forward. On sale, claimed depreciation is recaptured at up to 25%, and gains may owe capital-gains tax (a 1031 exchange can defer both). Figures are a year-1 estimate at your 24.0% rate — not tax advice; consult a CPA.
Schools (NCES district)
- District
- Montpelier Exempted Village
- NCES district ID
- 3904552
- Math proficiency
- 53% ▼ -15.00%
- Reading proficiency
- 59% ▼ -7.00%
- Median HH income
- $42,289
- Composite
- 47.0/100
- National rank
- #2348
- State rank
- #364 of 656 in OH
Livability — Montpelier
- Score
- 65/100
- State rank
- #703
- US rank
- #12583
Category grades
Schools grade is shown separately in the Schools card above.
Census & demographics
- Census place
- Montpelier, OH
- County
- Williams · 37,585 people
- Population (ZIP)
- 7,476
- Household income
- $60,685
- Rent vs Own
- Severe rent burden
- 8.5
Population outlook (Williams County) Hauer SSP2
- Today (2025)
- 36,125 people
- By 2030
- 35,264 · -2.4%
- By 2040
- 33,264 · -7.9%
- By 2050
- 31,072 · -14.0%
- By 2075
- 26,553 · -26.5%
- By 2100
- 21,318 · -41.0%
Race, ethnicity, and origin ACS 2023
- Neighborhood character
- Predominantly White (94%)
- Race & ethnicity
- White 94% Hispanic / Latino 3% Two or more races 3%
- Common ancestry
- Romanian 4% Lithuanian 3% Slovak 3%
- Foreign-born
- 1% · Canada, China
- Languages at home
- 97% English-only · Spanish 2%
Political lean MEDSL · Williams
- 2024 margin
- Solid R (+48.2) · D 25.4% · R 73.7%
- 2008→2024 swing
- -39.0pp toward R · 2008: -9.3pp · 2024: -48.2pp
- All cycles
- 2024: R+48.2 2020: R+46.2 2016: R+43.8 2012: R+16.3 2008: R+9.3
Not yet ingested
- Civics
- —
Market trends
- HPI YoY
- ▼ -36.11%
- Current HPI
- 214.9648
- Rent YoY
- —
- Metro
- —
- State GDP YoY
- ▲ 1.98%
- F500 in state
- 48
Industry mix (Fortune 500 HQ in OH)
| Industry | F500 HQs | Revenue |
|---|---|---|
| Insurance | 3 | $145B |
|
||
| Industrial Machinery | 3 | $49B |
|
||
| Financial Services | 3 | $24B |
|
||
| Consumer Goods | 2 | $93B |
|
||
| Aerospace / Defense | 2 | $47B |
|
||
| Utilities | 2 | $33B |
|
||
Price history
+359.6% since first listed6 events — show timeline
- 2026-05-17 Coming Soon $114,900 NORIS
- 2018-09-21 Sold (Public Records) $54,600 Public Records
- 2014-05-31 Listing Removed — NORIS
- 2013-06-21 Listed $58,900 NORIS
- 2000-11-06 Sold (Public Records) $55,000 Public Records
- 1985-04-24 Sold (Public Records) $25,000 Public Records
Property tax history
+3.6%/yrLatest (2025): $883 · +0.0% YoY. Source: county tax records.
Cash-flow waterfall
monthlySold comps — $/sqft
last 12 mo · ≤1 miLoading sold comps…