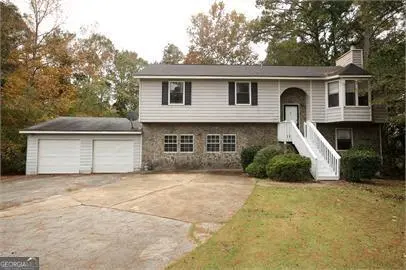
5960 Bluebonnet Cir · South Fulton, GA
Flood risk 1/10 · Minimal
- FEMA flood zone
- X (unshaded)
- Chance of flooding over 30 yrs
- 0.0%
- Est. flood insurance / yr
- $507 – $1,088
Fire risk 3/10 · Minor
- Est. fire insurance / yr
- $963 – $1,789
Heat risk 6/10 · Moderate
- Hot days now (above 105°F)
- 7 days/yr
- Hot days in 30 yrs
- 18 days/yr
Wind risk 6/10 · Moderate
- Chance of severe wind over 30 yrs
- 27.0%
Air-quality risk 4/10 · Minor
- Unhealthy air days now
- 4 days/yr
- Unhealthy air days in 30 yrs
- 6 days/yr
Risk factors via First Street. Map © Google.
Why this score? — see what drove the C grade
The composite is a weighted blend of 9 inputs, each scored 0–100. Each bar is that input's sub-score; the figure is the points it added to the 100-point composite (weight × sub-score).
- ARV discount +15.0/15.0
- Cash flow +13.2/30.0
- Appreciation +10.0/10.0
- Schools +4.5/10.0
- DSCR +4.0/10.0
- 1% rule +3.7/10.0
- Rent growth +2.7/5.0
- Livability +2.5/5.0
- Condition / age +2.5/5.0
$217,900
🖨 Deal sheet (PDF) 📄 Offer letter ✓ Due diligence
Listing remarks MLS
BANK OWNED. LARGE HOME WITH: FAMILY ROOM, LARGE BASEMENT FOR PLAY ROOM/OFFICE, LARGE LOT, AND CONVENIENT TO EXPRESSWAY.
Key facts
- 0.56 acre lot
- Garage
- Built 1980
Property features AI
Finance
- Other: Home warranty included
- HOA & community: No HOA
Exterior
- Parking: Garage; Off-street parking; Parking pad; Open parking available
- Utilities: Public water; Private sewer; Electricity available; Natural gas available
- Home design: Single-family residence; House; Residential resale
- Construction: Built in 1980; Wood siding; Composition roof
- Exterior features: Level lot
Interior
- Kitchen: Country-style kitchen
- Bedrooms: 4 bedrooms (1 on the lower level)
- Flooring: Carpet; Laminate
- Bathrooms: 3 full bathrooms; 1 half bathroom; Lower level has 1 full bathroom and 1 half bathroom
- Heating & cooling: Central heating; Central air conditioning
- Interior features: Multi/split levels; Daylight basement; Bonus room; 2 fireplaces
- Laundry & utility: Laundry in basement
Neighborhood map
What this means for you Summary
Snapshot
- This is a 3-bed/2.0-bath single-family listed at $218k.
Deal economics
- At list price, monthly cash flow is $-5 ($-62/yr) — negative.
- To cash-flow at today's rent, offer at most $217k (0.4% below list).
- To meet the 1% rule (rent ≥ 1% of price), the offer needs to be $189k (13.4% below list).
- Recommended offer: $189k (13.4% below list) — sets the bar for 1% rule.
Location & tenants
- Location reads: area grade C — affects rentability + tenant quality, not the cash-flow math above.
- Fulton County (suburban): math 49% / reading 53% proficiency, ranked #12 of 174 in GA (top 7%) — acceptable for families but not a draw, mixed tenant base, ~2y average lease.
- Zoned schools: Bethune Elementary School (math 17% / reading 22%, grade F, #878 of 1,228 statewide, top 75%, 524 students, 100% FRL); Bear Creek Middle School (math 17% / reading 26%, grade F, #339 of 470 statewide, top 72%, 1,108 students, 100% FRL); Langston Hughes High School (math 8% / reading 17%, grade F, #336 of 424 statewide, top 80%, 1,964 students, 65% FRL) — zoned schools average 88% FRL vs 41% district-wide (47 pts higher); higher-poverty schools than district average — tighter screening recommended.
- Zoned-school proficiency averages 18% at this address vs 51% district-wide (-33 pts) — the specific schools serving this property underperform the Fulton County average; the district grade overstates school quality for this exact location.
- Market conditions: Rents flat; 656 active listings in the ZIP; 40 comparable units currently listed for rent nearby; rentals at typical pace (median 25d on market — plan ~3-4 weeks tenant-placement turnaround); 11,565 units permitted in Fulton County in 2024 (8,159 in 5+ unit buildings).
Forward outlook
- In year one you build about $23k of equity ($2k loan paydown + $22k appreciation (10.0% local appreciation)).
- Fulton County population projected at +38% by 2050 — long-run rental-demand tailwind backs the buy-and-hold thesis.
- At projected returns (10.0% appreciation + 0.9% rent growth), your $61k cash investment doubles in ~3 years — after that, you're playing with house money.
- By year 2, paydown + projected appreciation supports a ~$37k cash-out refi (75% LTV) — recoverable capital for the next deal without selling this one.
Negotiation context
- Only 13 days on market — expect competitive offers; lowballing is unlikely to land.
- 6 sale attempts since 14y ago with the ask held roughly flat each time — persistent listings suggest the price (not the market) is what's stuck; bring a comps-based counter.
- Current owner paid $74k; list at $218k implies a 194% gain — meaningful room to come down on a strong offer.
Risks & watch-outs
- Climate carrying-cost: major wind risk, 27% chance of damaging wind over 30y; extreme-heat days projected 7→18/yr by 2055 (HVAC capex compounding) — expect insurance premiums to compound above CPI over the hold.
Questions for the listing agent
- What do current leases actually rent for vs. the listed asking? Can we see a recent rent roll and the last 12 months of T-12 income?
- Is there a deadline driving the sale (1031 exchange, divorce, estate, relocation)? That informs how much negotiation room exists.
- What's the average days-on-market for RENTAL listings here right now (not sales)? A rising rental-DOM trend means longer vacancies and softer asking-rent achievability than the comps imply.
- What's the recent tenant-quality profile in this submarket — average credit score on applications, eviction rate, late-payment / NSF rate, and stable-employment percentage? A property-management company in the area should have these aggregated.
- How much new for-sale + rental construction is in the pipeline within 1–3 miles? Heavy new supply typically softens prices + rents 12–24 months out; constrained supply supports both.
Investment metrics
- 1% rule
- 0.87% ✗
- Cap rate
- 6.26%
- Cash-on-cash
- -0.10%
- DSCR
- 1.00
- GRM
- 9.6
CMA / ARV
- ARV (median comp)
- $334,310
- List price
- $217,900
- Delta
- -34.82%
- Verdict
- UNDERPRICED
- Comps
- 20 within 1.0 mi
Show comp detail 6 sales within ~0.75 mi
| Address | Dist | Beds/Ba | Sqft | Sold | Price | $/sf | Match |
|---|---|---|---|---|---|---|---|
| 5840 Old Bill Cook Rd | 0.35mi | 3/1.0 | 1,184 (-14%) | 7mo | $164,000 | $139 | 50 |
| 2950 Harper Valley Dr | 0.74mi | 3/2.0 | 1,367 (-1%) | 20mo | $155,000 | $113 | 48 |
| 5870 Sable Glen Rd | 0.56mi | 4/3.0 (+1) | 1,450 (+5%) | 12mo | $243,000 | $168 | 47 |
| 3382 Sable Chase Ln | 0.52mi | 4/3.0 (+1) | 1,435 (+4%) | 19mo | $250,000 | $174 | 44 |
| 3401 Sumersbe Ct #1 | 0.53mi | 3/3.5 | 1,491 (+8%) | 18mo | $291,989 | $196 | 41 |
| 6215 Lamp Post Pl | 0.60mi | 3/2.0 | 1,562 (+13%) | 17mo | $200,000 | $128 | 36 |
Match score weights: distance 35% · size 25% · config 20% · recency 20%. Top-matched comps best support the ARV.
Projected returns pro-forma
10.0% appreciation · 0.95% rent growth · sell at horizon
- IRR
- 23.5%
- Equity multiple
- 2.88×
- Total profit
- $114,553
- Equity at exit
- $196,302
- IRR
- 20.5%
- Equity multiple
- 6.42×
- Total profit
- $330,531
- Equity at exit
- $423,332
Cash invested: $61,012 (down + closing). Projections, not guarantees.
Landlord ↔ Tenant lean methodology
- Overall (STATE)
- 90 Strongly Landlord-Friendly
- State Georgia
- 90 Strongly Landlord-Friendly · R+3
- County
- — inherits STATE
- City
- — inherits STATE
ZIP-level market 30349
- Home prices YoY
- 4.6%
- Rents YoY
- 0.9%
- Active inventory
- 656
- Price-to-rent
- 9.6×
Monthly cashflow live
- Estimated rent
- $1,887 high interval (Pro) →
- Mortgage (P&I)
- −$1,143
- Tax from tax record
- −$263 /mo · $3,152/yr
- Insurance
- −$91
- HOA
- −$0
- Vacancy / Maint / Mgmt
- −$396
- Net cashflow
- $-5
Break-even live
Sensitivity live
| Price | -10% $118 | -5% $57 | +0% $-5 | +5% $-67 | +10% $-129 |
|---|---|---|---|---|---|
| Rent | -10% $-154 | -5% $-80 | +0% $-5 | +5% $69 | +10% $144 |
| Rate | -1.0pp $105 | -0.5pp $50 | base $-5 | +0.5pp $-62 | +1.0pp $-119 |
UW: 25.0% down · 7.5% · 30yr · 1.5% tax · 5.0% vac · 8.0% maint · 8.0% mgmt
Financing live
Cash to close
- Down payment
- $54,475
- Closing costs
- $6,537
- Reserves months
- —
- Total cash needed
- —
Loan-product check · same deal, 3 products live
Conventional
25% down · 7.5% · 30yr
- Down + closing
- —
- Monthly P&I
- —
- Monthly cashflow
- —
- DSCR
- —
- Eligible?
- —
Personal DTI + credit; lowest rate.
DSCR
20% down · 8.5% · 30yr
- Down + closing
- —
- Monthly P&I
- —
- Monthly cashflow
- —
- DSCR
- —
- Eligible?
- —
No personal income docs; deal must DSCR.
Hard money
10% down · 12.0% · 12mo
- Down + closing
- —
- Monthly P&I
- —
- Monthly cashflow
- —
- DSCR
- —
- Eligible?
- —
Short-term bridge; refi at stabilization.
Rent comps 40 comps
| Address | Beds | Baths | Sqft | Rent | $/sqft | DOM | Units | Dist |
|---|---|---|---|---|---|---|---|---|
| 5750 Buffington Rd Atlanta, GA | 1.0–3.0 | 1.0–2.0 | 1142 | $1,642 | $1.44 | 0d | 18 | 0.37mi |
| 6230 Cedar Wood Dr Atlanta, GA | 3.0 | 2.0 | 1238 | $1,694 | $1.37 | 44d | 1 | 0.45mi |
| 5740 Buffington Rd Atlanta, GA | 1.0–3.0 | 1.0–2.5 | 964 | $2,181 | $2.26 | 0d | 15 | 0.48mi |
| 3457 Sumersbe Ct Atlanta, GA | 3.0 | 2.5 | 1800 | $2,300 | $1.28 | 6d | 1 | 0.60mi |
| 2865 Spruce Point Rd Atlanta, GA | 4.0 | 2.0 | 1050 | $1,910 | $1.82 | 44d | 1 | 0.64mi |
| 3240 Devilla Trce South Fulton, GA | 4.0 | 2.0 | 1616 | $1,980 | $1.23 | 44d | 1 | 0.67mi |
| 3477 Carriage Chase Rd Atlanta, GA | 4.0 | 3.0 | 1545 | $2,000 | $1.29 | 25d | 1 | 0.69mi |
| 3514 Devon Chase Rd Atlanta, GA | 3.0 | 2.0 | 1540 | $1,720 | $1.12 | 44d | 1 | 0.74mi |
| 3027 Sable Run Rd Atlanta, GA | 3.0 | 3.0 | 1808 | $2,080 | $1.15 | 44d | 1 | 0.79mi |
| 3364 Estes Dr Atlanta, GA | 3.0 | 2.5 | 1736 | $1,889 | $1.09 | 17d | 1 | 0.80mi |
| 3022 Sable Run Rd Atlanta, GA | 3.0 | 2.5 | 1748 | $1,955 | $1.12 | 4d | 1 | 0.81mi |
| 6415 El Caudillo Ct Atlanta, GA | 3.0 | 3.0 | 1498 | $2,800 | $1.87 | 5d | 1 | 0.87mi |
| 6120 Hemperly Rd Atlanta, GA | 4.0 | 2.5 | 1770 | $2,100 | $1.19 | 25d | 1 | 0.91mi |
| 6120 Hemperly Rd Atlanta, GA | 4.0 | 2.5 | 1770 | $2,100 | $1.19 | 4d | 1 | 0.91mi |
| 6056 Carriage Ct Atlanta, GA | 3.0 | 2.0 | 1400 | $1,549 | $1.11 | 0d | 1 | 0.95mi |
| 5825 Vernier Dr Atlanta, GA | 3.0 | 2.0 | 1346 | $1,615 | $1.20 | 6d | 1 | 0.95mi |
| 5825 Vernier Dr Atlanta, GA | 3.0 | 2.0 | 1346 | $1,615 | $1.20 | 25d | 1 | 0.95mi |
| 5825 Vernier Dr Atlanta, GA | 3.0 | 2.0 | 1346 | $1,615 | $1.20 | 21d | 1 | 0.95mi |
| 5825 Vernier Dr Atlanta, GA | 3.0 | 2.0 | 1346 | $1,615 | $1.20 | 44d | 1 | 0.95mi |
| 3650 Creekview Cir Atlanta, GA | 3.0 | 3.5 | 1225 | $1,689 | $1.38 | 13d | 1 | 0.97mi |
| 5712 Westhill Cir Atlanta, GA | 4.0 | 2.0 | 1441 | $1,710 | $1.19 | 4d | 1 | 0.98mi |
| 6345 Peppermill Ln Atlanta, GA | 3.0 | 2.5 | 1224 | $1,800 | $1.47 | 44d | 1 | 1.00mi |
| 5690 Hampton Ct Atlanta, GA | 2.0 | 3.0 | 1184 | $1,495 | $1.26 | 44d | 1 | 1.01mi |
| 5645 Deerfield Trl Atlanta, GA | 3.0 | 1.5 | 1496 | $1,495 | $1.00 | 23d | 1 | 1.04mi |
| 3509 Augusta St Atlanta, GA | 3.0 | 2.5 | 1588 | $2,006 | $1.26 | 44d | 1 | 1.05mi |
| 5460 Hampton Ct Atlanta, GA | 2.0 | 3.5 | 1554 | $1,500 | $0.97 | 44d | 1 | 1.05mi |
| 2890 Jerome Rd Atlanta, GA | 3.0 | 1.5 | 1229 | $1,731 | $1.41 | 0d | 1 | 1.06mi |
| 2560 Foxlair Trl Atlanta, GA | 4.0 | 2.0 | 1485 | $1,795 | $1.21 | 25d | 1 | 1.08mi |
| 6560 Emerald Pointe Cir Atlanta, GA | 3.0 | 2.0 | 1309 | $1,500 | $1.15 | 23d | 1 | 1.09mi |
| 3715 Clearwater Dr Atlanta, GA | 4.0 | 2.0 | 1482 | $4,400 | $2.97 | 44d | 1 | 1.09mi |
| 3550 Morning Creek Dr Atlanta, GA | 4.0 | 2.0 | 1400 | $1,730 | $1.24 | 13d | 1 | 1.12mi |
| 6090 Emerald Pointe Cir Atlanta, GA | 3.0 | 2.0 | 1200 | $1,875 | $1.56 | 19d | 1 | 1.14mi |
| 3695 Morning Creek Dr Atlanta, GA | 3.0 | 2.0 | 1491 | $2,100 | $1.41 | 44d | 1 | 1.16mi |
| 3105 Garnet Way Atlanta, GA | 3.0 | 2.0 | 1470 | $1,660 | $1.13 | 13d | 1 | 1.16mi |
| 6450 Peppermill Ln Atlanta, GA | 4.0 | 2.0 | 1188 | $1,531 | $1.29 | 25d | 1 | 1.18mi |
| 5410 Twin Lakes Dr Atlanta, GA | 3.0 | 2.0 | 1277 | $2,040 | $1.60 | 44d | 1 | 1.20mi |
| 320 Emerald Green Ct Atlanta, GA | 3.0 | 2.0 | 1575 | $2,050 | $1.30 | 44d | 1 | 1.20mi |
| 855 Old Rocky Rd Atlanta, GA | 3.0 | 2.0 | 1310 | $1,710 | $1.31 | 25d | 1 | 1.21mi |
| 2555 Flat Shoals Rd #404 College Park, GA | 3.0 | 2.5 | 1408 | $1,700 | $1.21 | 25d | 1 | 1.23mi |
| 2555 Flat Shoals Rd #3005 Atlanta, GA | 3.0 | 2.5 | 1724 | $1,850 | $1.07 | 6d | 1 | 1.27mi |
Listing history 22 events
-
2026-05-11status Under Contract 114-char remark
-
2026-04-09$217,900 New 114-char remark
-
2025-09-09price $1,895
-
2025-06-30$2,400
-
2018-03-11historical
-
2018-03-09status Back on Market
-
2018-02-08status Under Contract
-
2017-11-01$125,000 New
-
2015-05-14price $22,900
Show marketing remark (119 chars)
BANK OWNED. LARGE HOME WITH: FAMILY ROOM, LARGE BASEMENT FOR PLAY ROOM/OFFICE, LARGE LOT, AND CONVENIENT TO EXPRESSWAY.
-
2013-05-21soldstatus $74,000
-
2012-05-22historical
-
2012-05-08soldstatus $25,500 Sold
Show marketing remark (119 chars)
BANK OWNED. LARGE HOME WITH: FAMILY ROOM, LARGE BASEMENT FOR PLAY ROOM/OFFICE, LARGE LOT, AND CONVENIENT TO EXPRESSWAY.
-
2012-05-08soldstatus $25,500 Sold
Show marketing remark (119 chars)
BANK OWNED. LARGE HOME WITH: FAMILY ROOM, LARGE BASEMENT FOR PLAY ROOM/OFFICE, LARGE LOT, AND CONVENIENT TO EXPRESSWAY.
-
2012-04-26status Pending
-
2012-04-25historical Contingent - Due Diligence
-
2012-04-24historical
Show marketing remark (119 chars)
BANK OWNED. LARGE HOME WITH: FAMILY ROOM, LARGE BASEMENT FOR PLAY ROOM/OFFICE, LARGE LOT, AND CONVENIENT TO EXPRESSWAY.
-
2012-04-23price $25,500
Show marketing remark (119 chars)
BANK OWNED. LARGE HOME WITH: FAMILY ROOM, LARGE BASEMENT FOR PLAY ROOM/OFFICE, LARGE LOT, AND CONVENIENT TO EXPRESSWAY.
-
2012-03-30price $22,900
Show marketing remark (119 chars)
BANK OWNED. LARGE HOME WITH: FAMILY ROOM, LARGE BASEMENT FOR PLAY ROOM/OFFICE, LARGE LOT, AND CONVENIENT TO EXPRESSWAY.
-
2012-03-30price $22,900
Show marketing remark (119 chars)
BANK OWNED. LARGE HOME WITH: FAMILY ROOM, LARGE BASEMENT FOR PLAY ROOM/OFFICE, LARGE LOT, AND CONVENIENT TO EXPRESSWAY.
-
2012-03-14$35,000 Active
Show marketing remark (119 chars)
BANK OWNED. LARGE HOME WITH: FAMILY ROOM, LARGE BASEMENT FOR PLAY ROOM/OFFICE, LARGE LOT, AND CONVENIENT TO EXPRESSWAY.
-
2012-03-14$35,000 New
Show marketing remark (119 chars)
BANK OWNED. LARGE HOME WITH: FAMILY ROOM, LARGE BASEMENT FOR PLAY ROOM/OFFICE, LARGE LOT, AND CONVENIENT TO EXPRESSWAY.
-
1984-11-16soldstatus $75,400
ⓘ Source: listings_history table (triggers on properties + properties_extension) + one-shot
backfill from property_details.listing_events for pre-trigger history.
Tax reassessment forecast GA · Resets to sale price
- Current annual tax
- $3,152 · $263/mo
- Projected year-2 tax
- $3,152 · $263/mo
- Expected delta
- $0/yr ($0/mo · 0.0%)
ⓘ Screening estimate from a state-policy table — verify with the county assessor before closing.
Climate risk First Street
- Flood 1/10 Low FEMA zone X (unshaded) · 0% chance over 30 yrs
- Wildfire 3/10 Moderate
- Heat 6/10 Major 7 d/yr ≥105°F today · 18 d/yr by 30 yrs out
- Wind 6/10 Major 27% chance of damaging wind over 30 yrs
- Air quality 4/10 Moderate 4 unhealthy d/yr today · 6 by 30 yrs out
Nearby sold comps map
Loading sold comps map…
Walkable amenities ~0.75 mi
Loading nearby amenities…
Taxation est. · year 1
- Rental income
- $22,648
- − Mortgage interest
- −$12,206
- − Property taxes
- −$3,152
- − Insurance
- −$1,090
- − Repairs & maintenance
- −$1,812
- − Management
- −$1,812
- − Depreciation
- −$6,339
- Taxable loss
- −$3,762
- Est. tax savings @ 24.0%
- +$903
- After-tax cash flow
- $841/yr
For passive investors: Depreciation is non-cash, so a rental often shows a tax loss while cash-flowing — sheltering income. Rental losses are passive: they offset passive income freely, and up to $25,000/yr can offset ordinary (W-2) income if you actively participate and your MAGI is under $100k (phasing out to $0 by $150k); unused losses carry forward. On sale, claimed depreciation is recaptured at up to 25%, and gains may owe capital-gains tax (a 1031 exchange can defer both). Figures are a year-1 estimate at your 24.0% rate — not tax advice; consult a CPA.
Schools (NCES district)
- District
- Fulton County
- NCES district ID
- 1302280
- Math proficiency
- 49% ▼ -2.00%
- Reading proficiency
- 53% ▬ 0.00%
- Median HH income
- $68,035
- Composite
- 45.33/100
- National rank
- #2640
- State rank
- #12 of 174 in GA
Livability — South Fulton
No livability data for this city. (Only ~50 U.S. cities are tracked.)
Census & demographics
- Census place
- South Fulton, GA
- County
- Fulton County · 1,094,430 people
- City population
- 127,674
- Metro
- Atlanta-Sandy Springs-Alpharetta, GA
- Population (ZIP)
- 79,872
- Household income
- $67,023
- Rent vs Own
- Severe rent burden
- 4258.0
Population outlook (Fulton County) Hauer SSP2
- Today (2025)
- 1,203,707 people
- By 2030
- 1,299,706 · +8.0%
- By 2040
- 1,488,256 · +23.6%
- By 2050
- 1,664,580 · +38.3%
- By 2075
- 2,036,072 · +69.2%
- By 2100
- 2,222,402 · +84.6%
Race, ethnicity, and origin ACS 2023
- Neighborhood character
- Predominantly Black (89%)
- Race & ethnicity
- Black 89% Hispanic / Latino 5% Two or more races 4% White 3%
- Foreign-born
- 9% · Canada
- Languages at home
- 88% English-only · Spanish 6% French/Haitian/Cajun 1%
Political lean MEDSL · Fulton
- 2024 margin
- Solid D (+44.9) · D 71.9% · R 27.0% · Other 1.1%
- 2008→2024 swing
- +9.8pp toward D · 2008: 35.0pp · 2024: 44.9pp
- All cycles
- 2024: D+44.9 2020: D+46.4 2016: D+42.1 2012: D+29.6 2008: D+35.0
Not yet ingested
- Civics
- —
Market trends
- HPI YoY
- ▲ 18.01%
- Current HPI
- 407.99
- Rent YoY
- ▲ 0.95%
- Metro
- Atlanta-Sandy Springs-Alpharetta, GA
- State GDP YoY
- ▲ 2.66%
- F500 in state
- 28
Industry mix (Fortune 500 HQ in GA)
| Industry | F500 HQs | Revenue |
|---|---|---|
| Paper / Packaging | 2 | $29B |
|
||
| Retail | 1 | $160B |
|
||
| Transportation / Logistics | 1 | $91B |
|
||
| Airlines | 1 | $62B |
|
||
| Consumer Goods | 1 | $47B |
|
||
| Utilities | 1 | $25B |
|
||
Price history
-97.5% since first listed23 events — show timeline
- 2026-05-29 Rental Removed $1,895 BUILDIUM
- 2026-05-11 Pending — GAMLS
- 2026-04-09 Listed $217,900 GAMLS
- 2025-09-09 Price Changed $1,895 BUILDIUM
- 2025-06-30 Listed for Rent $2,400 BUILDIUM
- 2018-03-11 Listing Removed — GAMLS
- 2018-03-09 Relisted — GAMLS
- 2018-02-08 Pending — GAMLS
- 2017-11-01 Listed $125,000 GAMLS
- 2015-05-14 Price Changed $22,900 GAMLS
- 2013-05-21 Sold (Public Records) $74,000 Public Records
- 2012-05-22 Listing Removed — FMLS
- 2012-05-08 Sold (MLS) $25,500 GAMLS
- 2012-05-08 Sold (MLS) $25,500 FMLS
- 2012-04-26 Pending — FMLS
- 2012-04-25 Contingent — FMLS
- 2012-04-24 Listing Removed — GAMLS
- 2012-04-23 Price Changed $25,500 GAMLS
- 2012-03-30 Price Changed $22,900 GAMLS
- 2012-03-30 Price Changed $22,900 FMLS
- 2012-03-14 Listed $35,000 FMLS
- 2012-03-14 Listed $35,000 GAMLS
- 1984-11-16 Sold (Public Records) $75,400 Public Records
Property tax history
+6.4%/yrLatest (2025): $3,152 · -12.6% YoY. Source: county tax records.
Cash-flow waterfall
monthlySold comps — $/sqft
last 12 mo · ≤1 miLoading sold comps…