 Triplex
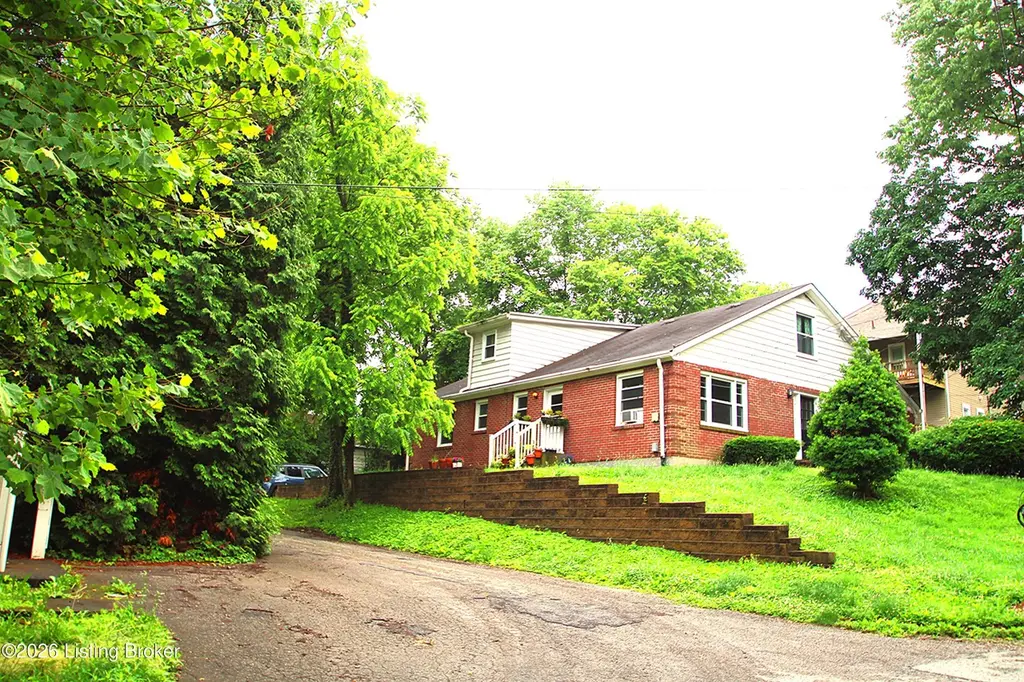
2332 Sycamore Ave · Louisville, KY
Flood risk 1/10 · Minimal
- FEMA flood zone
- X (unshaded)
- Chance of flooding over 30 yrs
- 0.0%
- Est. flood insurance / yr
- $507 – $1,088
Fire risk 1/10 · Minimal
- Est. fire insurance / yr
- $839 – $1,559
Heat risk 5/10 · Moderate
- Hot days now (above 105°F)
- 7 days/yr
- Hot days in 30 yrs
- 20 days/yr
Wind risk 2/10 · Minimal
- Chance of severe wind over 30 yrs
- 2.0%
Air-quality risk 3/10 · Minor
- Unhealthy air days now
- 2 days/yr
- Unhealthy air days in 30 yrs
- 4 days/yr
Risk factors via First Street. Map © Google.
Why this score? — see what drove the B- grade
The composite is a weighted blend of 9 inputs, each scored 0–100. Each bar is that input's sub-score; the figure is the points it added to the 100-point composite (weight × sub-score).
- Cash flow +30.0/30.0
- DSCR +10.0/10.0
- 1% rule +7.8/10.0
- ARV discount +7.5/15.0
- Rent growth +3.2/5.0
- Livability +3.2/5.0
- Condition / age +2.5/5.0
- Schools +2.3/10.0
- Appreciation +0.0/10.0
$399,900
🖨 Deal sheet 📄 Offer letter ✓ Due diligence
Multi-family units
County records classify this as Multi-Family (5+ Unit). Listing-text estimate: 3 units. estimate disagrees with records
5+ unit building — per-unit beds/baths from public records are typically unavailable; the breakdown below (if shown) is an estimate from the listing text.
Listing remarks MLS
Fully Leased! This is an excellent investment property is a highly convenient area. The owner pays for the water. The gas and the electric are separately meters. One of the units is discounted for general maintenance/mowing of the property.
Key facts
- Below-market rents
- Low vacancy rates
- Triplex
Tags
Property features AI
Finance
- Other: Subdivision: Clifton Heights; Lot approximately 0.21 acres (60 x 155)
- Financial info: Property is a triplex with multiple rental units (first level: 2 units renting at listed rents; second level: 1 unit; basement rent listed but appears anomalous); Additional storage available; Pets allowed
- HOA & community: No association fee
Exterior
- Parking: 6 parking spaces (not covered)
- Utilities: Electricity connected; Natural gas available; Owner pays some utilities (electric, gas, sewer, trash removal, water); tenants pay cable, electric, gas, sewer, water; Separate meters present
- Home design: Triplex property; Traditional style; Built in 1955; Asphalt roof; Brick construction
- Construction: Built in 1955; Brick construction; Asphalt roof; Living/building area reported as 2520
- Exterior features: No notable exterior features listed
Interior
- Kitchen: Multiple kitchens (2 on first level); Ranges included (2 on first level, 1 on second level); Refrigerators included (2 on first level)
- Bedrooms: Total of 4 bedrooms
- Bathrooms: Three full bathrooms (two on first level, one on second level)
- Heating & cooling: Heating provided (electric and natural gas); Three furnaces; Central air and wall/window units for cooling
- Interior features: Traditional architectural style; No basement
- Laundry & utility: Laundry facilities on first level (2)
Neighborhood map
What this means for you Summary
Snapshot
- This is a 3 × 4-bed/3.0-bath units multifamily listed at $400k.
Deal economics
- At list price, monthly cash flow is $1k ($18k/yr) — positive. Per door: $499/mo.
- The deal already cash-flows at list — no discount required.
- Meets the 1% rule at list price ($5k rent vs $400k).
- Recommended offer: $394k (1.5% below list) — sets the bar for market timing.
- Cap rate 10.8% vs local median 5.0% in Louisville — top-decile yield for the area; either an underpriced asset or a hidden risk that comps aren't pricing in. Stress-test before assuming the spread holds.
Location & tenants
- Location reads 63/100 on livability (#333 in KY) — a middle-class / working-renter tenant base. Strengths: cost of living A+, housing A+; Watch: employment C-, health & safety D+, schools D-.
- Jefferson County (urban): math 19% / reading 35% proficiency, ranked #121 of 165 in KY (top 73%) — low school quality limits family demand, transient renter base, plan for 1-2y turnover.
- Market conditions: Rents rising (+2.9%/yr); 133 active listings in the ZIP; solid renter incomes; 2,836 units permitted in Jefferson County in 2024 (1,558 in 5+ unit buildings).
- At $5,127/mo this rent would consume 81% of the median local household income ($76k/yr) (locally 995% of renters already pay >50% of income on rent) — very limited rent-growth headroom before tenants either downsize or default.
Forward outlook
- Local home prices are declining (-3.0%/yr); year-one equity from $3k of loan paydown is wiped out by about $12k of value loss. Plan a longer hold.
- Jefferson County population projected at +13% by 2050 — modest demand growth; plan on rents tracking national, not racing it.
- At projected returns (-3.0% appreciation + 2.9% rent growth), your $112k cash investment doubles in ~8 years — after that, you're playing with house money.
Negotiation context
- It's been on market 22 days — a 2% lower offer ($394k) is reasonable based on typical stale-listing flexibility.
- 3 sale attempts since 15y ago with the ask held roughly flat each time — persistent listings suggest the price (not the market) is what's stuck; bring a comps-based counter.
- Current owner paid $280k; 43% above their basis — modest negotiation headroom, anchor on the comps not their cost.
Risks & watch-outs
- Watch-outs: built in 1955 — expect roof / HVAC / electrical / plumbing capex.
- Climate carrying-cost: extreme-heat days projected 7→20/yr by 2055 (HVAC capex compounding) — expect insurance premiums to compound above CPI over the hold.
Questions for the listing agent
- Can we see the unit-by-unit rent roll, current vacancy, and any below-market leases? What's the average tenancy length?
- What capital expenditures (roof, boiler, parking lot, exteriors) have been made in the last 5 years, and what's planned in the next 2?
- Built in 1955 — when were the roof, HVAC, electrical panel, plumbing, and water heater last replaced?
- Is there a deadline driving the sale (1031 exchange, divorce, estate, relocation)? That informs how much negotiation room exists.
- Schools are D-rated, which usually means shorter tenancies and higher turnover. Who's the typical renter profile here, and what's been the actual vacancy rate?
- Crime grade is F in this area — have there been break-ins, vandalism, or insurance claims at this property in the last 3 years? What carrier currently insures it and at what premium?
- What's the average days-on-market for RENTAL listings here right now (not sales)? A rising rental-DOM trend means longer vacancies and softer asking-rent achievability than the comps imply.
- What's the recent tenant-quality profile in this submarket — average credit score on applications, eviction rate, late-payment / NSF rate, and stable-employment percentage? A property-management company in the area should have these aggregated.
- How much new apartment / multifamily construction is in the pipeline within 1–3 miles? Heavy new supply (>2% of stock underway) typically softens rents 12–24 months out; light construction supports rent growth.
Investment metrics
- 1% rule
- 1.28% ✓
- Cap rate
- 10.78%
- Cash-on-cash
- 16.04%
- DSCR
- 1.71
- GRM
- 6.5
CMA / ARV
No comps found within radius.
Projected returns pro-forma
-3.0% appreciation · 2.89% rent growth · sell at horizon
- IRR
- 6.9%
- Equity multiple
- 1.27×
- Total profit
- $29,912
- Equity at exit
- $59,626
- IRR
- 16.1%
- Equity multiple
- 2.31×
- Total profit
- $146,269
- Equity at exit
- $34,576
Cash invested: $111,972 (down + closing). Projections, not guarantees.
Landlord ↔ Tenant lean methodology
- Overall (STATE)
- 83 Strongly Landlord-Friendly
- State Kentucky
- 83 Strongly Landlord-Friendly · R+16
- County
- — inherits STATE
- City
- — inherits STATE
ZIP-level market 40206
- Rents YoY
- 2.9%
- Active inventory
- 133
- Price-to-rent
- 19.5×
Monthly cashflow live
- Estimated rent
- $5,127 medium interval (Pro) →
- Mortgage (P&I)
- −$2,097
- Tax from tax record
- −$290 /mo · $3,478/yr
- Insurance
- −$167
- HOA
- −$0
- Vacancy / Maint / Mgmt
- −$1,077
- Net cashflow
- $1,497
Break-even live
3-unit breakdown (identical units grouped — click to expand)
| Units | Beds | Baths | Est. rent |
|---|---|---|---|
| 3× units | 4 | 3 | $5,127 |
| #1 | 4 | 3 | $1,709 |
| #2 | 4 | 3 | $1,709 |
| #3 | 4 | 3 | $1,709 |
| Total (3 units) | $5,127 | ||
UW: 25.0% down · 7.5% · 30yr · 1.5% tax · 5.0% vac · 8.0% maint · 8.0% mgmt
Financing live
Cash to close
- Down payment
- $99,975
- Closing costs
- $11,997
- Reserves months
- —
- Total cash needed
- —
Loan-product check · same deal, 3 products live
Conventional
25% down · 7.5% · 30yr
- Down + closing
- —
- Monthly P&I
- —
- Monthly cashflow
- —
- DSCR
- —
- Eligible?
- —
Personal DTI + credit; lowest rate.
DSCR
20% down · 8.5% · 30yr
- Down + closing
- —
- Monthly P&I
- —
- Monthly cashflow
- —
- DSCR
- —
- Eligible?
- —
No personal income docs; deal must DSCR.
Hard money
10% down · 12.0% · 12mo
- Down + closing
- —
- Monthly P&I
- —
- Monthly cashflow
- —
- DSCR
- —
- Eligible?
- —
Short-term bridge; refi at stabilization.
Listing history 21 events
-
2026-06-18days on market $399,900 Active 22 DOM
-
2026-06-17days on market $399,900 Active 21 DOM
-
2026-06-16days on market $399,900 Active 20 DOM
-
2026-06-15days on market $399,900 Active 19 DOM
-
2026-06-13days on market $399,900 Active 17 DOM
-
2026-06-10days on market $399,900 Active 14 DOM
-
2026-06-09days on market $399,900 Active 13 DOM
-
2026-06-08days on market $399,900 Active 12 DOM
-
2026-06-07days on market $399,900 Active 11 DOM
-
2026-06-03days on market $399,900 Active 7 DOM
-
2026-06-02days on market $399,900 Active 6 DOM
-
2026-06-01days on market $399,900 Active 5 DOM
-
2026-05-31days on market $399,900 Active 4 DOM
-
2026-05-27$399,900 Active
-
2020-08-13soldstatus $280,000
-
2020-08-10soldstatus $280,000 Closed 245-char remark
Show marketing remark (245 chars)
Fully Leased! This is an excellent investment property is a highly convenient area. The owner pays for the water. The gas and the electric are separately meters. One of the units is discounted for general maintenance/mowing of the property.
-
2020-06-27status Pending 245-char remark
Show marketing remark (245 chars)
Fully Leased! This is an excellent investment property is a highly convenient area. The owner pays for the water. The gas and the electric are separately meters. One of the units is discounted for general maintenance/mowing of the property.
-
2020-06-24$284,900 Active 245-char remark
Show marketing remark (245 chars)
Fully Leased! This is an excellent investment property is a highly convenient area. The owner pays for the water. The gas and the electric are separately meters. One of the units is discounted for general maintenance/mowing of the property.
-
2012-06-04historical
-
2012-04-11soldstatus $145,000
-
2011-06-04$155,000
ⓘ Source: listings_history table (triggers on properties + properties_extension) + one-shot
backfill from property_details.listing_events for pre-trigger history.
Tax reassessment forecast KY · Resets to sale price
- Current annual tax
- $3,478 · $290/mo
- Projected year-2 tax
- $3,478 · $290/mo
- Expected delta
- $0/yr ($0/mo · 0.0%)
ⓘ Screening estimate from a state-policy table — verify with the county assessor before closing.
Climate risk First Street
- Flood 1/10 Low FEMA zone X (unshaded) · 0% chance over 30 yrs
- Wildfire 1/10 Low
- Heat 5/10 Major 7 d/yr ≥105°F today · 20 d/yr by 30 yrs out
- Wind 2/10 Low 2% chance of damaging wind over 30 yrs
- Air quality 3/10 Moderate 2 unhealthy d/yr today · 4 by 30 yrs out
Nearby sold comps map
Loading sold comps map…
Walkable amenities ~0.75 mi
Loading nearby amenities…
Taxation est. · year 1
- Rental income
- $61,524
- − Mortgage interest
- −$22,401
- − Property taxes
- −$3,478
- − Insurance
- −$2,000
- − Repairs & maintenance
- −$4,922
- − Management
- −$4,922
- − Depreciation
- −$11,633
- Taxable income
- $12,169
- Est. tax owed @ 24.0%
- −$2,921
- After-tax cash flow
- $15,041/yr
For passive investors: Depreciation is non-cash, so a rental often shows a tax loss while cash-flowing — sheltering income. Rental losses are passive: they offset passive income freely, and up to $25,000/yr can offset ordinary (W-2) income if you actively participate and your MAGI is under $100k (phasing out to $0 by $150k); unused losses carry forward. On sale, claimed depreciation is recaptured at up to 25%, and gains may owe capital-gains tax (a 1031 exchange can defer both). Figures are a year-1 estimate at your 24.0% rate — not tax advice; consult a CPA.
Schools (NCES district)
- District
- Jefferson County
- NCES district ID
- 2102990
- Math proficiency
- 19% ▼ -17.00%
- Reading proficiency
- 35% ▼ -11.00%
- Median HH income
- $47,885
- Composite
- 23.45/100
- National rank
- #7884
- State rank
- #121 of 165 in KY
Livability — Louisville
- Score
- 63/100
- State rank
- #333
- US rank
- #15887
Category grades
Schools grade is shown separately in the Schools card above.
Census & demographics
- Census place
- Louisville, KY
- County
- Jefferson County · 790,184 people
- City population
- 769,292
- Metro
- Louisville/Jefferson County, KY-IN
- Population (ZIP)
- 20,161
- Household income
- $75,798
- Rent vs Own
- Severe rent burden
- 995.0
Population outlook (Jefferson County) Hauer SSP2
- Today (2025)
- 823,112 people
- By 2030
- 849,343 · +3.2%
- By 2040
- 895,696 · +8.8%
- By 2050
- 933,630 · +13.4%
- By 2075
- 1,028,262 · +24.9%
- By 2100
- 1,072,675 · +30.3%
Race, ethnicity, and origin ACS 2023
- Neighborhood character
- Predominantly White (78%)
- Race & ethnicity
- White 78% Black 11% Two or more races 6% Hispanic / Latino 4% Asian 3%
- Common ancestry
- Lithuanian 4% Slovak 3% Serbian 3%
- Foreign-born
- 8% · Canada
- Languages at home
- 91% English-only · Spanish 4% Korean 1% Tagalog/Filipino 1%
Political lean MEDSL · Jefferson
- 2024 margin
- D (+16.6) · D 57.4% · R 40.9% · Other 1.7%
- 2008→2024 swing
- +4.5pp toward D · 2008: 12.0pp · 2024: 16.6pp
- All cycles
- 2024: D+16.6 2020: D+20.1 2016: D+13.3 2012: D+11.1 2008: D+12.0
Not yet ingested
- Civics
- —
Market trends
- HPI YoY
- ▼ -414.83%
- Current HPI
- 242.7908
- Rent YoY
- ▲ 2.89%
- Metro
- Louisville/Jefferson County, KY-IN
- State GDP YoY
- ▲ 1.81%
- F500 in state
- 4
Industry mix (Fortune 500 HQ in KY)
| Industry | F500 HQs | Revenue |
|---|---|---|
| Healthcare | 1 | $118B |
|
||
| Food / Beverage | 1 | $7B |
|
||
Price history
+158.0% since first listed8 events — show timeline
- 2026-05-27 Listed $399,900 Metro Search MLS
- 2020-08-13 Sold (Public Records) $280,000 Public Records
- 2020-08-10 Sold (MLS) $280,000 Metro Search MLS
- 2020-06-27 Pending — Metro Search MLS
- 2020-06-24 Listed $284,900 Metro Search MLS
- 2012-06-04 Listing Removed — Metro Search MLS
- 2012-04-11 Sold (Public Records) $145,000 Public Records
- 2011-06-04 Listed $155,000 Metro Search MLS
Property tax history
+5.6%/yrLatest (2025): $3,478 · -1.9% YoY. Source: county tax records.
Cash-flow waterfall
monthlySold comps — $/sqft
last 12 mo · ≤1 miLoading sold comps…