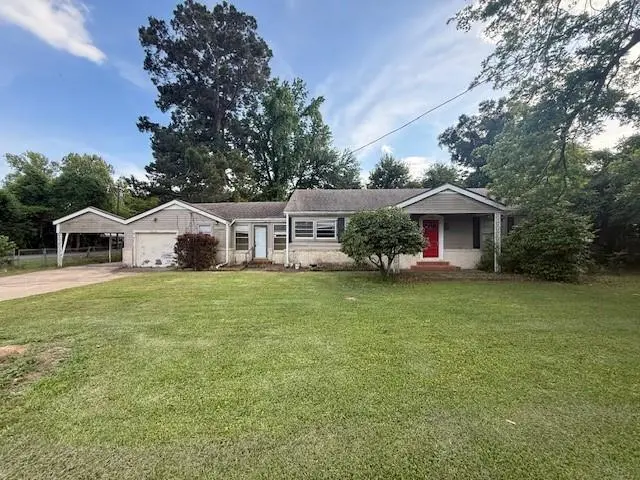
2610 Horseshoe Dr · Alexandria, LA
Flood risk 1/10 · Minimal
- FEMA flood zone
- X
- Chance of flooding over 30 yrs
- 0.0%
- Est. flood insurance / yr
- $507 – $1,088
Fire risk 1/10 · Minimal
- Est. fire insurance / yr
- $1,269 – $2,357
Heat risk 8/10 · Major
- Hot days now (above 111°F)
- 7 days/yr
- Hot days in 30 yrs
- 19 days/yr
Wind risk 8/10 · Major
- Chance of severe wind over 30 yrs
- 99.0%
Air-quality risk 2/10 · Minimal
- Unhealthy air days now
- 1 days/yr
- Unhealthy air days in 30 yrs
- 1 days/yr
Risk factors via First Street. Map © Google.
Why this score? — see what drove the B+ grade
The composite is a weighted blend of 9 inputs, each scored 0–100. Each bar is that input's sub-score; the figure is the points it added to the 100-point composite (weight × sub-score).
- Cash flow +30.0/30.0
- ARV discount +15.0/15.0
- 1% rule +10.0/10.0
- DSCR +10.0/10.0
- Livability +3.2/5.0
- Schools +3.1/10.0
- Rent growth +2.5/5.0
- Condition / age +2.5/5.0
- Appreciation +0.0/10.0
$104,000
🖨 Deal sheet 📄 Offer letter ✓ Due diligence
Listing remarks
Don't Miss This Opportunity - Priced to Sell! Welcome to this spacious corner-lot home with incredible potential! Whether you're a savvy investor or a homeowner ready to make it your own, this property checks all the boxes. Inside the Home: The semi-open layout connects the living room, dining area, and kitchen while still offering a natural sense of separation -- the perfect blend of open-concept flow and defined spaces. The kitchen boasts plenty of cabinet storage, plus stainless steel appliances including a stove, microwave, and a dishwasher. Each bedroom is thoughtfully positioned to maximize privacy and space for every member of the household. Major Updates Done for You: Rest easy know
Key facts
- Semi-open layout
- Nice-sized backyard
- Corner lot
Tags
Property features AI
Exterior
- Parking: Carport; Garage
- Home design: Single family residence; Composition roof; Vinyl siding
- Construction: Vinyl siding construction; Composition roof
- Exterior features: Chain link and full fencing; Workshop (outbuilding)
Interior
- Kitchen: Dishwasher
- Bedrooms: Two bedrooms
- Bathrooms: Two full bathrooms
- Heating & cooling: Central heating; Central air conditioning
- Interior features: Living room; Kitchen; Bathroom 1; Bathroom 2; Bedroom 1; Bedroom 2; Gas log fireplace
Neighborhood map
What this means for you Summary
Snapshot
- This is a 3-bed/1.0-bath single-family listed at $104k.
Deal economics
- At list price, monthly cash flow is $933 ($11k/yr) — positive.
- The deal already cash-flows at list — no discount required.
- Meets the 1% rule at list price ($2k rent vs $104k).
- Recommended offer: $101k (3.0% below list) — sets the bar for market timing.
- Cap rate 17.1% vs local median 4.9% in Alexandria — top-decile yield for the area; either an underpriced asset or a hidden risk that comps aren't pricing in. Stress-test before assuming the spread holds.
Location & tenants
- Location reads 64/100 on livability (#160 in LA) — a middle-class / working-renter tenant base. Strengths: cost of living A+, housing A+, health & safety A+; Watch: crime F, amenities F, commute F.
- Rapides Parish (urban): math 29% / reading 44% proficiency, ranked #31 of 98 in LA (top 32%) — families likely to look elsewhere, expect single-tenant / working-renter base with shorter leases; 64% free/reduced lunch — lower-income household profile, screen leases tightly.
- Market conditions: 151 active listings in the ZIP; 2 comparable units currently listed for rent nearby; 239 units permitted in Rapides Parish in 2024 (0 in 5+ unit buildings).
Forward outlook
- Local home prices are declining (-3.0%/yr); year-one equity from $719 of loan paydown is wiped out by about $3k of value loss. Plan a longer hold.
- Rapides County population projected to shrink 6% by 2050 — rents likely to lag national; underwrite the cash flow, not the appreciation.
- At projected returns (-3.0% appreciation + 3.0% rent growth), your $29k cash investment doubles in ~4 years — after that, you're playing with house money.
Negotiation context
- It's been on market 45 days — a 3% lower offer ($101k) is reasonable based on typical stale-listing flexibility.
- 6 sale attempts since 13y ago; this cycle's ask has dropped $16k (13%) from the opening price — seller is motivated, your offer sets the floor, not the list.
Risks & watch-outs
- Climate carrying-cost: severe wind risk, 99% chance of damaging wind over 30y; extreme-heat days projected 7→19/yr by 2055 (HVAC capex compounding) — expect insurance premiums to compound above CPI over the hold.
Questions for the listing agent
- It's been on market 45 days. Have you received any prior offers? Is the seller open to a 3% concession, seller financing, or rate buy-down credit?
- Built in 1966 — when were the roof, HVAC, electrical panel, plumbing, and water heater last replaced?
- Is there a deadline driving the sale (1031 exchange, divorce, estate, relocation)? That informs how much negotiation room exists.
- Crime grade is F in this area — have there been break-ins, vandalism, or insurance claims at this property in the last 3 years? What carrier currently insures it and at what premium?
- What's the average days-on-market for RENTAL listings here right now (not sales)? A rising rental-DOM trend means longer vacancies and softer asking-rent achievability than the comps imply.
- What's the recent tenant-quality profile in this submarket — average credit score on applications, eviction rate, late-payment / NSF rate, and stable-employment percentage? A property-management company in the area should have these aggregated.
- How much new for-sale + rental construction is in the pipeline within 1–3 miles? Heavy new supply typically softens prices + rents 12–24 months out; constrained supply supports both.
Investment metrics
- 1% rule
- 2.04% ✓
- Cap rate
- 17.06%
- Cash-on-cash
- 38.46%
- DSCR
- 2.71
- GRM
- 4.1
CMA / ARV
- ARV (median comp)
- $178,447
- List price
- $104,000
- Delta
- -41.72%
- Verdict
- UNDERPRICED
- Comps
- 15 within 1.0 mi
Show comp detail 3 sales within ~0.75 mi
| Address | Dist | Beds/Ba | Sqft | Sold | Price | $/sf | Match |
|---|---|---|---|---|---|---|---|
| 6012 Deerfield Dr | 0.53mi | 3/2.0 | 2,000 (-4%) | 2mo | $185,000 | $93 | 63 |
| 5715 Circle Dr | 0.13mi | 3/2.5 | 2,389 (+15%) | 2mo | $208,000 | $87 | 62 |
| 5547 North Dr | 0.39mi | 3/2.0 | 1,801 (-14%) | 3mo | $170,000 | $94 | 53 |
Match score weights: distance 35% · size 25% · config 20% · recency 20%. Top-matched comps best support the ARV.
Projected returns pro-forma
-3.0% appreciation · 3.0% rent growth · sell at horizon
- IRR
- 34.6%
- Equity multiple
- 2.46×
- Total profit
- $42,631
- Equity at exit
- $15,507
- IRR
- 41.4%
- Equity multiple
- 4.91×
- Total profit
- $113,853
- Equity at exit
- $8,992
Cash invested: $29,120 (down + closing). Projections, not guarantees.
Landlord ↔ Tenant lean methodology
- Overall (STATE)
- 90 Strongly Landlord-Friendly
- State Louisiana
- 90 Strongly Landlord-Friendly · R+12
- County
- — inherits STATE
- City
- — inherits STATE
ZIP-level market 71301
- Home prices YoY
- -23.0%
- Active inventory
- 151
- Price-to-rent
- 4.1×
Monthly cashflow live
- Estimated rent
- $2,126 medium interval (Pro) →
- Mortgage (P&I)
- −$545
- Tax from tax record
- −$158 /mo · $1,890/yr
- Insurance
- −$43
- HOA
- −$0
- Vacancy / Maint / Mgmt
- −$446
- Net cashflow
- $933
Break-even live
UW: 25.0% down · 7.5% · 30yr · 1.5% tax · 5.0% vac · 8.0% maint · 8.0% mgmt
Financing live
Cash to close
- Down payment
- $26,000
- Closing costs
- $3,120
- Reserves months
- —
- Total cash needed
- —
Loan-product check · same deal, 3 products live
Conventional
25% down · 7.5% · 30yr
- Down + closing
- —
- Monthly P&I
- —
- Monthly cashflow
- —
- DSCR
- —
- Eligible?
- —
Personal DTI + credit; lowest rate.
DSCR
20% down · 8.5% · 30yr
- Down + closing
- —
- Monthly P&I
- —
- Monthly cashflow
- —
- DSCR
- —
- Eligible?
- —
No personal income docs; deal must DSCR.
Hard money
10% down · 12.0% · 12mo
- Down + closing
- —
- Monthly P&I
- —
- Monthly cashflow
- —
- DSCR
- —
- Eligible?
- —
Short-term bridge; refi at stabilization.
Rent comps 2 comps
| Address | Beds | Baths | Sqft | Rent | $/sqft | DOM | Units | Dist |
|---|---|---|---|---|---|---|---|---|
| 2608 Horseshoe Dr Alexandria, LA | 3.0 | 2.0 | 1700 | $2,200 | $1.29 | 44d | 1 | 0.03mi |
| 2020 Clover Ln Alexandria, LA | 3.0 | 2.0 | 1927 | $1,600 | $0.83 | 44d | 1 | 0.80mi |
Listing history 27 events
-
2026-06-19days on market $104,000 Active 45 DOM
-
2026-06-18days on market $104,000 Active 44 DOM
-
2026-06-17days on market $104,000 Active 43 DOM
-
2026-06-16days on market $104,000 Active 42 DOM
-
2026-06-15days on market $104,000 Active 41 DOM
-
2026-06-14days on market $104,000 Active 39 DOM
-
2026-06-13days on market $104,000 Active 38 DOM
-
2026-06-10days on market $104,000 Active 36 DOM
-
2026-06-09days on market $104,000 Active 35 DOM
-
2026-06-08days on market $104,000 Active 34 DOM
-
2026-06-07days on market $104,000 Active 33 DOM
-
2026-06-03days on market $104,000 Active 29 DOM
-
2026-06-02days on market $104,000 Active 28 DOM
-
2026-06-01days on market $104,000 Active 27 DOM
-
2026-05-31days on market $104,000 Active 26 DOM
-
2026-05-30days on market $104,000 Active 25 DOM
-
2026-05-05$119,999 Active 1310-char remark
-
2024-02-23historical
-
2024-01-24price $139,000
-
2024-01-18price $145,000
-
2024-01-03$152,000 Active
-
2024-01-03$139,000
-
2021-04-09soldstatus $158,000
-
2020-06-22$155,000
-
2014-12-01soldstatus $145,000
-
2014-05-30$158,000
-
2013-09-09$159,000
ⓘ Source: listings_history table (triggers on properties + properties_extension) + one-shot
backfill from property_details.listing_events for pre-trigger history.
Tax reassessment forecast LA · Resets to sale price
- Current annual tax
- $1,890 · $158/mo
- Projected year-2 tax
- $1,890 · $158/mo
- Expected delta
- $0/yr ($0/mo · 0.0%)
ⓘ Screening estimate from a state-policy table — verify with the county assessor before closing.
Climate risk First Street
- Flood 1/10 Low FEMA zone X · 0% chance over 30 yrs
- Wildfire 1/10 Low
- Heat 8/10 Severe 7 d/yr ≥111°F today · 19 d/yr by 30 yrs out
- Wind 8/10 Severe 99% chance of damaging wind over 30 yrs
- Air quality 2/10 Low 1 unhealthy d/yr today · 1 by 30 yrs out
Nearby sold comps map
Loading sold comps map…
Walkable amenities ~0.75 mi
Loading nearby amenities…
Taxation est. · year 1
- Rental income
- $25,510
- − Mortgage interest
- −$5,826
- − Property taxes
- −$1,890
- − Insurance
- −$520
- − Repairs & maintenance
- −$2,041
- − Management
- −$2,041
- − Depreciation
- −$3,025
- Taxable income
- $10,167
- Est. tax owed @ 24.0%
- −$2,440
- After-tax cash flow
- $8,758/yr
For passive investors: Depreciation is non-cash, so a rental often shows a tax loss while cash-flowing — sheltering income. Rental losses are passive: they offset passive income freely, and up to $25,000/yr can offset ordinary (W-2) income if you actively participate and your MAGI is under $100k (phasing out to $0 by $150k); unused losses carry forward. On sale, claimed depreciation is recaptured at up to 25%, and gains may owe capital-gains tax (a 1031 exchange can defer both). Figures are a year-1 estimate at your 24.0% rate — not tax advice; consult a CPA.
Schools (NCES district)
- District
- Rapides Parish
- NCES district ID
- 2201290
- Math proficiency
- 29% ▼ -34.00%
- Reading proficiency
- 44% ▼ -29.00%
- Median HH income
- $41,057
- Composite
- 30.68/100
- National rank
- #6179
- State rank
- #31 of 98 in LA
Livability — Alexandria
- Score
- 64/100
- State rank
- #160
- US rank
- #13698
Category grades
Schools grade is shown separately in the Schools card above.
Census & demographics
- City population
- 25,138
- Population (ZIP)
- 17,266
Population outlook (Rapides County) Hauer SSP2
- Today (2025)
- 133,047 people
- By 2030
- 132,333 · -0.5%
- By 2040
- 129,355 · -2.8%
- By 2050
- 124,535 · -6.4%
- By 2075
- 110,338 · -17.1%
- By 2100
- 88,641 · -33.4%
Race, ethnicity, and origin ACS 2023
- Neighborhood character
- Diverse neighborhood (Simpson 0.58)
- Race & ethnicity
- Black 53% White 36% Hispanic / Latino 4% Two or more races 3% Asian 2%
- Common ancestry
- Lithuanian 5% Portuguese 1% Hispanic 1%
- Foreign-born
- 6% · Canada, Vietnam
- Languages at home
- 93% English-only · Spanish 3% Other Asian/Pacific 2% French/Haitian/Cajun 1%
Political lean MEDSL · Rapides
- 2024 margin
- Solid R (+36.8) · D 31.0% · R 67.7% · Other 1.3%
- 2008→2024 swing
- -8.1pp toward R · 2008: -28.7pp · 2024: -36.8pp
- All cycles
- 2024: R+36.8 2020: R+32.1 2016: R+32.5 2012: R+29.6 2008: R+28.7
Not yet ingested
- Civics
- —
Market trends
- HPI YoY
- ▼ -55.38%
- Current HPI
- 184.9889
- Rent YoY
- —
- Metro
- —
- State GDP YoY
- ▲ 3.29%
- F500 in state
- 10
Industry mix (Fortune 500 HQ in LA)
| Industry | F500 HQs | Revenue |
|---|---|---|
| Telecommunications | 2 | $23B |
|
||
| Utilities | 1 | $12B |
|
||
| Wholesale / Distribution | 1 | $5B |
|
||
| Advertising | 1 | $2B |
|
||
Price history
-34.6% since first listed12 events — show timeline
- 2026-05-29 Price Changed $104,000 AcadianaMLS
- 2026-05-05 Listed $119,999 AcadianaMLS
- 2024-02-23 Delisted — GBRMLS
- 2024-01-24 Price Changed $139,000 GBRMLS
- 2024-01-18 Price Changed $145,000 GBRMLS
- 2024-01-03 Listed $139,000 AcadianaMLS
- 2024-01-03 Listed $152,000 GBRMLS
- 2021-04-09 Sold (Public Records) $158,000 Public Records
- 2020-06-22 Listed $155,000 AcadianaMLS
- 2014-12-01 Sold (Public Records) $145,000 Public Records
- 2014-05-30 Listed $158,000 AcadianaMLS
- 2013-09-09 Listed $159,000 AcadianaMLS
Property tax history
+15.6%/yrLatest (2025): $1,890 · -1.0% YoY. Source: county tax records.
Cash-flow waterfall
monthlySold comps — $/sqft
last 12 mo · ≤1 miLoading sold comps…