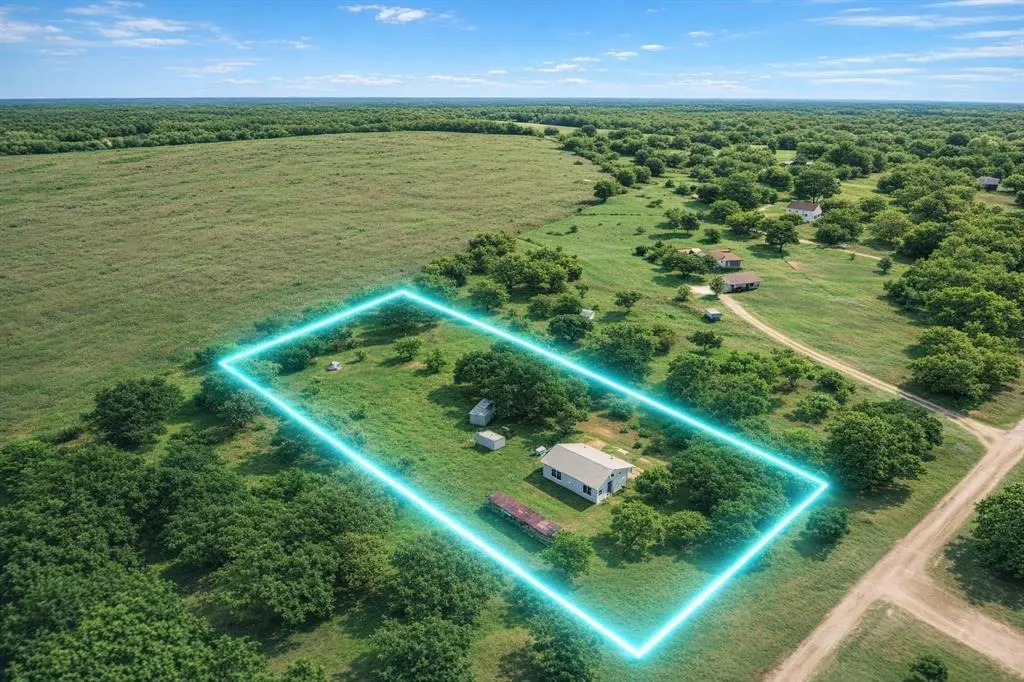
1424 James Dr · Oak Ridge, TX
Flood risk 1/10 · Minimal
- FEMA flood zone
- X (unshaded)
- Chance of flooding over 30 yrs
- 0.0%
- Est. flood insurance / yr
- $507 – $1,088
Fire risk 7/10 · Major
- Est. fire insurance / yr
- $1,222 – $2,270
Heat risk 7/10 · Major
- Hot days now (above 110°F)
- 7 days/yr
- Hot days in 30 yrs
- 24 days/yr
Wind risk 6/10 · Moderate
- Chance of severe wind over 30 yrs
- 27.0%
Air-quality risk 2/10 · Minimal
- Unhealthy air days now
- 1 days/yr
- Unhealthy air days in 30 yrs
- 1 days/yr
Risk factors via First Street. Map © Google.
Why this score? — see what drove the C- grade
The composite is a weighted blend of 9 inputs, each scored 0–100. Each bar is that input's sub-score; the figure is the points it added to the 100-point composite (weight × sub-score).
- Cash flow +21.3/30.0
- ARV discount +7.5/15.0
- 1% rule +7.3/10.0
- DSCR +6.8/10.0
- Schools +3.3/10.0
- Livability +3.1/5.0
- Rent growth +2.5/5.0
- Condition / age +2.5/5.0
- Appreciation +0.0/10.0
$149,000
🖨 Deal sheet 📄 Offer letter ✓ Due diligence
Listing remarks
This home presents a prime opportunity. Offered as-is and priced below market value, this property is a blank canvas for the savvy investor looking to customize, renovate, or redevelop for maximum returns. Situated in Kaufman with convenient access to local amenities, major thoroughfares, and the growing DFW area, the location offers both accessibility and long-term upside. With strong potential for appreciation, this property is ideal for investors or buyers looking to add value through thoughtful updates or a full transformation. Don’t miss this chance to secure an entry point into a rapidly developing market at an attractive price.
Key facts
- 2 acre lot
- Built 1960
- Listed 19 days
Property features AI
Finance
- Other: Property type: Single Family Residence; Subdivision: Fm 2727 Estates; County: Kaufman
- Financial info: Selling terms: Cash; Treat as clear loan status; No second mortgage indicated
- HOA & community: No homeowners association
Exterior
- Parking: Off-street parking
- Utilities: Utilities: Other; Not in a municipal utility district
- Home design: Single-family residence; Residential property; Built in 1960; One story
- Construction: Year built: 1960
- Exterior features: 2.00-acre lot; Shed(s) on property; Lot size source: public records; Will not subdivide
Interior
- Kitchen: No appliances included
- Bedrooms: 3 bedrooms; Primary bedroom on main level (17 x 15)
- Bathrooms: 2 full bathrooms
- Interior features: One-level layout; One living area; One dining area; Other interior features
- Laundry & utility: No laundry appliances listed
Neighborhood map
What this means for you Summary
Snapshot
- This is a 3-bed/1.0-bath single-family listed at $149k.
Deal economics
- At list price, monthly cash flow is $219 ($3k/yr) — positive.
- The deal already cash-flows at list — no discount required.
- Meets the 1% rule at list price ($2k rent vs $149k).
- Recommended offer: $147k (1.5% below list) — sets the bar for market timing.
- Cap rate 8.1% vs local median 2.9% in Oak Ridge — top-decile yield for the area; either an underpriced asset or a hidden risk that comps aren't pricing in. Stress-test before assuming the spread holds.
Location & tenants
- Location reads 62/100 on livability (#900 in TX) — a middle-class / working-renter tenant base. Strengths: employment A+, cost of living A+, housing A+; Watch: amenities F, commute F, health & safety F.
- Kaufman ISD (town): math 38% / reading 39% proficiency, ranked #437 of 826 in TX (top 53%) — families likely to look elsewhere, expect single-tenant / working-renter base with shorter leases.
- Zoned schools: Lucille Nash El (math 44% / reading 48%, grade D-, #1,097 of 4,322 statewide, top 26%, 579 students, 68% FRL).
- Market conditions: 274 active listings in the ZIP; 1,747 units permitted in Kaufman County in 2024 (180 in 5+ unit buildings).
Forward outlook
- Local home prices are declining (-3.0%/yr); year-one equity from $1k of loan paydown is wiped out by about $4k of value loss. Plan a longer hold.
- Kaufman County population projected at +43% by 2050 — long-run rental-demand tailwind backs the buy-and-hold thesis.
Negotiation context
- It's been on market 19 days — a 2% lower offer ($147k) is reasonable based on typical stale-listing flexibility.
- 3 sale attempts with the ask held roughly flat each time — persistent listings suggest the price (not the market) is what's stuck; bring a comps-based counter.
Risks & watch-outs
- Watch-outs: property tax is 3.1% of price.
- Climate carrying-cost: major wind risk, 27% chance of damaging wind over 30y; major wildfire risk; extreme-heat days projected 7→24/yr by 2055 (HVAC capex compounding) — expect insurance premiums to compound above CPI over the hold.
Questions for the listing agent
- Built in 1960 — when were the roof, HVAC, electrical panel, plumbing, and water heater last replaced?
- Property tax is high relative to price — has the assessment been appealed recently, and will the sale trigger a re-assessment?
- Is there a deadline driving the sale (1031 exchange, divorce, estate, relocation)? That informs how much negotiation room exists.
- Schools are D-rated, which usually means shorter tenancies and higher turnover. Who's the typical renter profile here, and what's been the actual vacancy rate?
- What's the average days-on-market for RENTAL listings here right now (not sales)? A rising rental-DOM trend means longer vacancies and softer asking-rent achievability than the comps imply.
- What's the recent tenant-quality profile in this submarket — average credit score on applications, eviction rate, late-payment / NSF rate, and stable-employment percentage? A property-management company in the area should have these aggregated.
- How much new for-sale + rental construction is in the pipeline within 1–3 miles? Heavy new supply typically softens prices + rents 12–24 months out; constrained supply supports both.
Investment metrics
- 1% rule
- 1.23% ✓
- Cap rate
- 8.06%
- Cash-on-cash
- 6.31%
- DSCR
- 1.28
- GRM
- 6.8
CMA / ARV
- ARV (median comp)
- $320,829
- List price
- $149,000
- Delta
- -53.56%
- Verdict
- UNDERPRICED
- Comps
- 5 within 1.0 mi
Show comp detail 1 sale within ~0.75 mi
| Address | Dist | Beds/Ba | Sqft | Sold | Price | $/sf | Match |
|---|---|---|---|---|---|---|---|
| 1424 James Dr | 0.00mi | 3/2.0 | 1,488 (0%) | 0mo | $149,000 | $100 | 96 |
Match score weights: distance 35% · size 25% · config 20% · recency 20%. Top-matched comps best support the ARV.
Projected returns pro-forma
-3.0% appreciation · 3.0% rent growth · sell at horizon
- IRR
- -6.5%
- Equity multiple
- 0.76×
- Total profit
- $-10,018
- Equity at exit
- $22,216
- IRR
- 3.3%
- Equity multiple
- 1.24×
- Total profit
- $9,882
- Equity at exit
- $12,883
Cash invested: $41,720 (down + closing). Projections, not guarantees.
Landlord ↔ Tenant lean methodology
- Overall (STATE)
- 87 Strongly Landlord-Friendly
- State Texas
- 87 Strongly Landlord-Friendly · R+5
- County
- — inherits STATE
- City
- — inherits STATE
ZIP-level market 75142
- Home prices YoY
- -19.8%
- Active inventory
- 274
- Price-to-rent
- 6.8×
Monthly cashflow live
- Estimated rent
- $1,832 medium interval (Pro) →
- Mortgage (P&I)
- −$781
- Tax from tax record
- −$384 /mo · $4,614/yr
- Insurance
- −$62
- HOA
- −$0
- Vacancy / Maint / Mgmt
- −$385
- Net cashflow
- $219
Break-even live
UW: 25.0% down · 7.5% · 30yr · 1.5% tax · 5.0% vac · 8.0% maint · 8.0% mgmt
Financing live
Cash to close
- Down payment
- $37,250
- Closing costs
- $4,470
- Reserves months
- —
- Total cash needed
- —
Loan-product check · same deal, 3 products live
Conventional
25% down · 7.5% · 30yr
- Down + closing
- —
- Monthly P&I
- —
- Monthly cashflow
- —
- DSCR
- —
- Eligible?
- —
Personal DTI + credit; lowest rate.
DSCR
20% down · 8.5% · 30yr
- Down + closing
- —
- Monthly P&I
- —
- Monthly cashflow
- —
- DSCR
- —
- Eligible?
- —
No personal income docs; deal must DSCR.
Hard money
10% down · 12.0% · 12mo
- Down + closing
- —
- Monthly P&I
- —
- Monthly cashflow
- —
- DSCR
- —
- Eligible?
- —
Short-term bridge; refi at stabilization.
Listing history 18 events
-
2026-06-02statusdays on market $149,000 Pending 19 DOM
-
2026-06-01days on market $149,000 Active Option Contract 18 DOM
-
2026-05-31days on market $149,000 Active Option Contract 17 DOM
-
2026-05-14$149,000 Active 648-char remark
-
2026-05-13historical
-
2026-05-11price $159,997
-
2026-04-27price $174,997
-
2026-04-20price $184,997
-
2026-04-13$189,997 Active
-
2025-11-24soldstatus
-
2025-09-24soldstatus
-
2025-09-24soldstatus
-
2025-09-17soldstatus
-
2025-09-17soldstatus
-
2025-09-09soldstatus
-
2025-09-09soldstatus
-
2025-09-09soldstatus
-
1998-04-21soldstatus
ⓘ Source: listings_history table (triggers on properties + properties_extension) + one-shot
backfill from property_details.listing_events for pre-trigger history.
Tax reassessment forecast TX · Resets to sale price
- Current annual tax
- $4,614 · $384/mo
- Projected year-2 tax
- $4,614 · $384/mo
- Expected delta
- $0/yr ($0/mo · 0.0%)
ⓘ Screening estimate from a state-policy table — verify with the county assessor before closing.
Climate risk First Street
- Flood 1/10 Low FEMA zone X (unshaded) · 0% chance over 30 yrs
- Wildfire 7/10 Severe
- Heat 7/10 Severe 7 d/yr ≥110°F today · 24 d/yr by 30 yrs out
- Wind 6/10 Major 27% chance of damaging wind over 30 yrs
- Air quality 2/10 Low 1 unhealthy d/yr today · 1 by 30 yrs out
Nearby sold comps map
Loading sold comps map…
Walkable amenities ~0.75 mi
Loading nearby amenities…
Taxation est. · year 1
- Rental income
- $21,985
- − Mortgage interest
- −$8,346
- − Property taxes
- −$4,614
- − Insurance
- −$745
- − Repairs & maintenance
- −$1,759
- − Management
- −$1,759
- − Depreciation
- −$4,335
- Taxable income
- $428
- Est. tax owed @ 24.0%
- −$103
- After-tax cash flow
- $2,531/yr
For passive investors: Depreciation is non-cash, so a rental often shows a tax loss while cash-flowing — sheltering income. Rental losses are passive: they offset passive income freely, and up to $25,000/yr can offset ordinary (W-2) income if you actively participate and your MAGI is under $100k (phasing out to $0 by $150k); unused losses carry forward. On sale, claimed depreciation is recaptured at up to 25%, and gains may owe capital-gains tax (a 1031 exchange can defer both). Figures are a year-1 estimate at your 24.0% rate — not tax advice; consult a CPA.
Schools (NCES district)
- District
- Kaufman ISD
- NCES district ID
- 4825200
- Math proficiency
- 38% ▼ -11.00%
- Reading proficiency
- 39% ▬ 0.00%
- Median HH income
- $51,081
- Composite
- 33.36/100
- National rank
- #5485
- State rank
- #437 of 826 in TX
Livability — Oak Ridge
- Score
- 62/100
- State rank
- #900
- US rank
- #16164
Category grades
Schools grade is shown separately in the Schools card above.
Census & demographics
- Population (ZIP)
- 23,301
Population outlook (Kaufman County) Hauer SSP2
- Today (2025)
- 138,716 people
- By 2030
- 150,815 · +8.7%
- By 2040
- 174,877 · +26.1%
- By 2050
- 198,020 · +42.8%
- By 2075
- 251,908 · +81.6%
- By 2100
- 285,325 · +105.7%
Race, ethnicity, and origin ACS 2023
- Neighborhood character
- Diverse neighborhood (Simpson 0.57)
- Race & ethnicity
- White 53% Hispanic / Latino 39% Two or more races 23% Black 4%
- Hispanic origin (detail)
- Mexican 36%
- Common ancestry
- Italian 1% Slovak 1% Serbian 1%
- Foreign-born
- 10% · Canada
- Languages at home
- 69% English-only · Spanish 30%
Political lean MEDSL · Kaufman
- 2024 margin
- Strong R (+27.9) · D 35.6% · R 63.5%
- 2008→2024 swing
- +7.9pp toward D · 2008: -35.8pp · 2024: -27.9pp
- All cycles
- 2024: R+27.9 2020: R+33.9 2016: R+47.0 2012: R+44.4 2008: R+35.8
Not yet ingested
- Civics
- —
Market trends
- HPI YoY
- ▼ -64.48%
- Current HPI
- 261.3091
- Rent YoY
- —
- Metro
- —
- State GDP YoY
- ▲ 3.95%
- F500 in state
- 110
Industry mix (Fortune 500 HQ in TX)
| Industry | F500 HQs | Revenue |
|---|---|---|
| Energy | 16 | $1,198B |
|
||
| Technology | 5 | $198B |
|
||
| Engineering / Construction | 4 | $72B |
|
||
| Energy Services | 3 | $60B |
|
||
| Utilities | 3 | $41B |
|
||
| Healthcare | 2 | $330B |
|
||
Price history
-21.6% since first listed20 events — show timeline
- 2026-06-05 Sold (MLS) — NTREIS
- 2026-06-02 Pending — NTREIS
- 2026-05-23 Contingent — NTREIS
- 2026-05-23 Relisted — NTREIS
- 2026-05-20 Contingent — NTREIS
- 2026-05-14 Listed $149,000 NTREIS
- 2026-05-13 Listing Removed — NTREIS
- 2026-05-11 Price Changed $159,997 NTREIS
- 2026-04-27 Price Changed $174,997 NTREIS
- 2026-04-20 Price Changed $184,997 NTREIS
- 2026-04-13 Listed $189,997 NTREIS
- 2025-11-24 Sold (Public Records) — Public Records
- 2025-09-24 Sold (Public Records) — Public Records
- 2025-09-24 Sold (Public Records) — Public Records
- 2025-09-17 Sold (Public Records) — Public Records
- 2025-09-17 Sold (Public Records) — Public Records
- 2025-09-09 Sold (Public Records) — Public Records
- 2025-09-09 Sold (Public Records) — Public Records
- 2025-09-09 Sold (Public Records) — Public Records
- 1998-04-21 Sold (Public Records) — Public Records
Property tax history
+7.4%/yrLatest (2025): $4,614 · +0.9% YoY. Source: county tax records.
Cash-flow waterfall
monthlySold comps — $/sqft
last 12 mo · ≤1 miLoading sold comps…