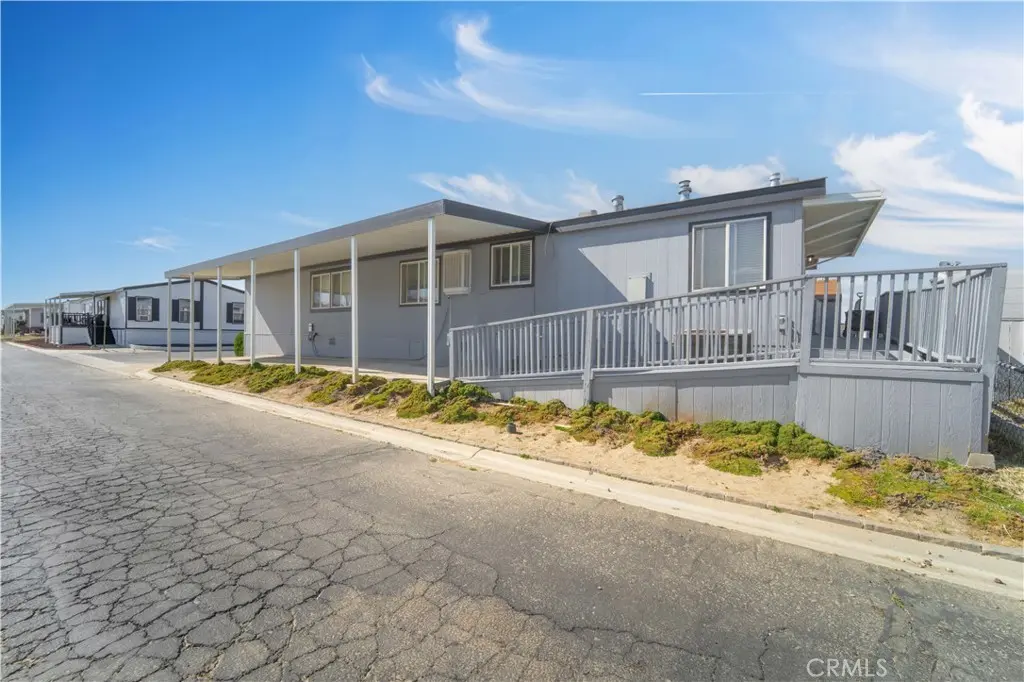
1550 20th St W #76 · Rosamond, CA
Flood risk 6/10 · Moderate
- FEMA flood zone
- X (unshaded)
- Chance of flooding over 30 yrs
- 0.72%
- Est. flood insurance / yr
- $507 – $1,088
Fire risk 3/10 · Minor
- Est. fire insurance / yr
- $659 – $1,223
Heat risk 7/10 · Major
- Hot days now (above 101°F)
- 7 days/yr
- Hot days in 30 yrs
- 19 days/yr
Wind risk 1/10 · Minimal
- Chance of severe wind over 30 yrs
- —
Air-quality risk 8/10 · Major
- Unhealthy air days now
- 16 days/yr
- Unhealthy air days in 30 yrs
- 21 days/yr
Risk factors via First Street. Map © Google.
Why this score? — see what drove the B grade
The composite is a weighted blend of 9 inputs, each scored 0–100. Each bar is that input's sub-score; the figure is the points it added to the 100-point composite (weight × sub-score).
- Cash flow +30.0/30.0
- 1% rule +10.0/10.0
- DSCR +10.0/10.0
- ARV discount +7.5/15.0
- Appreciation +6.2/10.0
- Rent growth +2.5/5.0
- Livability +2.5/5.0
- Condition / age +2.5/5.0
- Schools +2.2/10.0
$169,900
🖨 Deal sheet 📄 Offer letter ✓ Due diligence
Listing remarks MLS
Welcome to 1550 20th St W, Space 76, where comfort and quiet living come together. This spacious home is one of the bigger homes in Tarra Estates. Both bathrooms have been updated with new vanities and toilets. The home also has an electric car charger and a storage shed. If calm and quiet living is what you are looking for, schedule a tour today.
Key facts
- 1,900 sq ft lot
- 2 garage spots
- Built 2007
Property features AI
Finance
- Other: Rural community setting
- HOA & community: Land lease community (land lease amount listed)
Exterior
- Parking: Attached garage; 2 garage spaces (2 total parking spaces)
- Utilities: 220V electrical throughout; Public sewer; District/public water; Natural gas available
- Home design: Single-story; Entry on level 1; No common walls; No ADU
- Construction: Certified 433a foundation
- Exterior features: Manufactured house; Shingle roof; Rectangular lot shape; No pool
Interior
- Kitchen: Microwave; Gas range; Dishwasher; Formal dining room
- Bedrooms: 4 bedrooms on the main level
- Flooring: Laminate flooring
- Bathrooms: 2 full bathrooms; Bathtub in bathroom(s)
- Heating & cooling: Central air conditioning; Natural gas heating; Central furnace
- Interior features: One-story layout; Front door entry; All bedrooms on the main level
- Laundry & utility: Dedicated laundry room
Neighborhood map
What this means for you Summary
Snapshot
- This is a 4-bed/2.0-bath manufactured listed at $170k.
Deal economics
- At list price, monthly cash flow is $1k ($14k/yr) — positive.
- The deal already cash-flows at list — no discount required.
- Meets the 1% rule at list price ($3k rent vs $170k).
- Recommended offer: $165k (3.0% below list) — sets the bar for market timing.
- Cap rate 14.7% vs local median 4.3% in Rosamond — top-decile yield for the area; either an underpriced asset or a hidden risk that comps aren't pricing in. Stress-test before assuming the spread holds.
Location & tenants
- Location reads 49/100 on livability (#1,178 in CA) — a working-class tenant base; expect higher turnover. Strengths: housing A+; Watch: schools F, crime F, amenities F.
- Southern Kern Unified (town): math 25% / reading 25% proficiency, ranked #387 of 517 in CA (top 75%) — low school quality limits family demand, transient renter base, plan for 1-2y turnover; 67% free/reduced lunch — lower-income household profile, screen leases tightly.
- Market conditions: 458 active listings in the ZIP; 10 comparable units currently listed for rent nearby; rentals leasing fast (median 10d on market — plan ~1-2 weeks tenant-placement turnaround); solid renter incomes; 3,244 units permitted in Kern County in 2024 (73 in 5+ unit buildings).
- This rent runs 44% of the median local income ($77k/yr) — at the standard rent-burdened threshold; future hikes will face affordability resistance.
Forward outlook
- In year one you build about $5k of equity ($1k loan paydown + $4k appreciation (2.4% local appreciation)).
- Kern County population projected at +17% by 2050 — long-run rental-demand tailwind backs the buy-and-hold thesis.
- At projected returns (2.4% appreciation + 3.0% rent growth), your $48k cash investment doubles in ~3 years — after that, you're playing with house money.
- By year 7, paydown + projected appreciation supports a ~$33k cash-out refi (75% LTV) — recoverable capital for the next deal without selling this one.
Negotiation context
- It's been on market 56 days — a 3% lower offer ($165k) is reasonable based on typical stale-listing flexibility.
- 3 sale attempts since 8y ago with the ask held roughly flat each time — persistent listings suggest the price (not the market) is what's stuck; bring a comps-based counter.
- Current owner paid $67k; list at $170k implies a 154% gain — meaningful room to come down on a strong offer.
Risks & watch-outs
- Climate carrying-cost: major flood risk; extreme-heat days projected 7→19/yr by 2055 (HVAC capex compounding) — expect insurance premiums to compound above CPI over the hold.
Questions for the listing agent
- It's been on market 56 days. Have you received any prior offers? Is the seller open to a 3% concession, seller financing, or rate buy-down credit?
- Is there a deadline driving the sale (1031 exchange, divorce, estate, relocation)? That informs how much negotiation room exists.
- Schools are F-rated, which usually means shorter tenancies and higher turnover. Who's the typical renter profile here, and what's been the actual vacancy rate?
- Crime grade is F in this area — have there been break-ins, vandalism, or insurance claims at this property in the last 3 years? What carrier currently insures it and at what premium?
- What's the average days-on-market for RENTAL listings here right now (not sales)? A rising rental-DOM trend means longer vacancies and softer asking-rent achievability than the comps imply.
- What's the recent tenant-quality profile in this submarket — average credit score on applications, eviction rate, late-payment / NSF rate, and stable-employment percentage? A property-management company in the area should have these aggregated.
- How much new for-sale + rental construction is in the pipeline within 1–3 miles? Heavy new supply typically softens prices + rents 12–24 months out; constrained supply supports both.
Investment metrics
- 1% rule
- 1.66% ✓
- Cap rate
- 14.65%
- Cash-on-cash
- 29.86%
- DSCR
- 2.33
- GRM
- 5.0
CMA / ARV
- ARV (median comp)
- $390,286
- List price
- $169,900
- Delta
- -56.47%
- Verdict
- UNDERPRICED
- Comps
- 20 within 1.0 mi
Show comp detail 12 sales within ~0.75 mi
| Address | Dist | Beds/Ba | Sqft | Sold | Price | $/sf | Match |
|---|---|---|---|---|---|---|---|
| 1550 W 20th St #25 | 0.00mi | 3/2.0 (-1) | 1,880 (+7%) | 1mo | $170,000 | $90 | 83 |
| 2017 Windcurrent Dr #126 | 0.29mi | 3/2.0 (-1) | 1,782 (+1%) | 0mo | $140,000 | $79 | 79 |
| 2000 Windflow Dr #76 | 0.38mi | 3/2.0 (-1) | 1,762 (+0%) | 1mo | $185,000 | $105 | 76 |
| 1550 W 20th St #18 | 0.00mi | 3/2.0 (-1) | 1,600 (-9%) | 5mo | $160,000 | $100 | 76 |
| 1550 20th W | 0.01mi | 3/2.0 (-1) | 1,600 (-9%) | 5mo | $175,000 | $109 | 75 |
| 1550 20th St W #97 | 0.00mi | 3/2.0 (-1) | 1,600 (-9%) | 12mo | $162,000 | $101 | 70 |
| 2024 Colleen Dr #52 | 0.22mi | 3/2.0 (-1) | 1,680 (-4%) | 11mo | $150,000 | $89 | 68 |
| 2112 Windflower Dr #116 | 0.33mi | 4/2.0 | 1,836 (+4%) | 13mo | $200,000 | $109 | 67 |
| 2117 Windflower Dr #108 | 0.35mi | 5/2.0 (+1) | 1,848 (+5%) | 9mo | $133,000 | $72 | 63 |
| 2016 Windbreak Dr #22 | 0.43mi | 4/2.0 | 1,850 (+5%) | 10mo | $163,000 | $88 | 63 |
| 2013 Windbreak Dr #4 | 0.51mi | 4/2.0 | 1,850 (+5%) | 6mo | $150,000 | $81 | 62 |
| 2021 Windharp #30 | 0.42mi | 4/2.0 | 1,536 (-13%) | 1mo | $108,000 | $70 | 58 |
Match score weights: distance 35% · size 25% · config 20% · recency 20%. Top-matched comps best support the ARV.
Projected returns pro-forma
2.4% appreciation · 3.0% rent growth · sell at horizon
- IRR
- 34.7%
- Equity multiple
- 2.90×
- Total profit
- $90,524
- Equity at exit
- $70,768
- IRR
- 35.4%
- Equity multiple
- 5.69×
- Total profit
- $223,315
- Equity at exit
- $104,874
Cash invested: $47,572 (down + closing). Projections, not guarantees.
Landlord ↔ Tenant lean methodology
- Overall (STATE)
- 18 Strongly Tenant-Friendly
- State California
- 18 Strongly Tenant-Friendly · D+13
- County
- — inherits STATE
- City
- — inherits STATE
ZIP-level market 93560
- Home prices YoY
- 0.6%
- Active inventory
- 458
- Price-to-rent
- 5.0×
Monthly cashflow live
- Estimated rent
- $2,812 high interval (Pro) →
- Mortgage (P&I)
- −$891
- Tax from tax record
- −$76 /mo · $916/yr
- Insurance
- −$71
- HOA
- −$0
- Vacancy / Maint / Mgmt
- −$591
- Net cashflow
- $1,184
Break-even live
UW: 25.0% down · 7.5% · 30yr · 1.5% tax · 5.0% vac · 8.0% maint · 8.0% mgmt
Financing live
Cash to close
- Down payment
- $42,475
- Closing costs
- $5,097
- Reserves months
- —
- Total cash needed
- —
Loan-product check · same deal, 3 products live
Conventional
25% down · 7.5% · 30yr
- Down + closing
- —
- Monthly P&I
- —
- Monthly cashflow
- —
- DSCR
- —
- Eligible?
- —
Personal DTI + credit; lowest rate.
DSCR
20% down · 8.5% · 30yr
- Down + closing
- —
- Monthly P&I
- —
- Monthly cashflow
- —
- DSCR
- —
- Eligible?
- —
No personal income docs; deal must DSCR.
Hard money
10% down · 12.0% · 12mo
- Down + closing
- —
- Monthly P&I
- —
- Monthly cashflow
- —
- DSCR
- —
- Eligible?
- —
Short-term bridge; refi at stabilization.
Rent comps 10 comps
| Address | Beds | Baths | Sqft | Rent | $/sqft | DOM | Units | Dist |
|---|---|---|---|---|---|---|---|---|
| 1943 Pengilley Ave Rosamond, CA | 3.0 | 2.0 | 1379 | $2,600 | $1.89 | 1d | 1 | 0.40mi |
| 1953 Marie Ave Apt A Rosamond, CA | 4.0 | 3.0 | 1753 | $2,550 | $1.45 | 43d | 1 | 0.44mi |
| 1953 Marie Ave Apt A Rosamond, CA | 4.0 | 3.0 | 1753 | $2,550 | $1.45 | 3d | 1 | 0.44mi |
| 2051 Candice Ave Rosamond, CA | 3.0 | 2.0 | 1345 | $2,395 | $1.78 | 15d | 1 | 0.85mi |
| 1838 Center St Unit A Rosamond, CA | 3.0 | 2.5 | 1495 | $2,000 | $1.34 | 1d | 1 | 1.08mi |
| 1838 Center St Unit A Rosamond, CA | 3.0 | 2.5 | 1475 | $2,000 | $1.36 | 10d | 1 | 1.08mi |
| 2917 La Calle Audaz Ave Rosamond, CA | 4.0 | 2.5 | 2583 | $2,900 | $1.12 | 1d | 1 | 1.33mi |
| 3017 Via Bella Rosa Ave Rosamond, CA | 4.0 | 2.0 | 1820 | $2,800 | $1.54 | 43d | 1 | 1.34mi |
| 3016 Erica Ave Rosamond, CA | 5.0 | 3.0 | 2521 | $3,600 | $1.43 | 1d | 1 | 1.42mi |
| 3124 Via Bella Rosa Ave Rosamond, CA | 4.0 | 2.0 | 1809 | $3,200 | $1.77 | 43d | 1 | 1.43mi |
Listing history 20 events
-
2026-06-18days on market $169,900 Active 56 DOM
-
2026-06-17days on market $169,900 Active 55 DOM
-
2026-06-16days on market $169,900 Active 54 DOM
-
2026-06-15days on market $169,900 Active 53 DOM
-
2026-06-13days on market $169,900 Active 51 DOM
-
2026-06-13days on market $169,900 Active 50 DOM
-
2026-06-09days on market $169,900 Active 47 DOM
-
2026-06-08days on market $169,900 Active 46 DOM
-
2026-06-07days on market $169,900 Active 45 DOM
-
2026-06-04days on market $169,900 Active 42 DOM
-
2026-06-03days on market $169,900 Active 41 DOM
-
2026-06-02days on market $169,900 Active 40 DOM
-
2026-06-01days on market $169,900 Active 39 DOM
-
2026-05-31days on market $169,900 Active 38 DOM
-
2026-04-23$169,900 Active 847-char remark
-
2026-04-17$169,900 Active 349-char remark
Show marketing remark (349 chars)
Welcome to 1550 20th St W, Space 76, where comfort and quiet living come together. This spacious home is one of the bigger homes in Tarra Estates. Both bathrooms have been updated with new vanities and toilets. The home also has an electric car charger and a storage shed. If calm and quiet living is what you are looking for, schedule a tour today.
-
2018-05-08historical
Show marketing remark (533 chars)
Mobile Home located in the quiet and clean Tara Estates park. There are four bedrooms and one bonus room located next to the large and open living room. The two back bedrooms have a Jack and Jill bathroom. The large master bedroom has a walk in closet and a garden tub in the bathroom. The kitchen has plenty of counter space and cabinets. Refrigerator, Washer, and Dryer included!! On the exterior of the home there is a storage shed, porch, and large covered driveway that could park multiple cars. Call for your appointment today!
-
2018-04-26soldstatus $67,000 Closed
Show marketing remark (533 chars)
Mobile Home located in the quiet and clean Tara Estates park. There are four bedrooms and one bonus room located next to the large and open living room. The two back bedrooms have a Jack and Jill bathroom. The large master bedroom has a walk in closet and a garden tub in the bathroom. The kitchen has plenty of counter space and cabinets. Refrigerator, Washer, and Dryer included!! On the exterior of the home there is a storage shed, porch, and large covered driveway that could park multiple cars. Call for your appointment today!
-
2018-04-02status Pending
Show marketing remark (533 chars)
Mobile Home located in the quiet and clean Tara Estates park. There are four bedrooms and one bonus room located next to the large and open living room. The two back bedrooms have a Jack and Jill bathroom. The large master bedroom has a walk in closet and a garden tub in the bathroom. The kitchen has plenty of counter space and cabinets. Refrigerator, Washer, and Dryer included!! On the exterior of the home there is a storage shed, porch, and large covered driveway that could park multiple cars. Call for your appointment today!
-
2018-03-24$68,000 Active
Show marketing remark (533 chars)
Mobile Home located in the quiet and clean Tara Estates park. There are four bedrooms and one bonus room located next to the large and open living room. The two back bedrooms have a Jack and Jill bathroom. The large master bedroom has a walk in closet and a garden tub in the bathroom. The kitchen has plenty of counter space and cabinets. Refrigerator, Washer, and Dryer included!! On the exterior of the home there is a storage shed, porch, and large covered driveway that could park multiple cars. Call for your appointment today!
ⓘ Source: listings_history table (triggers on properties + properties_extension) + one-shot
backfill from property_details.listing_events for pre-trigger history.
Tax reassessment forecast CA · Resets to sale price
- Current annual tax
- $916 · $76/mo
- Projected year-2 tax
- $1,291 · $108/mo
- Expected delta
- +$375/yr (+$31/mo · 41.0%)
ⓘ Screening estimate from a state-policy table — verify with the county assessor before closing.
Climate risk First Street
- Flood 6/10 Major FEMA zone X (unshaded) · 72% chance over 30 yrs
- Wildfire 3/10 Moderate
- Heat 7/10 Severe 7 d/yr ≥101°F today · 19 d/yr by 30 yrs out
- Wind 1/10 Low
- Air quality 8/10 Severe 16 unhealthy d/yr today · 21 by 30 yrs out
Nearby sold comps map
Loading sold comps map…
Walkable amenities ~0.75 mi
Loading nearby amenities…
Taxation est. · year 1
- Rental income
- $33,748
- − Mortgage interest
- −$9,517
- − Property taxes
- −$916
- − Insurance
- −$850
- − Repairs & maintenance
- −$2,700
- − Management
- −$2,700
- − Depreciation
- −$4,943
- Taxable income
- $12,123
- Est. tax owed @ 24.0%
- −$2,910
- After-tax cash flow
- $11,294/yr
For passive investors: Depreciation is non-cash, so a rental often shows a tax loss while cash-flowing — sheltering income. Rental losses are passive: they offset passive income freely, and up to $25,000/yr can offset ordinary (W-2) income if you actively participate and your MAGI is under $100k (phasing out to $0 by $150k); unused losses carry forward. On sale, claimed depreciation is recaptured at up to 25%, and gains may owe capital-gains tax (a 1031 exchange can defer both). Figures are a year-1 estimate at your 24.0% rate — not tax advice; consult a CPA.
Schools (NCES district)
- District
- Southern Kern Unified
- NCES district ID
- 0637620
- Math proficiency
- 25% ▲ 7.00%
- Reading proficiency
- 25% ▼ -8.00%
- Median HH income
- $54,523
- Composite
- 22.5/100
- National rank
- #8093
- State rank
- #387 of 517 in CA
Livability — Rosamond
- Score
- 49/100
- State rank
- #1178
- US rank
- #25952
Category grades
Schools grade is shown separately in the Schools card above.
Census & demographics
- Census place
- Rosamond, CA
- County
- Kern County · 710,371 people
- City population
- 22,119
- Metro
- Bakersfield, CA
- Population (ZIP)
- 22,119
- Household income
- $77,431
- Rent vs Own
- Severe rent burden
- 425.0
Population outlook (Kern County) Hauer SSP2
- Today (2025)
- 947,286 people
- By 2030
- 978,984 · +3.3%
- By 2040
- 1,045,018 · +10.3%
- By 2050
- 1,105,232 · +16.7%
- By 2075
- 1,229,538 · +29.8%
- By 2100
- 1,238,059 · +30.7%
Race, ethnicity, and origin ACS 2023
- Neighborhood character
- Diverse neighborhood (Simpson 0.68)
- Race & ethnicity
- Hispanic / Latino 45% White 32% Two or more races 17% Black 13% Asian 3% Native American 1%
- Hispanic origin (detail)
- Mexican 35%
- Common ancestry
- Portuguese 2% Italian 2% Lithuanian 1%
- Foreign-born
- 13% · Canada
- Languages at home
- 68% English-only · Spanish 28% Other Indo-European 2% Other Asian/Pacific 1%
Political lean MEDSL · Kern
- 2024 margin
- Strong R (+21.1) · D 38.2% · R 59.3% · Other 2.5%
- 2008→2024 swing
- -3.3pp toward R · 2008: -17.8pp · 2024: -21.1pp
- All cycles
- 2024: R+21.1 2020: R+10.2 2016: R+15.0 2012: R+20.9 2008: R+17.8
Not yet ingested
- Civics
- —
Market trends
- HPI YoY
- ▲ 2.40%
- Current HPI
- 403.7206
- Rent YoY
- —
- Metro
- Bakersfield, CA
- State GDP YoY
- ▲ 3.21%
- F500 in state
- 116
Industry mix (Fortune 500 HQ in CA)
| Industry | F500 HQs | Revenue |
|---|---|---|
| Technology | 27 | $1,492B |
|
||
| Financial Services | 3 | $174B |
|
||
| Retail | 3 | $44B |
|
||
| Insurance | 3 | $26B |
|
||
| Media / Entertainment | 2 | $115B |
|
||
| Pharmaceuticals / Biotech | 2 | $62B |
|
||
Price history
+142.5% since first listed7 events — show timeline
- 2026-05-21 Price Changed $164,900 AVMLS
- 2026-04-23 Listed $169,900 CRMLS
- 2026-04-17 Listed $169,900 AVMLS
- 2018-05-08 Listing Removed — AVMLS
- 2018-04-26 Sold (MLS) $67,000 AVMLS
- 2018-04-02 Pending — AVMLS
- 2018-03-24 Listed $68,000 AVMLS
Property tax history
+6.1%/yrLatest (2025): $916 · +7.2% YoY. Source: county tax records.
Cash-flow waterfall
monthlySold comps — $/sqft
last 12 mo · ≤1 miLoading sold comps…