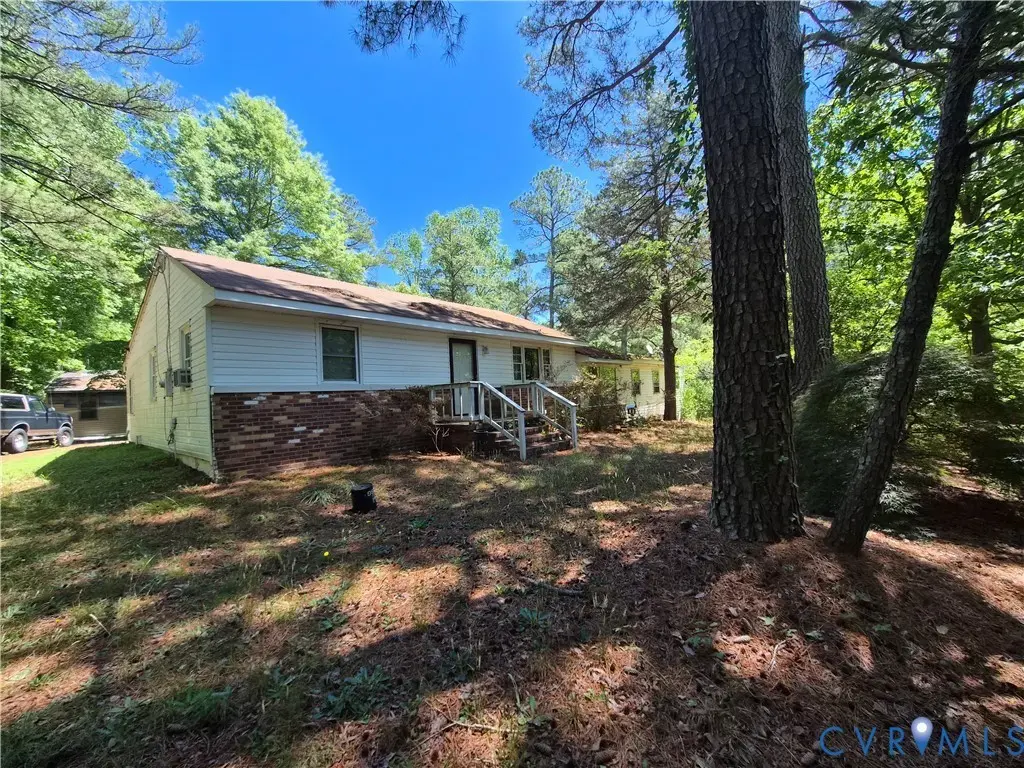
9528 Old Stage Rd · Prince George, VA
Flood risk 1/10 · Minimal
- FEMA flood zone
- X (unshaded)
- Chance of flooding over 30 yrs
- 0.0%
- Est. flood insurance / yr
- $507 – $1,088
Fire risk 5/10 · Moderate
- Est. fire insurance / yr
- $666 – $1,236
Heat risk 7/10 · Major
- Hot days now (above 108°F)
- 7 days/yr
- Hot days in 30 yrs
- 16 days/yr
Wind risk 6/10 · Moderate
- Chance of severe wind over 30 yrs
- 52.0%
Air-quality risk 2/10 · Minimal
- Unhealthy air days now
- 1 days/yr
- Unhealthy air days in 30 yrs
- 2 days/yr
Risk factors via First Street. Map © Google.
Why this score? — see what drove the D grade
The composite is a weighted blend of 9 inputs, each scored 0–100. Each bar is that input's sub-score; the figure is the points it added to the 100-point composite (weight × sub-score).
- Cash flow +14.0/30.0
- ARV discount +7.5/15.0
- Schools +6.1/10.0
- DSCR +4.2/10.0
- 1% rule +3.5/10.0
- Livability +3.4/5.0
- Rent growth +2.5/5.0
- Condition / age +2.5/5.0
- Appreciation +0.0/10.0
$199,950
🖨 Deal sheet 📄 Offer letter ✓ Due diligence
Listing remarks
Come see this amazing home. It just needs some renovating and updating to bring it back in shape. This unique home features many bathrooms and an interesting layout with a large master suite on one end and the family living area at the other. The property features ample storage and garage locations with a secluded country feel. Make your offer and grab up this home before it's gone. Deals like this don't come around often.
Key facts
- Unique home
- Interesting layout
- Large master suite
Tags
Property features AI
Exterior
- Parking: Detached garage; Garage with approximately 2.5 spaces
- Utilities: Well water; Septic tank
- Home design: Single-story home; Resale property
- Construction: Brick and brick veneer with frame construction; Shingle roof
- Exterior features: Circular driveway; Off-street parking; Lot zoned R-A
Interior
- Kitchen: Dishwasher
- Bedrooms: At least one bedroom on the first level
- Bathrooms: 1 full bathroom with tub & shower; 1 half bathroom (first level)
- Heating & cooling: Electric heating; Wood stove; Window unit cooling
- Interior features: Bedroom on main level; Crawl space basement; Masonry fireplace (1)
Neighborhood map
What this means for you Summary
Snapshot
- This is a 3-bed/1.5-bath single-family listed at $200k.
Deal economics
- At list price, monthly cash flow is $24 ($292/yr) — positive.
- The deal already cash-flows at list — no discount required.
- To meet the 1% rule (rent ≥ 1% of price), the offer needs to be $170k (15.2% below list).
- Recommended offer: $170k (15.2% below list) — sets the bar for 1% rule.
- Cap rate 6.4% vs local median 3.7% in Prince George — top-decile yield for the area; either an underpriced asset or a hidden risk that comps aren't pricing in. Stress-test before assuming the spread holds.
Location & tenants
- Location reads 67/100 on livability (#296 in VA) — a middle-class / working-renter tenant base. Strengths: crime A+, housing A+, schools B+; Watch: amenities F, commute F, health & safety F.
- Prince George County Public School District (rural): math 67% / reading 75% proficiency, ranked #16 of 131 in VA (top 12%) — strong family-tenant draw, lease renewals of 3-5y typical.
- Market conditions: 54 active listings in the ZIP; 72 units permitted in Prince George County in 2024 (0 in 5+ unit buildings).
Forward outlook
- Local home prices are declining (-3.0%/yr); year-one equity from $1k of loan paydown is wiped out by about $6k of value loss. Plan a longer hold.
- Prince George County population projected at +36% by 2050 — long-run rental-demand tailwind backs the buy-and-hold thesis.
Negotiation context
- It's been on market 34 days — a 3% lower offer ($194k) is reasonable based on typical stale-listing flexibility.
Risks & watch-outs
- Climate carrying-cost: major wind risk, 52% chance of damaging wind over 30y; moderate wildfire risk; extreme-heat days projected 7→16/yr by 2055 (HVAC capex compounding) — expect insurance premiums to compound above CPI over the hold.
Questions for the listing agent
- It's been on market 34 days. Have you received any prior offers? Is the seller open to a 15% concession, seller financing, or rate buy-down credit?
- Built in 1960 — when were the roof, HVAC, electrical panel, plumbing, and water heater last replaced?
- Is there a deadline driving the sale (1031 exchange, divorce, estate, relocation)? That informs how much negotiation room exists.
- Schools are B-rated — typically a magnet for longer-tenancy family renters. What's the average tenant stay here, and is there a school-zone premium baked into asking?
- The area grade is low — what's the realistic commute time and amenity access for the typical tenant pool here? Any planned neighborhood developments (good or bad) we should know about?
- What's the average days-on-market for RENTAL listings here right now (not sales)? A rising rental-DOM trend means longer vacancies and softer asking-rent achievability than the comps imply.
- What's the recent tenant-quality profile in this submarket — average credit score on applications, eviction rate, late-payment / NSF rate, and stable-employment percentage? A property-management company in the area should have these aggregated.
- How much new for-sale + rental construction is in the pipeline within 1–3 miles? Heavy new supply typically softens prices + rents 12–24 months out; constrained supply supports both.
Investment metrics
- 1% rule
- 0.85% ✗
- Cap rate
- 6.44%
- Cash-on-cash
- 0.52%
- DSCR
- 1.02
- GRM
- 9.8
CMA / ARV
- ARV (median comp)
- $439,605
- List price
- $199,950
- Delta
- -54.52%
- Verdict
- UNDERPRICED
- Comps
- 7 within 1.0 mi
Show comp detail 2 sales within ~0.75 mi
| Address | Dist | Beds/Ba | Sqft | Sold | Price | $/sf | Match |
|---|---|---|---|---|---|---|---|
| 5505 Castlewood Dr | 0.41mi | 4/2.0 (+1) | 2,420 (+7%) | 8mo | $382,000 | $158 | 56 |
| 9612 Shadywood Rd | 0.26mi | 4/2.5 (+1) | 2,588 (+15%) | 17mo | $450,000 | $174 | 40 |
Match score weights: distance 35% · size 25% · config 20% · recency 20%. Top-matched comps best support the ARV.
Projected returns pro-forma
-3.0% appreciation · 3.0% rent growth · sell at horizon
- IRR
- -15.5%
- Equity multiple
- 0.45×
- Total profit
- $-30,867
- Equity at exit
- $29,813
- IRR
- -7.0%
- Equity multiple
- 0.55×
- Total profit
- $-24,947
- Equity at exit
- $17,288
Cash invested: $55,986 (down + closing). Projections, not guarantees.
Landlord ↔ Tenant lean methodology
- Overall (STATE)
- 55 Moderately Landlord-Leaning
- State Virginia
- 55 Moderately Landlord-Leaning · D+2
- County
- — inherits STATE
- City
- — inherits STATE
ZIP-level market 23875
- Home prices YoY
- -16.6%
- Active inventory
- 54
- Price-to-rent
- 9.8×
Monthly cashflow live
- Estimated rent
- $1,696 medium interval (Pro) →
- Mortgage (P&I)
- −$1,049
- Tax from tax record
- −$184 /mo · $2,205/yr
- Insurance
- −$83
- HOA
- −$0
- Vacancy / Maint / Mgmt
- −$356
- Net cashflow
- $24
Break-even live
UW: 25.0% down · 7.5% · 30yr · 1.5% tax · 5.0% vac · 8.0% maint · 8.0% mgmt
Financing live
Cash to close
- Down payment
- $49,988
- Closing costs
- $5,998
- Reserves months
- —
- Total cash needed
- —
Loan-product check · same deal, 3 products live
Conventional
25% down · 7.5% · 30yr
- Down + closing
- —
- Monthly P&I
- —
- Monthly cashflow
- —
- DSCR
- —
- Eligible?
- —
Personal DTI + credit; lowest rate.
DSCR
20% down · 8.5% · 30yr
- Down + closing
- —
- Monthly P&I
- —
- Monthly cashflow
- —
- DSCR
- —
- Eligible?
- —
No personal income docs; deal must DSCR.
Hard money
10% down · 12.0% · 12mo
- Down + closing
- —
- Monthly P&I
- —
- Monthly cashflow
- —
- DSCR
- —
- Eligible?
- —
Short-term bridge; refi at stabilization.
Listing history 10 events
-
2026-06-13pricestatusdays on market $199,950 Pending 34 DOM
-
2026-06-10days on market $289,000 Active 32 DOM
-
2026-06-09days on market $289,000 Active 31 DOM
-
2026-06-08days on market $289,000 Active 30 DOM
-
2026-06-07days on market $289,000 Active 29 DOM
-
2026-06-03days on market $289,000 Active 25 DOM
-
2026-06-02days on market $289,000 Active 24 DOM
-
2026-06-01days on market $289,000 Active 23 DOM
-
2026-05-31days on market $289,000 Active 22 DOM
-
2026-05-08$289,000 Active 426-char remark
ⓘ Source: listings_history table (triggers on properties + properties_extension) + one-shot
backfill from property_details.listing_events for pre-trigger history.
Tax reassessment forecast VA · Resets to sale price
- Current annual tax
- $2,205 · $184/mo
- Projected year-2 tax
- $2,205 · $184/mo
- Expected delta
- $0/yr ($0/mo · 0.0%)
ⓘ Screening estimate from a state-policy table — verify with the county assessor before closing.
Climate risk First Street
- Flood 1/10 Low FEMA zone X (unshaded) · 0% chance over 30 yrs
- Wildfire 5/10 Major
- Heat 7/10 Severe 7 d/yr ≥108°F today · 16 d/yr by 30 yrs out
- Wind 6/10 Major 52% chance of damaging wind over 30 yrs
- Air quality 2/10 Low 1 unhealthy d/yr today · 2 by 30 yrs out
Nearby sold comps map
Loading sold comps map…
Walkable amenities ~0.75 mi
Loading nearby amenities…
Taxation est. · year 1
- Rental income
- $20,353
- − Mortgage interest
- −$11,200
- − Property taxes
- −$2,205
- − Insurance
- −$1,000
- − Repairs & maintenance
- −$1,628
- − Management
- −$1,628
- − Depreciation
- −$5,817
- Taxable loss
- −$3,125
- Est. tax savings @ 24.0%
- +$750
- After-tax cash flow
- $1,042/yr
For passive investors: Depreciation is non-cash, so a rental often shows a tax loss while cash-flowing — sheltering income. Rental losses are passive: they offset passive income freely, and up to $25,000/yr can offset ordinary (W-2) income if you actively participate and your MAGI is under $100k (phasing out to $0 by $150k); unused losses carry forward. On sale, claimed depreciation is recaptured at up to 25%, and gains may owe capital-gains tax (a 1031 exchange can defer both). Figures are a year-1 estimate at your 24.0% rate — not tax advice; consult a CPA.
Schools (NCES district)
- District
- Prince George County Public School District
- NCES district ID
- 5103090
- Math proficiency
- 67% ▼ -17.00%
- Reading proficiency
- 75% ▼ -8.00%
- Median HH income
- $63,354
- Composite
- 61.44/100
- National rank
- #759
- State rank
- #16 of 131 in VA
Livability — Prince George
- Score
- 67/100
- State rank
- #296
- US rank
- #10557
Category grades
Schools grade is shown separately in the Schools card above.
Census & demographics
- County
- Prince George County · 13,029 people
- City population
- 13,029
- Metro
- Richmond, VA
- Population (ZIP)
- 13,029
- Household income
- $74,543
- Rent vs Own
- Severe rent burden
- 386.0
Population outlook (Prince George County) Hauer SSP2
- Today (2025)
- 44,946 people
- By 2030
- 48,155 · +7.1%
- By 2040
- 54,455 · +21.2%
- By 2050
- 61,115 · +36.0%
- By 2075
- 78,510 · +74.7%
- By 2100
- 85,572 · +90.4%
Race, ethnicity, and origin ACS 2023
- Neighborhood character
- Diverse neighborhood (Simpson 0.61)
- Race & ethnicity
- White 50% Black 37% Two or more races 6% Hispanic / Latino 5% Asian 2%
- Hispanic origin (detail)
- Mexican 3%
- Common ancestry
- Slovak 2% Iranian 1% Lithuanian 1%
- Foreign-born
- 4% · Canada, South Korea
- Languages at home
- 96% English-only · Spanish 2% German/W. Germanic 1%
Political lean MEDSL · Prince George
- 2024 margin
- Strong R (+21.3) · D 38.9% · R 60.2%
- 2008→2024 swing
- -11.2pp toward R · 2008: -10.1pp · 2024: -21.3pp
- All cycles
- 2024: R+21.3 2020: R+17.2 2016: R+17.0 2012: R+9.8 2008: R+10.1
Not yet ingested
- Civics
- —
Market trends
- HPI YoY
- ▼ -62.14%
- Current HPI
- 312.6787
- Rent YoY
- —
- Metro
- Richmond, VA
- State GDP YoY
- ▲ 2.40%
- F500 in state
- 50
Industry mix (Fortune 500 HQ in VA)
| Industry | F500 HQs | Revenue |
|---|---|---|
| Aerospace / Defense | 4 | $236B |
|
||
| Technology / Defense | 3 | $32B |
|
||
| Financial Services | 2 | $176B |
|
||
| Utilities | 2 | $27B |
|
||
| Insurance | 2 | $25B |
|
||
| Technology | 2 | $15B |
|
||
Price history
-30.8% since first listed3 events — show timeline
- 2026-06-12 Pending — CVRMLS
- 2026-06-10 Price Changed $199,950 CVRMLS
- 2026-05-08 Listed $289,000 CVRMLS
Property tax history
+3.5%/yrLatest (2025): $2,205 · +0.0% YoY. Source: county tax records.
Cash-flow waterfall
monthlySold comps — $/sqft
last 12 mo · ≤1 miLoading sold comps…