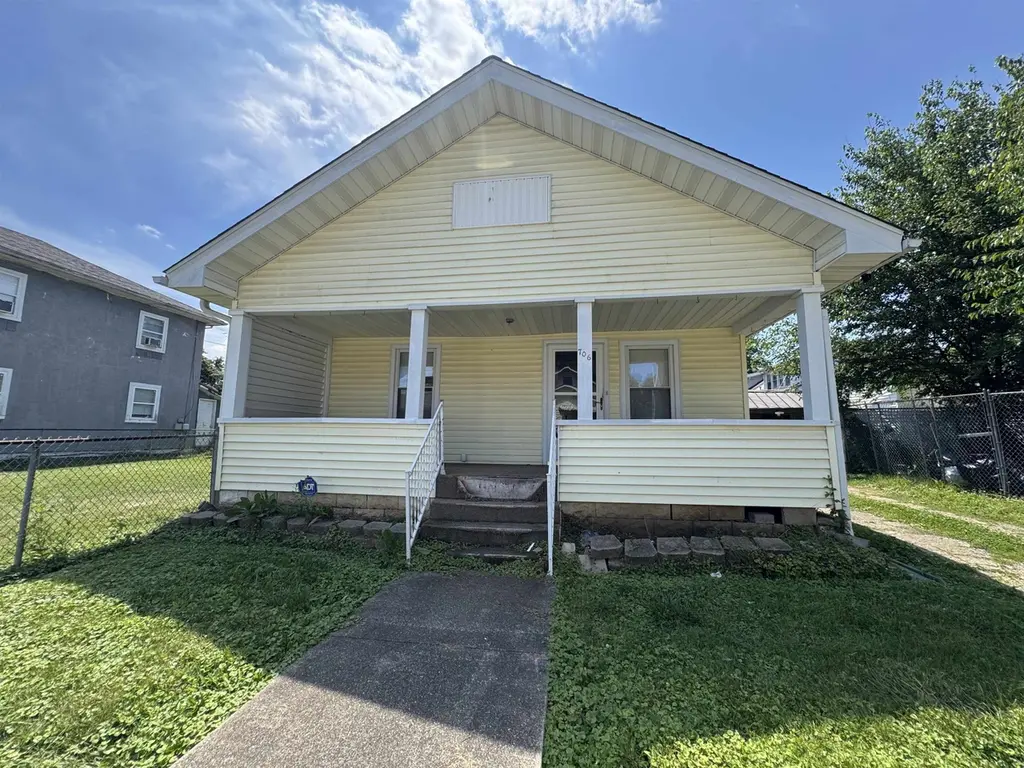
706 Gill St · Huntington, WV
Flood risk 1/10 · Minimal
- FEMA flood zone
- X (unshaded)
- Chance of flooding over 30 yrs
- 0.0%
- Est. flood insurance / yr
- $507 – $1,088
Fire risk 4/10 · Minor
- Est. fire insurance / yr
- $787 – $1,461
Heat risk 5/10 · Moderate
- Hot days now (above 103°F)
- 7 days/yr
- Hot days in 30 yrs
- 19 days/yr
Wind risk 2/10 · Minimal
- Chance of severe wind over 30 yrs
- 1.0%
Air-quality risk 1/10 · Minimal
- Unhealthy air days now
- 0 days/yr
- Unhealthy air days in 30 yrs
- 0 days/yr
Risk factors via First Street. Map © Google.
Why this score? — see what drove the B- grade
The composite is a weighted blend of 9 inputs, each scored 0–100. Each bar is that input's sub-score; the figure is the points it added to the 100-point composite (weight × sub-score).
- Cash flow +25.6/30.0
- ARV discount +13.5/15.0
- DSCR +8.5/10.0
- 1% rule +6.7/10.0
- Rent growth +5.0/5.0
- Livability +4.0/5.0
- Schools +3.0/10.0
- Condition / age +2.5/5.0
- Appreciation +0.0/10.0
$84,500
🖨 Deal sheet 📄 Offer letter ✓ Due diligence
Listing remarks
This well-maintained 2-bedroom, 1-bath home offers exceptional value and endless potential. Featuring updated vinyl siding, a newer roof, and situated on two lots, you’ll enjoy a spacious fenced yard, storage building, and a detached 2-car garage with convenient alley access—no need for street parking. The inviting covered front porch welcomes you inside, where you’ll find original hardwood floors ready to be brought back to life. The home offers a comfortable living room, formal dining room, kitchen with custom cabinetry, and a large utility room providing additional storage and functionality. Whether you’re a first-time homebuyer, investor, or someone looking to ad
Key facts
- Close to town
- Double lot
- Close to park
Tags
Property features AI
Exterior
- Parking: Detached 2-car garage; On-street parking available
- Utilities: Public water; Public sewer
- Home design: Single family residence; Single-story
- Construction: Vinyl siding; Shingle roof
- Exterior features: Front porch; Chain link fencing; Level lot
Interior
- Kitchen: Range; Oven; Refrigerator
- Flooring: Wood floors
- Bathrooms: 1 full bathroom
- Heating & cooling: Window unit cooling
- Interior features: Insulated windows; Crawl space basement
Neighborhood map
What this means for you Summary
Snapshot
- This is a 2-bed/1.0-bath single-family listed at $84k.
Deal economics
- At list price, monthly cash flow is $200 ($2k/yr) — positive.
- The deal already cash-flows at list — no discount required.
- Meets the 1% rule at list price ($993 rent vs $84k).
- Recommended offer: $79k (6.0% below list) — sets the bar for market timing.
- Cap rate 9.1% vs local median 6.5% in Huntington — top-decile yield for the area; either an underpriced asset or a hidden risk that comps aren't pricing in. Stress-test before assuming the spread holds.
Location & tenants
- Location reads 79/100 on livability (#16 in WV, #2,045 nationally) — a middle-class / working-renter tenant base. Strengths: amenities A+, commute A+, cost of living A+; Watch: crime F, employment F.
- Cabell County Schools (urban): math 31% / reading 42% proficiency, ranked #13 of 55 in WV (top 24%) — families likely to look elsewhere, expect single-tenant / working-renter base with shorter leases.
- Zoned schools: Central City Elementary School (math 22% / reading 22%, grade F, #324 of 377 statewide, top 89%, 407 students, 0% FRL); Huntington Middle School (math 21% / reading 35%, grade F, #66 of 109 statewide, top 63%, 647 students, 0% FRL); Huntington High School (math 26% / reading 50%, grade F, #31 of 110 statewide, top 28%, 1,704 students, 0% FRL) — zoned schools average 0% FRL vs 47% district-wide (47 pts lower); this property's tenant base skews higher-income than the district average.
- Market conditions: Rents rising fast (+10.6%/yr); 127 active listings in the ZIP; 1 comparable units currently listed for rent nearby; 61 units permitted in Cabell County in 2024 (5 in 5+ unit buildings).
Forward outlook
- Local home prices are declining (-3.0%/yr); year-one equity from $584 of loan paydown is wiped out by about $3k of value loss. Plan a longer hold.
- At projected returns (-3.0% appreciation + 8.0% rent growth), your $24k cash investment doubles in ~8 years — after that, you're playing with house money.
Negotiation context
- It's been on market 71 days — a 6% lower offer ($79k) is reasonable based on typical stale-listing flexibility.
Risks & watch-outs
- Watch-outs: built in 1928 — expect roof / HVAC / electrical / plumbing capex.
- Climate carrying-cost: extreme-heat days projected 7→19/yr by 2055 (HVAC capex compounding) — expect insurance premiums to compound above CPI over the hold.
Questions for the listing agent
- It's been on market 71 days. Have you received any prior offers? Is the seller open to a 6% concession, seller financing, or rate buy-down credit?
- Built in 1928 — when were the roof, HVAC, electrical panel, plumbing, and water heater last replaced?
- Why hasn't it sold? Are there any deal-killer items the seller is aware of (foundation, flood, title, zoning, code violations)?
- Is there a deadline driving the sale (1031 exchange, divorce, estate, relocation)? That informs how much negotiation room exists.
- Crime grade is F in this area — have there been break-ins, vandalism, or insurance claims at this property in the last 3 years? What carrier currently insures it and at what premium?
- What's the average days-on-market for RENTAL listings here right now (not sales)? A rising rental-DOM trend means longer vacancies and softer asking-rent achievability than the comps imply.
- What's the recent tenant-quality profile in this submarket — average credit score on applications, eviction rate, late-payment / NSF rate, and stable-employment percentage? A property-management company in the area should have these aggregated.
- How much new for-sale + rental construction is in the pipeline within 1–3 miles? Heavy new supply typically softens prices + rents 12–24 months out; constrained supply supports both.
Investment metrics
- 1% rule
- 1.17% ✓
- Cap rate
- 9.14%
- Cash-on-cash
- 10.16%
- DSCR
- 1.45
- GRM
- 7.1
CMA / ARV
- ARV (on-the-fly)
- $97,440
- Comps found
- 8
Show comp detail 8 sales within ~0.75 mi
| Address | Dist | Beds/Ba | Sqft | Sold | Price | $/sf | Match |
|---|---|---|---|---|---|---|---|
| 248 6th Avenue West Ave | 0.15mi | 2/1.0 | 846 (+1%) | 5mo | $55,000 | $65 | 87 |
| 708 5th Street West St | 0.10mi | 2/1.0 | 768 (-9%) | 3mo | $88,900 | $116 | 79 |
| 226 Carrington Ct | 0.22mi | 2/1.0 | 884 (+5%) | 8mo | $70,000 | $79 | 74 |
| 311 W 8th Ave | 0.13mi | 3/1.0 (+1) | 912 (+9%) | 9mo | $117,500 | $129 | 67 |
| 417 7th Ave W | 0.06mi | 3/1.0 (+1) | 912 (+9%) | 22mo | $71,500 | $78 | 60 |
| 547 9th Avenue West Ave | 0.31mi | 2/1.0 | 750 (-11%) | 14mo | $110,000 | $147 | 56 |
| 541 10th Ave Ave W | 0.36mi | 2/1.0 | 751 (-11%) | 14mo | $118,000 | $157 | 54 |
| 421 9th Street West St | 0.59mi | 2/1.0 | 840 (0%) | 23mo | $76,000 | $90 | 54 |
Match score weights: distance 35% · size 25% · config 20% · recency 20%. Top-matched comps best support the ARV.
Projected returns pro-forma
-3.0% appreciation · 8.0% rent growth · sell at horizon
- IRR
- 4.5%
- Equity multiple
- 1.18×
- Total profit
- $4,321
- Equity at exit
- $12,599
- IRR
- 18.2%
- Equity multiple
- 2.86×
- Total profit
- $44,120
- Equity at exit
- $7,306
Cash invested: $23,660 (down + closing). Projections, not guarantees.
Landlord ↔ Tenant lean methodology
- Overall (STATE)
- 83 Strongly Landlord-Friendly
- State West Virginia
- 83 Strongly Landlord-Friendly · R+22
- County
- — inherits STATE
- City
- — inherits STATE
ZIP-level market 25701
- Home prices YoY
- -8.7%
- Rents YoY
- 10.6%
- Active inventory
- 127
- Price-to-rent
- 7.1×
Monthly cashflow live
- Estimated rent
- $993 medium interval (Pro) →
- Mortgage (P&I)
- −$443
- Tax est. 1.5%
- −$106 /mo · $1,268/yr
- Insurance
- −$35
- HOA
- −$0
- Vacancy / Maint / Mgmt
- −$208
- Net cashflow
- $200
Break-even live
UW: 25.0% down · 7.5% · 30yr · 1.5% tax · 5.0% vac · 8.0% maint · 8.0% mgmt
Financing live
Cash to close
- Down payment
- $21,125
- Closing costs
- $2,535
- Reserves months
- —
- Total cash needed
- —
Loan-product check · same deal, 3 products live
Conventional
25% down · 7.5% · 30yr
- Down + closing
- —
- Monthly P&I
- —
- Monthly cashflow
- —
- DSCR
- —
- Eligible?
- —
Personal DTI + credit; lowest rate.
DSCR
20% down · 8.5% · 30yr
- Down + closing
- —
- Monthly P&I
- —
- Monthly cashflow
- —
- DSCR
- —
- Eligible?
- —
No personal income docs; deal must DSCR.
Hard money
10% down · 12.0% · 12mo
- Down + closing
- —
- Monthly P&I
- —
- Monthly cashflow
- —
- DSCR
- —
- Eligible?
- —
Short-term bridge; refi at stabilization.
Rent comps 1 comps
| Address | Beds | Baths | Sqft | Rent | $/sqft | DOM | Units | Dist |
|---|---|---|---|---|---|---|---|---|
| 605 9th St Huntington, WV | 1.0 | 1.0 | 672 | $838 | $1.25 | 43d | 1 | 0.96mi |
Listing history 20 events
-
2026-06-19days on market $84,500 Active 71 DOM
-
2026-06-18days on market $84,500 Active 70 DOM
-
2026-06-17days on market $84,500 Active 69 DOM
-
2026-06-16days on market $84,500 Active 68 DOM
-
2026-06-15days on market $84,500 Active 67 DOM
-
2026-06-14days on market $84,500 Active 65 DOM
-
2026-06-12remarks 675-char remark
-
2026-06-12days on market $84,500 Active 64 DOM
-
2026-06-09days on market $84,500 Active 61 DOM
-
2026-06-08days on market $84,500 Active 60 DOM
-
2026-06-07days on market $84,500 Active 59 DOM
-
2026-06-05remarks 311-char remark
-
2026-06-05days on market $84,500 Active 56 DOM
-
2026-06-03days on market $84,500 Active 55 DOM
-
2026-06-02days on market $84,500 Active 54 DOM
-
2026-06-01days on market $84,500 Active 53 DOM
-
2026-05-31days on market $84,500 Active 52 DOM
-
2026-05-30days on market $84,500 Active 51 DOM
-
2026-04-21price $89,999
-
2026-04-09$94,600 Active
ⓘ Source: listings_history table (triggers on properties + properties_extension) + one-shot
backfill from property_details.listing_events for pre-trigger history.
Climate risk First Street
- Flood 1/10 Low FEMA zone X (unshaded) · 0% chance over 30 yrs
- Wildfire 4/10 Moderate
- Heat 5/10 Major 7 d/yr ≥103°F today · 19 d/yr by 30 yrs out
- Wind 2/10 Low 100% chance of damaging wind over 30 yrs
- Air quality 1/10 Low 0 unhealthy d/yr today · 0 by 30 yrs out
Nearby sold comps map
Loading sold comps map…
Walkable amenities ~0.75 mi
Loading nearby amenities…
Taxation est. · year 1
- Rental income
- $11,912
- − Mortgage interest
- −$4,733
- − Property taxes
- −$1,268
- − Insurance
- −$422
- − Repairs & maintenance
- −$953
- − Management
- −$953
- − Depreciation
- −$2,458
- Taxable income
- $1,124
- Est. tax owed @ 24.0%
- −$270
- After-tax cash flow
- $2,133/yr
For passive investors: Depreciation is non-cash, so a rental often shows a tax loss while cash-flowing — sheltering income. Rental losses are passive: they offset passive income freely, and up to $25,000/yr can offset ordinary (W-2) income if you actively participate and your MAGI is under $100k (phasing out to $0 by $150k); unused losses carry forward. On sale, claimed depreciation is recaptured at up to 25%, and gains may owe capital-gains tax (a 1031 exchange can defer both). Figures are a year-1 estimate at your 24.0% rate — not tax advice; consult a CPA.
Schools (NCES district)
- District
- Cabell County Schools
- NCES district ID
- 5400180
- Math proficiency
- 31% ▼ -7.00%
- Reading proficiency
- 42% ▼ -6.00%
- Median HH income
- $36,426
- Composite
- 30.26/100
- National rank
- #6285
- State rank
- #13 of 55 in WV
Livability — Huntington
- Score
- 79/100
- State rank
- #16
- US rank
- #2045
Category grades
Schools grade is shown separately in the Schools card above.
Census & demographics
- Census place
- Huntington, WV
- County
- Cabell County · 30,893 people
- City population
- 25,795
- Metro
- Huntington-Ashland, WV-KY-OH
- Population (ZIP)
- 21,197
- Household income
- $56,292
- Rent vs Own
- Severe rent burden
- 1186.0
Population outlook (Cabell County) Hauer SSP2
- Today (2025)
- 97,574 people
- By 2030
- 98,060 · +0.5%
- By 2040
- 98,817 · +1.3%
- By 2050
- 100,185 · +2.7%
- By 2075
- 105,895 · +8.5%
- By 2100
- 105,948 · +8.6%
Race, ethnicity, and origin ACS 2023
- Neighborhood character
- Predominantly White (82%)
- Race & ethnicity
- White 82% Black 8% Two or more races 6% Hispanic / Latino 2% Asian 2%
- Common ancestry
- Slovak 4% Italian 2% Serbian 2%
- Foreign-born
- 2% · China
- Languages at home
- 96% English-only · Spanish 2% Other Indo-European 1% Chinese 1%
Political lean MEDSL · Cabell
- 2024 margin
- Strong R (+21.9) · D 38.0% · R 59.9% · Other 2.0%
- 2008→2024 swing
- -11.8pp toward R · 2008: -10.1pp · 2024: -21.9pp
- All cycles
- 2024: R+21.9 2020: R+18.0 2016: R+25.5 2012: R+13.9 2008: R+10.1
Not yet ingested
- Civics
- —
Market trends
- HPI YoY
- ▼ -19.39%
- Current HPI
- 202.9629
- Rent YoY
- ▲ 10.58%
- Metro
- Huntington-Ashland, WV-KY-OH
- State GDP YoY
- —
- F500 in state
- 0
Price history
-4.9% since first listed2 events — show timeline
- 2026-04-21 Price Changed $89,999 HBRMLS
- 2026-04-09 Listed $94,600 HBRMLS
Property tax history
+11.0%/yrLatest (2025): $168 · +56.6% YoY. Source: county tax records.
Cash-flow waterfall
monthlySold comps — $/sqft
last 12 mo · ≤1 miLoading sold comps…