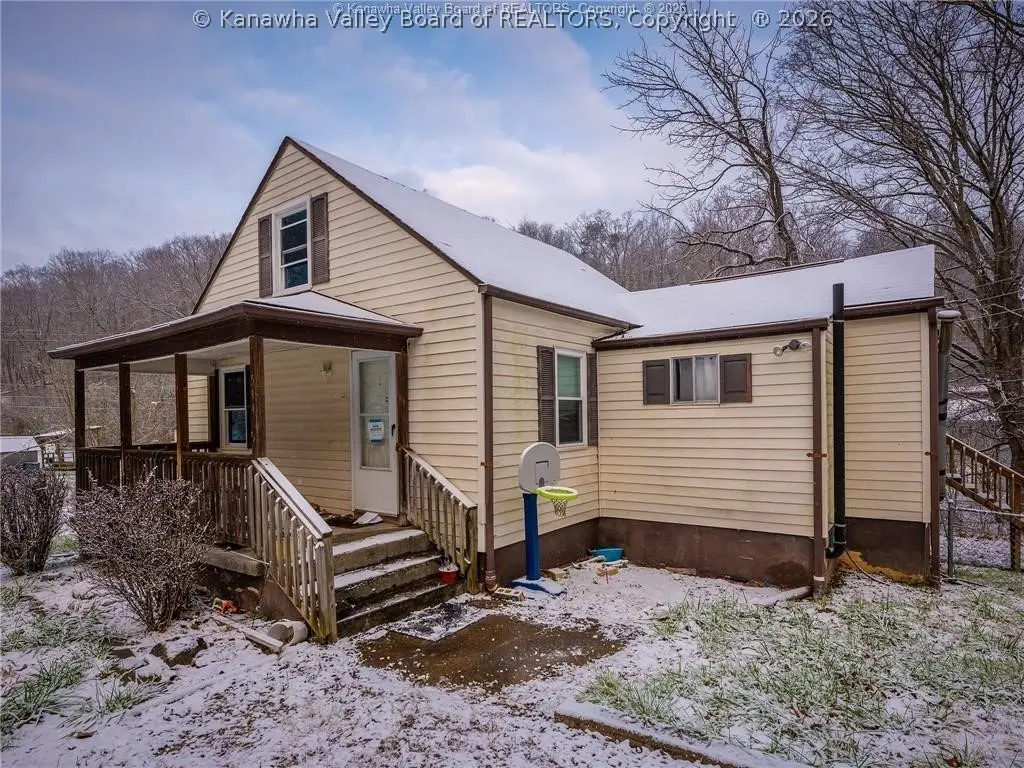
544 Cane Fork Ln · St. Albans, WV
Flood risk 8/10 · Major
- FEMA flood zone
- X (unshaded)
- Chance of flooding over 30 yrs
- 0.99%
- Est. flood insurance / yr
- $473 – $860
Fire risk 4/10 · Minor
- Est. fire insurance / yr
- $787 – $1,461
Heat risk 4/10 · Minor
- Hot days now (above 101°F)
- 7 days/yr
- Hot days in 30 yrs
- 19 days/yr
Wind risk 2/10 · Minimal
- Chance of severe wind over 30 yrs
- 1.0%
Air-quality risk 2/10 · Minimal
- Unhealthy air days now
- 0 days/yr
- Unhealthy air days in 30 yrs
- 1 days/yr
Risk factors via First Street. Map © Google.
Why this score? — see what drove the B- grade
The composite is a weighted blend of 9 inputs, each scored 0–100. Each bar is that input's sub-score; the figure is the points it added to the 100-point composite (weight × sub-score).
- Cash flow +30.0/30.0
- DSCR +10.0/10.0
- 1% rule +9.4/10.0
- ARV discount +7.5/15.0
- Schools +2.9/10.0
- Rent growth +2.5/5.0
- Livability +2.5/5.0
- Condition / age +2.5/5.0
- Appreciation +0.0/10.0
$89,700
🖨 Deal sheet (PDF) 📄 Offer letter ✓ Due diligence
Listing remarks MLS
Charming 1-1/2 Story home conventionally located in St. Albans. Home is bursting w/ natural light and is private! Home offers a large yard/fenced in backyard w/ deck which is perfect for entertaining! Do Not Miss Out on This One!
Key facts
- 0.32 acre lot
- Built 1968
- Listed 6 days
Property features AI
Finance
- Financial info
- Annual tax listed (information only)
Exterior
- Utilities
- Public waterPublic sewer
- Home design
- Single-family residential property
- Construction
- Block and vinyl siding construction
- Exterior features
- Composition/shingle roof0.32-acre lot
Interior
- Bedrooms
- Total of 6 rooms (bedrooms and living areas combined)
- Bathrooms
- 1 full bathroom1 half bathroom
- Heating & cooling
- Central air conditioningForced-air heating
- Interior features
- Full basement
Neighborhood map
What this means for you Summary
Snapshot
- This is a 3-bed/1.5-bath single-family listed at $90k.
Deal economics
- At list price, monthly cash flow is $344 ($4k/yr) — positive.
- The deal already cash-flows at list — no discount required.
- Meets the 1% rule at list price ($1k rent vs $90k).
- Cap rate 11.6% vs local median 4.8% in St. Albans — top-decile yield for the area; either an underpriced asset or a hidden risk that comps aren't pricing in. Stress-test before assuming the spread holds.
Location & tenants
- Location reads: area grade B — affects rentability + tenant quality, not the cash-flow math above.
- Kanawha County Schools (suburban): math 29% / reading 40% proficiency, ranked #17 of 55 in WV (top 31%) — families likely to look elsewhere, expect single-tenant / working-renter base with shorter leases.
- Zoned schools: George C. Weimer Elementary School (math 15% / reading 15%, grade F, #367 of 377 statewide, top 98%, 137 students, 0% FRL); Mckinley Middle School (math 24% / reading 36%, grade F, #58 of 109 statewide, top 55%, 303 students, 0% FRL); Saint Albans High School (math 32% / reading 57%, grade F, #11 of 110 statewide, top 11%, 993 students, 0% FRL) — zoned schools average 0% FRL vs 46% district-wide (46 pts lower); this property's tenant base skews higher-income than the district average.
- Market conditions: 120 active listings in the ZIP; 103 units permitted in Kanawha County in 2024 (0 in 5+ unit buildings).
Forward outlook
- Local home prices are declining (-3.0%/yr); year-one equity from $620 of loan paydown is wiped out by about $3k of value loss. Plan a longer hold.
- Kanawha County population projected at -17% by 2050 — secular population decline; favor cash flow + early exit over multi-decade hold.
- At projected returns (-3.0% appreciation + 3.0% rent growth), your $25k cash investment doubles in ~8 years — after that, you're playing with house money.
Negotiation context
- Only 6 days on market — expect competitive offers; lowballing is unlikely to land.
- 5 sale attempts since 10y ago with the ask held roughly flat each time — persistent listings suggest the price (not the market) is what's stuck; bring a comps-based counter.
Risks & watch-outs
- Watch-outs: flood insurance adds $56/mo.
- Climate carrying-cost: severe flood risk — expect insurance premiums to compound above CPI over the hold.
Questions for the listing agent
- Built in 1968 — when were the roof, HVAC, electrical panel, plumbing, and water heater last replaced?
- What's the actual annual flood-insurance premium (NFIP or private), and is the property in a SFHA with mandatory coverage?
- Is there a deadline driving the sale (1031 exchange, divorce, estate, relocation)? That informs how much negotiation room exists.
- What's the average days-on-market for RENTAL listings here right now (not sales)? A rising rental-DOM trend means longer vacancies and softer asking-rent achievability than the comps imply.
- What's the recent tenant-quality profile in this submarket — average credit score on applications, eviction rate, late-payment / NSF rate, and stable-employment percentage? A property-management company in the area should have these aggregated.
- How much new for-sale + rental construction is in the pipeline within 1–3 miles? Heavy new supply typically softens prices + rents 12–24 months out; constrained supply supports both.
Investment metrics
- 1% rule
- 1.44% ✓
- Cap rate
- 11.64%
- Cash-on-cash
- 19.09%
- DSCR
- 1.85
- GRM
- 5.8
CMA / ARV
- ARV (on-the-fly)
- $28,630
- Comps found
- 1
Show comp detail 1 sale within ~0.75 mi
| Address | Dist | Beds/Ba | Sqft | Sold | Price | $/sf | Match |
|---|---|---|---|---|---|---|---|
| 901 Green Valley Dr | 0.47mi | 2/2.0 (-1) | 1,753 (-14%) | 10mo | $25,000 | $14 | 39 |
Match score weights: distance 35% · size 25% · config 20% · recency 20%. Top-matched comps best support the ARV.
Projected returns pro-forma
-3.0% appreciation · 3.0% rent growth · sell at horizon
- IRR
- 7.6%
- Equity multiple
- 1.30×
- Total profit
- $7,431
- Equity at exit
- $13,375
- IRR
- 16.9%
- Equity multiple
- 2.39×
- Total profit
- $34,904
- Equity at exit
- $7,756
Cash invested: $25,116 (down + closing). Projections, not guarantees.
Landlord ↔ Tenant lean methodology
- Overall (STATE)
- 83 Strongly Landlord-Friendly
- State West Virginia
- 83 Strongly Landlord-Friendly · R+22
- County
- — inherits STATE
- City
- — inherits STATE
ZIP-level market 25177
- Home prices YoY
- -16.6%
- Active inventory
- 120
- Price-to-rent
- 5.8×
Monthly cashflow live
- Estimated rent
- $1,290 medium interval (Pro) →
- Mortgage (P&I)
- −$470
- Tax est. 1.5%
- −$112 /mo · $1,346/yr
- Insurance
- −$37
- Flood insurance flood zone
- −$56 /mo · $666/yr
- HOA
- −$0
- Lot rent
- −$0
- Vacancy / Maint / Mgmt
- −$271
- Net cashflow
- $344
Break-even live
Sensitivity live
| Price | -10% $406 | -5% $375 | +0% $344 | +5% $313 | +10% $282 |
|---|---|---|---|---|---|
| Rent | -10% $242 | -5% $293 | +0% $344 | +5% $395 | +10% $446 |
| Rate | -1.0pp $389 | -0.5pp $367 | base $344 | +0.5pp $321 | +1.0pp $297 |
UW: 25.0% down · 7.5% · 30yr · 1.5% tax · 5.0% vac · 8.0% maint · 8.0% mgmt
Financing live
Cash to close
- Down payment
- $22,425
- Closing costs
- $2,691
- Reserves months
- —
- Total cash needed
- —
Loan-product check · same deal, 3 products live
Conventional
25% down · 7.5% · 30yr
- Down + closing
- —
- Monthly P&I
- —
- Monthly cashflow
- —
- DSCR
- —
- Eligible?
- —
Personal DTI + credit; lowest rate.
DSCR
20% down · 8.5% · 30yr
- Down + closing
- —
- Monthly P&I
- —
- Monthly cashflow
- —
- DSCR
- —
- Eligible?
- —
No personal income docs; deal must DSCR.
Hard money
10% down · 12.0% · 12mo
- Down + closing
- —
- Monthly P&I
- —
- Monthly cashflow
- —
- DSCR
- —
- Eligible?
- —
Short-term bridge; refi at stabilization.
Listing history 16 events
-
2026-06-22days on market $89,700 Active 6 DOM
-
2026-06-21days on market $89,700 Active 5 DOM
-
2026-06-19days on market $89,700 Active 3 DOM
-
2026-06-18days on market $89,700 Active 2 DOM
-
2026-06-17days on market $89,700 Active 1 DOM
-
2026-05-31days on market $89,700 Active 165 DOM
-
2026-05-30days on market $89,700 Active 164 DOM
-
2026-04-22price $89,700
-
2026-02-05price $99,700
-
2025-12-17$109,700 Active
-
2020-06-29soldstatus $94,000 229-char remark
Show marketing remark (229 chars)
Charming 1-1/2 Story home conventionally located in St. Albans. Home is bursting w/ natural light and is private! Home offers a large yard/fenced in backyard w/ deck which is perfect for entertaining! Do Not Miss Out on This One!
-
2020-05-11$95,000 229-char remark
Show marketing remark (229 chars)
Charming 1-1/2 Story home conventionally located in St. Albans. Home is bursting w/ natural light and is private! Home offers a large yard/fenced in backyard w/ deck which is perfect for entertaining! Do Not Miss Out on This One!
-
2018-03-09soldstatus $68,000 88-char remark
-
2017-09-23$69,000 88-char remark
-
2017-05-09soldstatus $21,300
-
2016-11-19$32,900
ⓘ Source: listings_history table (triggers on properties + properties_extension) + one-shot
backfill from property_details.listing_events for pre-trigger history.
Climate risk First Street
- Flood 8/10 Severe FEMA zone X (unshaded) · 99% chance over 30 yrs
- Wildfire 4/10 Moderate
- Heat 4/10 Moderate 7 d/yr ≥101°F today · 19 d/yr by 30 yrs out
- Wind 2/10 Low 100% chance of damaging wind over 30 yrs
- Air quality 2/10 Low 0 unhealthy d/yr today · 1 by 30 yrs out
Nearby sold comps map
Loading sold comps map…
Walkable amenities ~0.75 mi
Loading nearby amenities…
Taxation est. · year 1
- Rental income
- $15,486
- − Mortgage interest
- −$5,025
- − Property taxes
- −$1,346
- − Insurance
- −$1,115
- − Repairs & maintenance
- −$1,239
- − Management
- −$1,239
- − Depreciation
- −$2,609
- Taxable income
- $2,913
- Est. tax owed @ 24.0%
- −$699
- After-tax cash flow
- $3,429/yr
For passive investors: Depreciation is non-cash, so a rental often shows a tax loss while cash-flowing — sheltering income. Rental losses are passive: they offset passive income freely, and up to $25,000/yr can offset ordinary (W-2) income if you actively participate and your MAGI is under $100k (phasing out to $0 by $150k); unused losses carry forward. On sale, claimed depreciation is recaptured at up to 25%, and gains may owe capital-gains tax (a 1031 exchange can defer both). Figures are a year-1 estimate at your 24.0% rate — not tax advice; consult a CPA.
Schools (NCES district)
- District
- Kanawha County Schools
- NCES district ID
- 5400600
- Math proficiency
- 29% ▼ -13.00%
- Reading proficiency
- 40% ▼ -7.00%
- Median HH income
- $44,329
- Composite
- 29.35/100
- National rank
- #6540
- State rank
- #17 of 55 in WV
Livability — St. Albans
No livability data for this city. (Only ~50 U.S. cities are tracked.)
Census & demographics
- City population
- 23,211
- Population (ZIP)
- 23,211
Population outlook (Kanawha County) Hauer SSP2
- Today (2025)
- 178,946 people
- By 2030
- 172,906 · -3.4%
- By 2040
- 159,874 · -10.7%
- By 2050
- 148,148 · -17.2%
- By 2075
- 123,257 · -31.1%
- By 2100
- 96,454 · -46.1%
Race, ethnicity, and origin ACS 2023
- Neighborhood character
- Predominantly White (89%)
- Race & ethnicity
- White 89% Two or more races 5% Black 5% Hispanic / Latino 1%
- Common ancestry
- Serbian 2% Italian 2% Slovak 1%
- Foreign-born
- 0%
Political lean MEDSL · Kanawha
- 2024 margin
- R (+17.4) · D 40.2% · R 57.6% · Other 2.2%
- 2008→2024 swing
- -17.0pp toward R · 2008: -0.4pp · 2024: -17.4pp
- All cycles
- 2024: R+17.4 2020: R+14.7 2016: R+20.6 2012: R+11.9 2008: R+0.4
Not yet ingested
- Civics
- —
Market trends
- HPI YoY
- ▼ -36.96%
- Current HPI
- 185.502
- Rent YoY
- —
- Metro
- —
- State GDP YoY
- —
- F500 in state
- 0
Price history
+172.6% since first listed10 events — show timeline
- 2026-06-16 Listed $89,700 KVBOR
- 2026-04-22 Price Changed $89,700 KVBOR
- 2026-02-05 Price Changed $99,700 KVBOR
- 2025-12-17 Listed $109,700 KVBOR
- 2020-06-29 Sold (MLS) $94,000 KVBOR
- 2020-05-11 Listed $95,000 KVBOR
- 2018-03-09 Sold (MLS) $68,000 KVBOR
- 2017-09-23 Listed $69,000 KVBOR
- 2017-05-09 Sold (MLS) $21,300 KVBOR
- 2016-11-19 Listed $32,900 KVBOR
Cash-flow waterfall
monthlySold comps — $/sqft
last 12 mo · ≤1 miLoading sold comps…