4760 White Heron · Melbourne, FL
Flood risk 6/10 · Moderate
- FEMA flood zone
- X (unshaded)
- Chance of flooding over 30 yrs
- 0.69%
- Est. flood insurance / yr
- $507 – $1,088
Fire risk 4/10 · Minor
- Est. fire insurance / yr
- $947 – $1,759
Heat risk 10/10 · Severe
- Hot days now (above 106°F)
- 7 days/yr
- Hot days in 30 yrs
- 24 days/yr
Wind risk 10/10 · Severe
- Chance of severe wind over 30 yrs
- 99.0%
Air-quality risk 1/10 · Minimal
- Unhealthy air days now
- 0 days/yr
- Unhealthy air days in 30 yrs
- 0 days/yr
Risk factors via First Street. Map © Google.
Why this score? — see what drove the D grade
The composite is a weighted blend of 9 inputs, each scored 0–100. Each bar is that input's sub-score; the figure is the points it added to the 100-point composite (weight × sub-score).
- Cash flow +13.8/30.0
- ARV discount +7.5/15.0
- 1% rule +4.7/10.0
- Schools +4.7/10.0
- DSCR +4.2/10.0
- Rent growth +3.4/5.0
- Livability +2.5/5.0
- Condition / age +2.5/5.0
- Appreciation +0.0/10.0
$234,900
🖨 Deal sheet (PDF) 📄 Offer letter ✓ Due diligence
Listing remarks
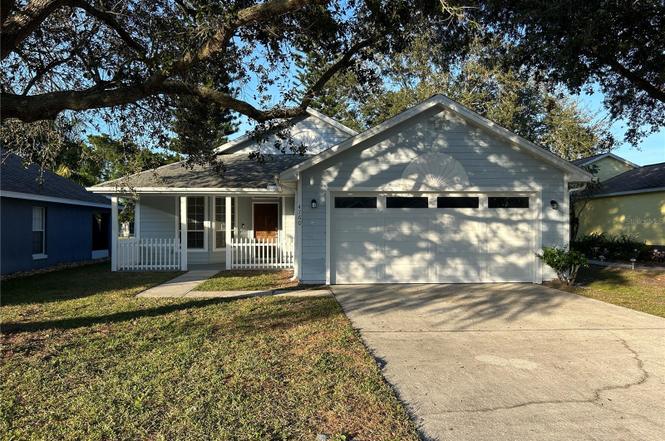
One or more photo(s) has been virtually staged. H & B 4/29/2026, 4:00 PM New Roof and repiping. Charming 1-story home featuring 3 bedrooms and 2 bathrooms, complete with a 2-car garage. Enjoy a welcoming front porch and an open layout with a kitchen bar overlooking the living room. The primary suite includes a double vanity for added convenience. Relax or entertain in the screened-in back porch, offering a comfortable outdoor space year-round. A great blend of functionality and comfort!
Key facts
- Double vanity
- Kitchen bar
- Front porch
Tags
Property features AI
Finance
- Other: Total acreage between 0 and less than 1/4 acre; Lot size approximately 0.12 acre
- Financial info: No lease restrictions indicated
- HOA & community: Cypress Bend HOA; HOA required; Monthly HOA $90 (Quarterly fee $270); Pets allowed
Exterior
- Parking: Attached garage with 2 garage spaces
- Utilities: Public water; Public sewer; Electricity available; Water available; Sewer available
- Home design: Single-family residence; One story; Faces south; Located in a PUD
- Construction: Vinyl siding; Shingle roof; Slab foundation; Built with vinyl siding
- Exterior features: Other exterior features; Paved road
Interior
- Kitchen: Dishwasher; Microwave; Range; Refrigerator
- Bedrooms: 3 bedrooms
- Flooring: Vinyl
- Bathrooms: 2 full bathrooms
- Heating & cooling: Central heating; Central air conditioning
- Interior features: Ceiling fans; Open floor plan; 6 total rooms
- Laundry & utility: Laundry inside
Neighborhood map
What this means for you Summary
Snapshot
- This is a 3-bed/2.0-bath single-family listed at $235k.
Deal economics
- At list price, monthly cash flow is $20 ($243/yr) — positive.
- The deal already cash-flows at list — no discount required.
- To meet the 1% rule (rent ≥ 1% of price), the offer needs to be $227k (3.3% below list).
- Recommended offer: $207k (12.0% below list) — sets the bar for market timing.
Location & tenants
- Location reads: area grade D — affects rentability + tenant quality, not the cash-flow math above.
- Brevard (suburban): math 53% / reading 57% proficiency, ranked #19 of 73 in FL (top 26%) — acceptable for families but not a draw, mixed tenant base, ~2y average lease.
- Zoned schools: W. Melbourne Elementary School For Science (math 88% / reading 86%, grade A+, #24 of 2,144 statewide, top 1%, 549 students, 18% FRL); Lyndon B. Johnson Middle School (math 40% / reading 42%, grade F, #353 of 571 statewide, top 63%, 610 students, 61% FRL); Eau Gallie High School (math 20% / reading 49%, grade F, #386 of 667 statewide, top 59%, 1,586 students, 55% FRL) — zoned schools at 45% FRL track the district average.
- Market conditions: Rents rising (+3.7%/yr); 104 active listings in the ZIP; 2 comparable units currently listed for rent nearby; solid renter incomes; 4,602 units permitted in Brevard County in 2024 (702 in 5+ unit buildings).
Forward outlook
- Local home prices are declining (-3.0%/yr); year-one equity from $2k of loan paydown is wiped out by about $7k of value loss. Plan a longer hold.
- Brevard County population projected at +15% by 2050 — modest demand growth; plan on rents tracking national, not racing it.
Negotiation context
- It's been on market 127 days — a 12% lower offer ($207k) is reasonable based on typical stale-listing flexibility.
- 3 sale attempts; this cycle's ask has dropped $50k (18%) from the opening price — seller is motivated, your offer sets the floor, not the list.
- Current owner paid $94k; list at $235k implies a 151% gain — meaningful room to come down on a strong offer.
Risks & watch-outs
- Climate carrying-cost: major flood risk; severe wind risk, 99% chance of damaging wind over 30y; extreme-heat days projected 7→24/yr by 2055 (HVAC capex compounding) — expect insurance premiums to compound above CPI over the hold.
Questions for the listing agent
- It's been on market 127 days. Have you received any prior offers? Is the seller open to a 12% concession, seller financing, or rate buy-down credit?
- What does the HOA fee cover, when was the last increase, and are there any pending special assessments or reserve-fund shortfalls?
- Why hasn't it sold? Are there any deal-killer items the seller is aware of (foundation, flood, title, zoning, code violations)?
- Is there a deadline driving the sale (1031 exchange, divorce, estate, relocation)? That informs how much negotiation room exists.
- The area grade is low — what's the realistic commute time and amenity access for the typical tenant pool here? Any planned neighborhood developments (good or bad) we should know about?
- What's the average days-on-market for RENTAL listings here right now (not sales)? A rising rental-DOM trend means longer vacancies and softer asking-rent achievability than the comps imply.
- What's the recent tenant-quality profile in this submarket — average credit score on applications, eviction rate, late-payment / NSF rate, and stable-employment percentage? A property-management company in the area should have these aggregated.
- How much new for-sale + rental construction is in the pipeline within 1–3 miles? Heavy new supply typically softens prices + rents 12–24 months out; constrained supply supports both.
Investment metrics
- 1% rule
- 0.97% ✗
- Cap rate
- 6.40%
- Cash-on-cash
- 0.37%
- DSCR
- 1.02
- GRM
- 8.6
CMA / ARV
No comps found within radius.
Projected returns pro-forma
-3.0% appreciation · 3.72% rent growth · sell at horizon
- IRR
- -14.8%
- Equity multiple
- 0.47×
- Total profit
- $-34,989
- Equity at exit
- $35,024
- IRR
- -4.8%
- Equity multiple
- 0.67×
- Total profit
- $-21,387
- Equity at exit
- $20,310
Cash invested: $65,772 (down + closing). Projections, not guarantees.
Landlord ↔ Tenant lean methodology
- Overall (STATE)
- 87 Strongly Landlord-Friendly
- State Florida
- 87 Strongly Landlord-Friendly · R+3
- County
- — inherits STATE
- City
- — inherits STATE
ZIP-level market 32934
- Home prices YoY
- -20.0%
- Rents YoY
- 3.7%
- Active inventory
- 104
- Price-to-rent
- 8.6×
Monthly cashflow live
- Estimated rent
- $2,272 medium interval (Pro) →
- Mortgage (P&I)
- −$1,232
- Tax from tax record
- −$355 /mo · $4,263/yr
- Insurance
- −$98
- HOA
- −$90
- Vacancy / Maint / Mgmt
- −$477
- Net cashflow
- $20
Break-even live
Sensitivity live
| Price | -10% $153 | -5% $87 | +0% $20 | +5% $-46 | +10% $-113 |
|---|---|---|---|---|---|
| Rent | -10% $-159 | -5% $-70 | +0% $20 | +5% $110 | +10% $200 |
| Rate | -1.0pp $139 | -0.5pp $80 | base $20 | +0.5pp $-41 | +1.0pp $-103 |
UW: 25.0% down · 7.5% · 30yr · 1.5% tax · 5.0% vac · 8.0% maint · 8.0% mgmt
Financing live
Cash to close
- Down payment
- $58,725
- Closing costs
- $7,047
- Reserves months
- —
- Total cash needed
- —
Loan-product check · same deal, 3 products live
Conventional
25% down · 7.5% · 30yr
- Down + closing
- —
- Monthly P&I
- —
- Monthly cashflow
- —
- DSCR
- —
- Eligible?
- —
Personal DTI + credit; lowest rate.
DSCR
20% down · 8.5% · 30yr
- Down + closing
- —
- Monthly P&I
- —
- Monthly cashflow
- —
- DSCR
- —
- Eligible?
- —
No personal income docs; deal must DSCR.
Hard money
10% down · 12.0% · 12mo
- Down + closing
- —
- Monthly P&I
- —
- Monthly cashflow
- —
- DSCR
- —
- Eligible?
- —
Short-term bridge; refi at stabilization.
Rent comps 2 comps
| Address | Beds | Baths | Sqft | Rent | $/sqft | DOM | Units | Dist |
|---|---|---|---|---|---|---|---|---|
| 1758 Caleb Ln Melbourne, FL | 3.0 | 2.0 | 1400 | $2,350 | $1.68 | 16d | 1 | 1.34mi |
| 4063 Palladian Way Melbourne, FL | 4.0 | 2.0 | 1822 | $2,300 | $1.26 | 25d | 1 | 1.42mi |
HOA detail
- Monthly dues
- $90 · $1,080/yr
Listing history 20 events
-
2026-06-09status $234,900 Pending 127 DOM
-
2026-06-08days on market $234,900 Active 127 DOM
-
2026-06-07days on market $234,900 Active 126 DOM
-
2026-06-05days on market $234,900 Active 123 DOM
-
2026-06-03days on market $234,900 Active 122 DOM
-
2026-06-02days on market $234,900 Active 121 DOM
-
2026-06-01days on market $234,900 Active 120 DOM
-
2026-05-31days on market $234,900 Active 119 DOM
-
2026-05-31days on market $234,900 Active 118 DOM
-
2026-05-07status Active
-
2026-05-02status Pending
-
2026-04-24price $234,900
-
2026-03-27price $254,500
-
2026-03-19status Active
-
2026-01-16status Pending
-
2026-01-09price $271,500
-
2025-11-26$284,900 Active
-
1999-06-17soldstatus $93,500
-
1993-03-11soldstatus $101,100
-
1992-12-01soldstatus $782,000
ⓘ Source: listings_history table (triggers on properties + properties_extension) + one-shot
backfill from property_details.listing_events for pre-trigger history.
Tax reassessment forecast FL · Resets to sale price
- Current annual tax
- $4,263 · $355/mo
- Projected year-2 tax
- $4,263 · $355/mo
- Expected delta
- $0/yr ($0/mo · 0.0%)
ⓘ Screening estimate from a state-policy table — verify with the county assessor before closing.
Climate risk First Street
- Flood 6/10 Major FEMA zone X (unshaded) · 69% chance over 30 yrs
- Wildfire 4/10 Moderate
- Heat 10/10 Extreme 7 d/yr ≥106°F today · 24 d/yr by 30 yrs out
- Wind 10/10 Extreme 99% chance of damaging wind over 30 yrs
- Air quality 1/10 Low 0 unhealthy d/yr today · 0 by 30 yrs out
Nearby sold comps map
Loading sold comps map…
Walkable amenities ~0.75 mi
Loading nearby amenities…
Taxation est. · year 1
- Rental income
- $27,269
- − Mortgage interest
- −$13,158
- − Property taxes
- −$4,263
- − Insurance
- −$1,174
- − Repairs & maintenance
- −$2,182
- − Management
- −$2,182
- − HOA
- −$1,080
- − Depreciation
- −$6,833
- Taxable loss
- −$3,603
- Est. tax savings @ 24.0%
- +$865
- After-tax cash flow
- $1,108/yr
For passive investors: Depreciation is non-cash, so a rental often shows a tax loss while cash-flowing — sheltering income. Rental losses are passive: they offset passive income freely, and up to $25,000/yr can offset ordinary (W-2) income if you actively participate and your MAGI is under $100k (phasing out to $0 by $150k); unused losses carry forward. On sale, claimed depreciation is recaptured at up to 25%, and gains may owe capital-gains tax (a 1031 exchange can defer both). Figures are a year-1 estimate at your 24.0% rate — not tax advice; consult a CPA.
Schools (NCES district)
- District
- Brevard
- NCES district ID
- 1200150
- Math proficiency
- 53% ▼ -9.00%
- Reading proficiency
- 57% ▼ -4.00%
- Median HH income
- $49,426
- Composite
- 46.86/100
- National rank
- #2370
- State rank
- #19 of 73 in FL
Livability — Melbourne
No livability data for this city. (Only ~50 U.S. cities are tracked.)
Census & demographics
- Census place
- Melbourne, FL
- County
- Brevard County · 602,871 people
- City population
- 178,420
- Metro
- Palm Bay-Melbourne-Titusville, FL
- Population (ZIP)
- 18,564
- Household income
- $104,369
- Rent vs Own
- Severe rent burden
- 233.0
Population outlook (Brevard County) Hauer SSP2
- Today (2025)
- 623,254 people
- By 2030
- 648,420 · +4.0%
- By 2040
- 690,009 · +10.7%
- By 2050
- 715,669 · +14.8%
- By 2075
- 775,744 · +24.5%
- By 2100
- 776,687 · +24.6%
Race, ethnicity, and origin ACS 2023
- Neighborhood character
- Predominantly White (82%)
- Race & ethnicity
- White 82% Hispanic / Latino 8% Two or more races 7% Black 2% Asian 2%
- Hispanic origin (detail)
- Puerto Rican 3% Cuban 1%
- Common ancestry
- Lithuanian 4% Italian 3% Romanian 3%
- Foreign-born
- 8% · Canada, China
- Languages at home
- 91% English-only · Spanish 6% Other Indo-European 1% German/W. Germanic 1%
Political lean MEDSL · Brevard
- 2024 margin
- Strong R (+20.8) · D 39.1% · R 59.9% · Other 1.0%
- 2008→2024 swing
- -10.4pp toward R · 2008: -10.4pp · 2024: -20.8pp
- All cycles
- 2024: R+20.8 2020: R+16.4 2016: R+19.8 2012: R+12.7 2008: R+10.4
Not yet ingested
- Civics
- —
Market trends
- HPI YoY
- ▼ -78.68%
- Current HPI
- 315.3069
- Rent YoY
- ▲ 3.72%
- Metro
- Palm Bay-Melbourne-Titusville, FL
- State GDP YoY
- ▲ 3.28%
- F500 in state
- 36
Industry mix (Fortune 500 HQ in FL)
| Industry | F500 HQs | Revenue |
|---|---|---|
| Industrial Technology | 2 | $29B |
|
||
| Insurance | 2 | $17B |
|
||
| Retail | 1 | $60B |
|
||
| Technology Distribution | 1 | $58B |
|
||
| Homebuilding | 1 | $35B |
|
||
| Technology Manufacturing | 1 | $35B |
|
||
Price history
-70.0% since first listed11 events — show timeline
- 2026-05-07 Relisted — Stellar MLS as Distributed by MLS Grid
- 2026-05-02 Pending — Stellar MLS as Distributed by MLS Grid
- 2026-04-24 Price Changed $234,900 Stellar MLS as Distributed by MLS Grid
- 2026-03-27 Price Changed $254,500 Stellar MLS as Distributed by MLS Grid
- 2026-03-19 Relisted — Stellar MLS as Distributed by MLS Grid
- 2026-01-16 Pending — Stellar MLS as Distributed by MLS Grid
- 2026-01-09 Price Changed $271,500 Stellar MLS as Distributed by MLS Grid
- 2025-11-26 Listed $284,900 Stellar MLS as Distributed by MLS Grid
- 1999-06-17 Sold (Public Records) $93,500 Public Records
- 1993-03-11 Sold (Public Records) $101,100 Public Records
- 1992-12-01 Sold (Public Records) $782,000 Public Records
Property tax history
+6.7%/yrLatest (2025): $4,263 · +5.0% YoY. Source: county tax records.
Cash-flow waterfall
monthlySold comps — $/sqft
last 12 mo · ≤1 miLoading sold comps…