 Triplex
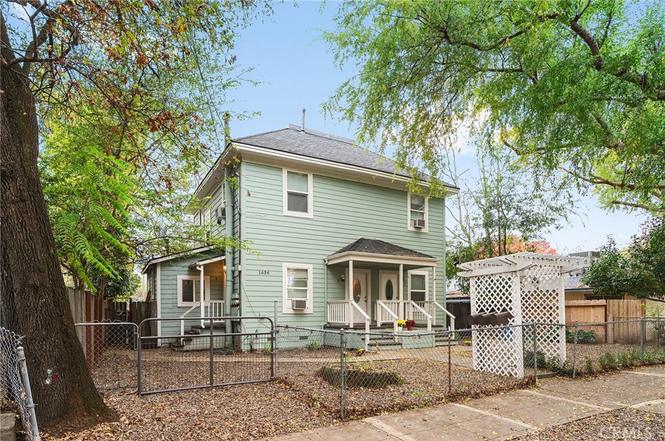
1636 Pine · Oroville, CA
Flood risk 1/10 · Minimal
- FEMA flood zone
- X (unshaded)
- Chance of flooding over 30 yrs
- 0.0%
- Est. flood insurance / yr
- $507 – $1,088
Fire risk 9/10 · Severe
- Est. fire insurance / yr
- $659 – $1,223
Heat risk 8/10 · Major
- Hot days now (above 105°F)
- 7 days/yr
- Hot days in 30 yrs
- 16 days/yr
Wind risk 1/10 · Minimal
- Chance of severe wind over 30 yrs
- —
Air-quality risk 10/10 · Severe
- Unhealthy air days now
- 34 days/yr
- Unhealthy air days in 30 yrs
- 39 days/yr
Risk factors via First Street. Map © Google.
Why this score? — see what drove the D+ grade
The composite is a weighted blend of 9 inputs, each scored 0–100. Each bar is that input's sub-score; the figure is the points it added to the 100-point composite (weight × sub-score).
- Cash flow +24.3/30.0
- DSCR +7.8/10.0
- 1% rule +5.3/10.0
- Rent growth +3.0/5.0
- Schools +2.8/10.0
- Livability +2.5/5.0
- Condition / age +2.5/5.0
- ARV discount +0.0/15.0
- Appreciation +0.0/10.0
$375,000
🖨 Deal sheet 📄 Offer letter ✓ Due diligence
Multi-family units
County records classify this as Multi-Family (2-4 Unit). Listing-text estimate: 3 units. confirmed
Listing remarks MLS
Great income property, 1 1/1 downstairs, 1 2/1 downstairs , upstairs larger 2/1 all need carpet paint and repairs.
Key facts
- Fresh paint
- Wood floors
- Private backyard
Tags
Property features AI
Finance
- Other: Number of buildings: 1; Total building area: 2,370; Common walls: 2+; Tenants pay gas and electricity
- Financial info: Three total units (all leased); Gross scheduled income: $31,828; Gross income: $31,828; Net operating income: $23,679; Total actual rent collected: $3,045; Unit rents: $875 (1-bed), $1,075 (2-bed), $1,095 (2-bed); Operating expenses: $8,149 (includes trash, pest control, maintenance, water/sewer, taxes); Trash expense: $705; Pest control expense: $418; Maintenance expense: $2,210; Water/sewer expense: $778; New taxes expense: $1,014
- HOA & community: Community sidewalks; Suburban neighborhood
Exterior
- Parking: Street parking
- Utilities: Public sewer; District/Public water; Natural gas connected; Sewer connected; Electricity connected; Water connected; Three separate electric meters; Three separate gas meters; One separate water meter
- Home design: Attached property; Two-story building; Has a view
- Construction: Composition roof; Built year source: Assessor
- Exterior features: Back yard; Yard; No pool
Interior
- Kitchen: Refrigerator; Gas range; Gas oven
- Bedrooms: One 1-bedroom unit; Two 2-bedroom units
- Flooring: Carpet; Wood; Laminate
- Bathrooms: All units have one full bathroom
- Heating & cooling: Wall heater; Wall/window cooling units
- Interior features: Ceiling fan; Formica counters; Kitchen; Living room; Entry on main level
- Laundry & utility: In-unit laundry located inside a closet
Neighborhood map
What this means for you Summary
Snapshot
- This is a 1×1bd/1.0ba + 2×2bd/1.0ba units multifamily listed at $375k.
Deal economics
- At list price, monthly cash flow is $753 ($9k/yr) — positive. Per door: $251/mo.
- The deal already cash-flows at list — no discount required.
- Meets the 1% rule at list price ($4k rent vs $375k).
- Recommended offer: $330k (12.0% below list) — sets the bar for market timing.
- Cap rate 8.7% vs local median 4.6% in Oroville — top-decile yield for the area; either an underpriced asset or a hidden risk that comps aren't pricing in. Stress-test before assuming the spread holds.
Location & tenants
- Location reads 50/100 on livability (#1,136 in CA) — a working-class tenant base; expect higher turnover. Watch: schools D, cost of living D, crime F.
- Oroville Union High (town): math 19% / reading 49% proficiency, ranked #300 of 517 in CA (top 58%) — families likely to look elsewhere, expect single-tenant / working-renter base with shorter leases.
- Market conditions: Rents rising (+1.9%/yr); 167 active listings in the ZIP; 2 comparable units currently listed for rent nearby; 946 units permitted in Butte County in 2024 (254 in 5+ unit buildings).
- At $3,862/mo this rent would consume 87% of the median local household income ($53k/yr) (locally 892% of renters already pay >50% of income on rent) — very limited rent-growth headroom before tenants either downsize or default.
Forward outlook
- Local home prices are declining (-3.0%/yr); year-one equity from $3k of loan paydown is wiped out by about $11k of value loss. Plan a longer hold.
- Butte County population projected at +10% by 2050 — modest demand growth; plan on rents tracking national, not racing it.
Negotiation context
- It's been on market 164 days — a 12% lower offer ($330k) is reasonable based on typical stale-listing flexibility.
- 6 sale attempts since 14y ago; this cycle's ask is 39374% above the opening price — seller raised mid-cycle; expect resistance to lowballs.
- Current owner paid $70k; list at $375k implies a 436% gain — meaningful room to come down on a strong offer.
Risks & watch-outs
- Watch-outs: built in 1900 — expect roof / HVAC / electrical / plumbing capex.
- Climate carrying-cost: severe wildfire risk; extreme-heat days projected 7→16/yr by 2055 (HVAC capex compounding) — expect insurance premiums to compound above CPI over the hold.
Questions for the listing agent
- It's been on market 164 days. Have you received any prior offers? Is the seller open to a 12% concession, seller financing, or rate buy-down credit?
- Can we see the unit-by-unit rent roll, current vacancy, and any below-market leases? What's the average tenancy length?
- What capital expenditures (roof, boiler, parking lot, exteriors) have been made in the last 5 years, and what's planned in the next 2?
- Built in 1900 — when were the roof, HVAC, electrical panel, plumbing, and water heater last replaced?
- Why hasn't it sold? Are there any deal-killer items the seller is aware of (foundation, flood, title, zoning, code violations)?
- Is there a deadline driving the sale (1031 exchange, divorce, estate, relocation)? That informs how much negotiation room exists.
- Schools are D-rated, which usually means shorter tenancies and higher turnover. Who's the typical renter profile here, and what's been the actual vacancy rate?
- Crime grade is F in this area — have there been break-ins, vandalism, or insurance claims at this property in the last 3 years? What carrier currently insures it and at what premium?
- The area grade is low — what's the realistic commute time and amenity access for the typical tenant pool here? Any planned neighborhood developments (good or bad) we should know about?
- What's the average days-on-market for RENTAL listings here right now (not sales)? A rising rental-DOM trend means longer vacancies and softer asking-rent achievability than the comps imply.
- What's the recent tenant-quality profile in this submarket — average credit score on applications, eviction rate, late-payment / NSF rate, and stable-employment percentage? A property-management company in the area should have these aggregated.
- How much new apartment / multifamily construction is in the pipeline within 1–3 miles? Heavy new supply (>2% of stock underway) typically softens rents 12–24 months out; light construction supports rent growth.
Investment metrics
- 1% rule
- 1.03% ✓
- Cap rate
- 8.70%
- Cash-on-cash
- 8.61%
- DSCR
- 1.38
- GRM
- 8.1
CMA / ARV
- ARV (on-the-fly)
- $284,400
- Comps found
- 4
Show comp detail 4 sales within ~0.75 mi
| Address | Dist | Beds/Ba | Sqft | Sold | Price | $/sf | Match |
|---|---|---|---|---|---|---|---|
| 1081 Robinson St | 0.28mi | 5/3.0 | 2,400 (+1%) | 18mo | $401,000 | $167 | 70 |
| 821 Robinson St | 0.45mi | 5/3.0 | 2,450 (+3%) | 6mo | $260,000 | $106 | 69 |
| 680 Robinson St | 0.54mi | 6/5.0 (+1) | 2,392 (+1%) | 5mo | $286,500 | $120 | 56 |
| 1150 2nd Ave | 0.38mi | 4/2.0 (-1) | 2,095 (-12%) | 11mo | $155,000 | $74 | 45 |
Match score weights: distance 35% · size 25% · config 20% · recency 20%. Top-matched comps best support the ARV.
Projected returns pro-forma
-3.0% appreciation · 1.88% rent growth · sell at horizon
- IRR
- -4.4%
- Equity multiple
- 0.84×
- Total profit
- $-17,237
- Equity at exit
- $55,914
- IRR
- 4.0%
- Equity multiple
- 1.28×
- Total profit
- $28,977
- Equity at exit
- $32,423
Cash invested: $105,000 (down + closing). Projections, not guarantees.
Landlord ↔ Tenant lean methodology
- Overall (STATE)
- 18 Strongly Tenant-Friendly
- State California
- 18 Strongly Tenant-Friendly · D+13
- County
- — inherits STATE
- City
- — inherits STATE
ZIP-level market 95965
- Home prices YoY
- -31.6%
- Rents YoY
- 1.9%
- Active inventory
- 167
- Price-to-rent
- 25.4×
Monthly cashflow live
- Estimated rent
- $3,862 high interval (Pro) →
- Mortgage (P&I)
- −$1,967
- Tax from tax record
- −$175 /mo · $2,103/yr
- Insurance
- −$156
- HOA
- −$0
- Vacancy / Maint / Mgmt
- −$811
- Net cashflow
- $753
Break-even live
3-unit breakdown (identical units grouped — click to expand)
| Units | Beds | Baths | Est. rent |
|---|---|---|---|
| 1× unit | 1 | 1 | $1,228 |
| 2× units | 2 | 1 | $2,634 |
| #2 | 2 | 1 | $1,317 |
| #3 | 2 | 1 | $1,317 |
| Total (3 units) | $3,862 | ||
UW: 25.0% down · 7.5% · 30yr · 1.5% tax · 5.0% vac · 8.0% maint · 8.0% mgmt
Financing live
Cash to close
- Down payment
- $93,750
- Closing costs
- $11,250
- Reserves months
- —
- Total cash needed
- —
Loan-product check · same deal, 3 products live
Conventional
25% down · 7.5% · 30yr
- Down + closing
- —
- Monthly P&I
- —
- Monthly cashflow
- —
- DSCR
- —
- Eligible?
- —
Personal DTI + credit; lowest rate.
DSCR
20% down · 8.5% · 30yr
- Down + closing
- —
- Monthly P&I
- —
- Monthly cashflow
- —
- DSCR
- —
- Eligible?
- —
No personal income docs; deal must DSCR.
Hard money
10% down · 12.0% · 12mo
- Down + closing
- —
- Monthly P&I
- —
- Monthly cashflow
- —
- DSCR
- —
- Eligible?
- —
Short-term bridge; refi at stabilization.
Rent comps 2 comps
| Address | Beds | Baths | Sqft | Rent | $/sqft | DOM | Units | Dist |
|---|---|---|---|---|---|---|---|---|
| 1120 Safford St Oroville, CA | 4.0 | 2.5 | 2260 | $2,450 | $1.08 | 21d | 1 | 0.35mi |
| 2590 Oro Ave Oroville, CA | 5.0 | 2.0 | 1828 | $2,000 | $1.09 | 21d | 1 | 0.60mi |
Listing history 27 events
-
2026-06-19days on market $375,000 Active 164 DOM
-
2026-06-18days on market $375,000 Active 163 DOM
-
2026-06-17days on market $375,000 Active 162 DOM
-
2026-06-16days on market $375,000 Active 161 DOM
-
2026-06-15days on market $375,000 Active 160 DOM
-
2026-06-14days on market $375,000 Active 158 DOM
-
2026-06-13days on market $375,000 Active 157 DOM
-
2026-06-10days on market $375,000 Active 155 DOM
-
2026-06-09days on market $375,000 Active 154 DOM
-
2026-06-08days on market $375,000 Active 153 DOM
-
2026-06-07days on market $375,000 Active 152 DOM
-
2026-06-02days on market $375,000 Active 147 DOM
-
2026-06-01days on market $375,000 Active 146 DOM
-
2026-05-31days on market $375,000 Active 145 DOM
-
2026-05-30days on market $375,000 Active 144 DOM
-
2026-04-23$950
-
2026-04-21status Active
-
2026-03-24status Pending Sale
-
2025-12-09$375,000 Active
-
2025-11-18historical $1,095
-
2025-11-17$1,095
-
2024-11-12historical $1,075
-
2024-11-09$1,075
-
2012-10-03soldstatus $70,000 115-char remark
Show marketing remark (115 chars)
Great income property, 1 1/1 downstairs, 1 2/1 downstairs , upstairs larger 2/1 all need carpet paint and repairs.
-
2012-10-03soldstatus $70,000
Show marketing remark (115 chars)
Great income property, 1 1/1 downstairs, 1 2/1 downstairs , upstairs larger 2/1 all need carpet paint and repairs.
-
2012-09-21historical 115-char remark
Show marketing remark (115 chars)
Great income property, 1 1/1 downstairs, 1 2/1 downstairs , upstairs larger 2/1 all need carpet paint and repairs.
-
2012-06-16$75,000 115-char remark
Show marketing remark (115 chars)
Great income property, 1 1/1 downstairs, 1 2/1 downstairs , upstairs larger 2/1 all need carpet paint and repairs.
ⓘ Source: listings_history table (triggers on properties + properties_extension) + one-shot
backfill from property_details.listing_events for pre-trigger history.
Tax reassessment forecast CA · Resets to sale price
- Current annual tax
- $2,103 · $175/mo
- Projected year-2 tax
- $2,850 · $238/mo
- Expected delta
- +$747/yr (+$62/mo · 35.5%)
ⓘ Screening estimate from a state-policy table — verify with the county assessor before closing.
Climate risk First Street
- Flood 1/10 Low FEMA zone X (unshaded) · 0% chance over 30 yrs
- Wildfire 9/10 Extreme
- Heat 8/10 Severe 7 d/yr ≥105°F today · 16 d/yr by 30 yrs out
- Wind 1/10 Low
- Air quality 10/10 Extreme 34 unhealthy d/yr today · 39 by 30 yrs out
Nearby sold comps map
Loading sold comps map…
Walkable amenities ~0.75 mi
Loading nearby amenities…
Taxation est. · year 1
- Rental income
- $46,344
- − Mortgage interest
- −$21,006
- − Property taxes
- −$2,103
- − Insurance
- −$1,875
- − Repairs & maintenance
- −$3,708
- − Management
- −$3,708
- − Depreciation
- −$10,909
- Taxable income
- $3,036
- Est. tax owed @ 24.0%
- −$729
- After-tax cash flow
- $8,307/yr
For passive investors: Depreciation is non-cash, so a rental often shows a tax loss while cash-flowing — sheltering income. Rental losses are passive: they offset passive income freely, and up to $25,000/yr can offset ordinary (W-2) income if you actively participate and your MAGI is under $100k (phasing out to $0 by $150k); unused losses carry forward. On sale, claimed depreciation is recaptured at up to 25%, and gains may owe capital-gains tax (a 1031 exchange can defer both). Figures are a year-1 estimate at your 24.0% rate — not tax advice; consult a CPA.
Schools (NCES district)
- District
- Oroville Union High
- NCES district ID
- 0629130
- Math proficiency
- 19% ▼ -2.00%
- Reading proficiency
- 49% ▼ -4.00%
- Median HH income
- $38,085
- Composite
- 28.26/100
- National rank
- #6794
- State rank
- #300 of 517 in CA
Livability — Oroville
- Score
- 50/100
- State rank
- #1136
- US rank
- #25715
Category grades
Schools grade is shown separately in the Schools card above.
Census & demographics
- Census place
- Oroville, CA
- County
- Butte County · 175,030 people
- City population
- 49,684
- Metro
- Chico, CA
- Population (ZIP)
- 21,181
- Household income
- $53,198
- Rent vs Own
- Severe rent burden
- 892.0
Population outlook (Butte County) Hauer SSP2
- Today (2025)
- 237,527 people
- By 2030
- 243,804 · +2.6%
- By 2040
- 253,899 · +6.9%
- By 2050
- 262,561 · +10.5%
- By 2075
- 283,709 · +19.4%
- By 2100
- 282,689 · +19.0%
Race, ethnicity, and origin ACS 2023
- Neighborhood character
- Diverse neighborhood (Simpson 0.68)
- Race & ethnicity
- White 50% Hispanic / Latino 20% Asian 16% Two or more races 13% Black 3% Native American 3%
- Hispanic origin (detail)
- Mexican 19%
- Common ancestry
- Lithuanian 2% Iranian 2% Russian 1%
- Foreign-born
- 12% · Canada
- Languages at home
- 75% English-only · Spanish 13% Other Asian/Pacific 10% Tagalog/Filipino 1%
Political lean MEDSL · Butte
- 2024 margin
- Toss-up / Even · D 46.8% · R 49.9% · Other 3.3%
- 2008→2024 swing
- -5.5pp toward R · 2008: 2.4pp · 2024: -3.1pp
- All cycles
- 2024: R+3.1 2020: D+1.7 2016: R+4.0 2012: R+3.9 2008: D+2.4
Not yet ingested
- Civics
- —
Market trends
- HPI YoY
- ▼ -146.76%
- Current HPI
- 317.0277
- Rent YoY
- ▲ 1.88%
- Metro
- Chico, CA
- State GDP YoY
- ▲ 3.21%
- F500 in state
- 116
Industry mix (Fortune 500 HQ in CA)
| Industry | F500 HQs | Revenue |
|---|---|---|
| Technology | 27 | $1,492B |
|
||
| Financial Services | 3 | $174B |
|
||
| Retail | 3 | $44B |
|
||
| Insurance | 3 | $26B |
|
||
| Media / Entertainment | 2 | $115B |
|
||
| Pharmaceuticals / Biotech | 2 | $62B |
|
||
Price history
+400.0% since first listed12 events — show timeline
- 2026-04-23 Listed for Rent $950 RENTALBEAST
- 2026-04-21 Relisted — CRMLS
- 2026-03-24 Pending — CRMLS
- 2025-12-09 Listed $375,000 CRMLS
- 2025-11-18 Rental Removed $1,095 RENTALBEAST
- 2025-11-17 Listed for Rent $1,095 RENTALBEAST
- 2024-11-12 Rental Removed $1,075 RENTALBEAST
- 2024-11-09 Listed for Rent $1,075 RENTALBEAST
- 2012-10-03 Sold (Public Records) $70,000 Public Records
- 2012-10-03 Sold (MLS) $70,000 CRMLS
- 2012-09-21 Listing Removed — CRMLS
- 2012-06-16 Listed $75,000 CRMLS
Property tax history
+0.8%/yrLatest (2025): $2,103 · +3.7% YoY. Source: county tax records.
Cash-flow waterfall
monthlySold comps — $/sqft
last 12 mo · ≤1 miLoading sold comps…