 🏢 Co-op
63 Poplar Pl · Iona, FL
Flood risk 9/10 · Severe
- FEMA flood zone
- AE
- Chance of flooding over 30 yrs
- 0.99%
- Est. flood insurance / yr
- $1,737 – $8,500
Fire risk 3/10 · Minor
- Est. fire insurance / yr
- $947 – $1,759
Heat risk 10/10 · Severe
- Hot days now (above 107°F)
- 7 days/yr
- Hot days in 30 yrs
- 28 days/yr
Wind risk 10/10 · Severe
- Chance of severe wind over 30 yrs
- 99.0%
Air-quality risk 2/10 · Minimal
- Unhealthy air days now
- 1 days/yr
- Unhealthy air days in 30 yrs
- 1 days/yr
Risk factors via First Street. Map © Google.
Why this score? — see what drove the C- grade
The composite is a weighted blend of 9 inputs, each scored 0–100. Each bar is that input's sub-score; the figure is the points it added to the 100-point composite (weight × sub-score).
- Cash flow +20.4/30.0
- ARV discount +7.5/15.0
- DSCR +6.5/10.0
- 1% rule +4.6/10.0
- Schools +4.1/10.0
- Livability +3.6/5.0
- Condition / age +2.5/5.0
- Rent growth +2.2/5.0
- Appreciation +0.0/10.0
$244,900
🖨 Deal sheet 📄 Offer letter ✓ Due diligence
Listing remarks
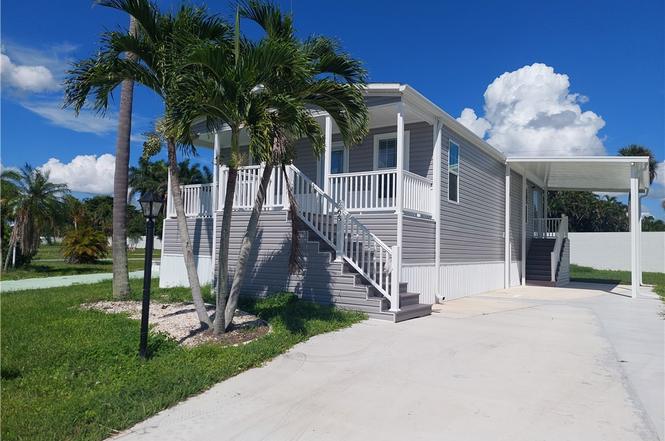
Newly constructed home in Plantation Estates just minutes from the Sanibel Island causeway and Fort Myers Beach! This three bedroom, two bathroom home is ready for it's first owner with new stainless steel kitchen appliances, washer and dryer with separate utility room. The home has crown molding, a farmhouse style, wood chair rail and barn door entry pantry. Open air porch big enough for entertaining friends and enjoying the cooler evenings in the Florida winter time. Plantation Estates is a Co-Op community for 55 and older with park-like setting with amenities including new Clubhouse and Pool renovations to be completed in early 2026, picnic area and 4 Shuffleboard courts. The low monthly
Key facts
- Open air porch
- Crown molding
- New clubhouse
Tags
Property features AI
Finance
- Other: Pets allowed conditionally (call); maximum 1 pet; non-aggressive breeds only
- HOA & community: Homeowners association (monthly fee); HOA fee $99 monthly; HOA covers insurance, laundry facilities, grounds maintenance, recreation facilities, reserve fund, road maintenance, sewer, street lights, trash, and water; Community amenities: clubhouse, laundry, barbecue, picnic area, pool, RV/boat storage, shuffleboard court; Non-gated community with street lights; Senior community; 151 units in community
Exterior
- Parking: Covered parking; Detached carport (1 space); Driveway; Paved parking; Golf cart garage
- Security: Smoke detector(s)
- Utilities: Public water; Public sewer; Cable available; High speed internet available; Underground utilities
- Home design: Manufactured home; 1 story; Entry level 1; Faces west; New construction
- Construction: Shingle roof; Vinyl siding; Concrete construction; Raised foundation; Manufactured construction; New construction
- Exterior features: Deck; Open porch; Porch; Community pool; Municipal irrigation; Paved road; Rectangular lot; East exposure
Interior
- Kitchen: Dishwasher; Range; Self-cleaning oven; Microwave; Refrigerator; Freezer; Breakfast bar; Kitchen island; Eat-in kitchen
- Flooring: Vinyl
- Bathrooms: 2 full bathrooms
- Heating & cooling: Central heating (electric); Central air conditioning (electric); Ceiling fans
- Interior features: Breakfast bar; Eat-in kitchen; Kitchen island; Separate shower; Shower only; Cable TV; High speed internet; Split bedrooms; Single-hung windows; Unfurnished
- Laundry & utility: Washer and dryer included; Laundry in common area
Neighborhood map
What this means for you Summary
Snapshot
- This is a 3-bed/2.0-bath land listed at $245k.
Deal economics
- At list price, monthly cash flow is $-107 ($-1k/yr) — negative.
- To cash-flow at today's rent, offer at most $226k (7.7% below list).
- To meet the 1% rule (rent ≥ 1% of price), the offer needs to be $235k (4.2% below list).
- Recommended offer: $216k (12.0% below list) — sets the bar for market timing.
- Cap rate 7.9% vs local median 2.1% in Iona — top-decile yield for the area; either an underpriced asset or a hidden risk that comps aren't pricing in. Stress-test before assuming the spread holds.
Location & tenants
- Location reads 72/100 on livability (#359 in FL) — a middle-class / working-renter tenant base. Strengths: crime A+, housing A, health & safety A; Watch: schools D-, amenities F, commute F.
- Lee (suburban): math 47% / reading 50% proficiency, ranked #42 of 73 in FL (top 58%) — families likely to look elsewhere, expect single-tenant / working-renter base with shorter leases.
- Market conditions: Rents soft (-1.2%/yr); 1244 active listings in the ZIP; 40 comparable units currently listed for rent nearby; rentals at typical pace (median 24d on market — plan ~3-4 weeks tenant-placement turnaround); solid renter incomes; 15,411 units permitted in Lee County in 2024 (4,686 in 5+ unit buildings).
- This rent runs 37% of the median local income ($75k/yr) — at the standard rent-burdened threshold; future hikes will face affordability resistance.
Forward outlook
- Local home prices are declining (-3.0%/yr); year-one equity from $2k of loan paydown is wiped out by about $7k of value loss. Plan a longer hold.
- Lee County population projected at +44% by 2050 — long-run rental-demand tailwind backs the buy-and-hold thesis.
Negotiation context
- It's been on market 264 days — a 12% lower offer ($216k) is reasonable based on typical stale-listing flexibility.
- 4 sale attempts since 3y ago; this cycle's ask has dropped $35k (13%) from the opening price — seller is motivated, your offer sets the floor, not the list.
- Current owner paid $55k; list at $245k implies a 345% gain — meaningful room to come down on a strong offer.
Risks & watch-outs
- Watch-outs: flood insurance adds $427/mo.
- Climate carrying-cost: in FEMA flood zone AE (mandatory federal flood insurance); severe wind risk, 99% chance of damaging wind over 30y; extreme-heat days projected 7→28/yr by 2055 (HVAC capex compounding) — expect insurance premiums to compound above CPI over the hold.
Questions for the listing agent
- What do current leases actually rent for vs. the listed asking? Can we see a recent rent roll and the last 12 months of T-12 income?
- It's been on market 264 days. Have you received any prior offers? Is the seller open to a 12% concession, seller financing, or rate buy-down credit?
- What's the actual annual flood-insurance premium (NFIP or private), and is the property in a SFHA with mandatory coverage?
- What does the HOA fee cover, when was the last increase, and are there any pending special assessments or reserve-fund shortfalls?
- Why hasn't it sold? Are there any deal-killer items the seller is aware of (foundation, flood, title, zoning, code violations)?
- Is there a deadline driving the sale (1031 exchange, divorce, estate, relocation)? That informs how much negotiation room exists.
- Schools are D-rated, which usually means shorter tenancies and higher turnover. Who's the typical renter profile here, and what's been the actual vacancy rate?
- What's the average days-on-market for RENTAL listings here right now (not sales)? A rising rental-DOM trend means longer vacancies and softer asking-rent achievability than the comps imply.
- What's the recent tenant-quality profile in this submarket — average credit score on applications, eviction rate, late-payment / NSF rate, and stable-employment percentage? A property-management company in the area should have these aggregated.
- How much new for-sale + rental construction is in the pipeline within 1–3 miles? Heavy new supply typically softens prices + rents 12–24 months out; constrained supply supports both.
Investment metrics
- 1% rule
- 0.96% ✗
- Cap rate
- 7.86%
- Cash-on-cash
- 5.59%
- DSCR
- 1.25
- GRM
- 8.7
CMA / ARV
No comps found within radius.
Projected returns pro-forma
-3.0% appreciation · 0.0% rent growth · sell at horizon
- IRR
- -23.3%
- Equity multiple
- 0.22×
- Total profit
- $-53,177
- Equity at exit
- $36,515
- IRR
- -31.6%
- Equity multiple
- -0.18×
- Total profit
- $-80,840
- Equity at exit
- $21,174
Cash invested: $68,572 (down + closing). Projections, not guarantees.
Landlord ↔ Tenant lean methodology
- Overall (STATE)
- 87 Strongly Landlord-Friendly
- State Florida
- 87 Strongly Landlord-Friendly · R+3
- County
- — inherits STATE
- City
- — inherits STATE
ZIP-level market 33908
- Home prices YoY
- -32.8%
- Rents YoY
- -1.2%
- Active inventory
- 1244
- Price-to-rent
- 8.7×
Monthly cashflow live
- Estimated rent
- $2,346 high interval (Pro) →
- Mortgage (P&I)
- −$1,284
- Tax from tax record
- −$48 /mo · $582/yr
- Insurance
- −$102
- Flood insurance flood zone
- −$427 /mo · $5,118/yr
- HOA
- −$99
- Vacancy / Maint / Mgmt
- −$493
- Net cashflow
- $-107
Break-even live
UW: 25.0% down · 7.5% · 30yr · 1.5% tax · 5.0% vac · 8.0% maint · 8.0% mgmt
Financing live
Cash to close
- Down payment
- $61,225
- Closing costs
- $7,347
- Reserves months
- —
- Total cash needed
- —
Loan-product check · same deal, 3 products live
Conventional
25% down · 7.5% · 30yr
- Down + closing
- —
- Monthly P&I
- —
- Monthly cashflow
- —
- DSCR
- —
- Eligible?
- —
Personal DTI + credit; lowest rate.
DSCR
20% down · 8.5% · 30yr
- Down + closing
- —
- Monthly P&I
- —
- Monthly cashflow
- —
- DSCR
- —
- Eligible?
- —
No personal income docs; deal must DSCR.
Hard money
10% down · 12.0% · 12mo
- Down + closing
- —
- Monthly P&I
- —
- Monthly cashflow
- —
- DSCR
- —
- Eligible?
- —
Short-term bridge; refi at stabilization.
Rent comps 40 comps
| Address | Beds | Baths | Sqft | Rent | $/sqft | DOM | Units | Dist |
|---|---|---|---|---|---|---|---|---|
| 7 Birch Blvd Fort Myers, FL | 3.0 | 2.0 | 1280 | $1,600 | $1.25 | 23d | 1 | 0.13mi |
| 11596 Palm Dr Fort Myers, FL | 3.0 | 2.0 | 1394 | $2,450 | $1.76 | 23d | 1 | 0.39mi |
| 12641 Kelly Sands Way #225 Fort Myers, FL | 2.0 | 2.0 | 1069 | $5,000 | $4.68 | 23d | 1 | 0.56mi |
| 12621 Kelly Sands Way #305 Fort Myers, FL | 2.0 | 2.0 | 1106 | $5,000 | $4.52 | 23d | 1 | 0.56mi |
| 16301 Kelly Woods Dr #205 Fort Myers, FL | 2.0 | 2.0 | 1336 | $5,000 | $3.74 | 23d | 1 | 0.58mi |
| 12540 Kelly Greens Blvd #331 Fort Myers, FL | 2.0 | 2.0 | 1440 | $2,100 | $1.46 | 23d | 1 | 0.64mi |
| 12171 Kelly Sands Way #1577 Fort Myers, FL | 2.0 | 2.0 | 1160 | $4,500 | $3.88 | 23d | 1 | 0.65mi |
| 16001 Bayside Pointe Fort Myers, FL | 1.0–3.0 | 1.0–2.0 | 1135 | $2,245 | $1.98 | 1d | 18 | 0.67mi |
| 12150 Kelly Sands Way Fort Myers, FL | 2.0 | 2.0 | 1087 | $4,700 | $4.32 | 23d | 2 | 0.75mi |
| 12150 Kelly Sands Way Fort Myers, FL | 2.0 | 2.0 | 1087 | $3,325 | $3.06 | 3d | 3 | 0.75mi |
| 16007 Davis Rd #614 Fort Myers, FL | 2.0 | 2.0 | 820 | $3,500 | $4.27 | 23d | 1 | 0.78mi |
| 12250 Kelly Greens Blvd #57 Fort Myers, FL | 2.0 | 2.0 | 1336 | $1,999 | $1.50 | 23d | 1 | 0.78mi |
| 13502 Siesta Pines Ct #402 Fort Myers, FL | 2.0 | 2.0 | 955 | $1,475 | $1.54 | 13d | 1 | 0.78mi |
| 15761 Windward Way Cir #3302 Fort Myers, FL | 2.0 | 2.0 | 1050 | $4,500 | $4.29 | 3d | 1 | 0.79mi |
| 16470 Kelly Cove Dr Fort Myers, FL | 2.0 | 2.0 | 1214 | $3,550 | $2.92 | 3d | 2 | 0.80mi |
| 16470 Kelly Cove Dr #2850 Fort Myers, FL | 2.0 | 2.0 | 1216 | $5,000 | $4.11 | 23d | 1 | 0.80mi |
| 15770 Windward Way Cir #2205 Fort Myers, FL | 2.0 | 2.0 | 1050 | $1,600 | $1.52 | 23d | 1 | 0.82mi |
| 15999 Mandolin Bay Dr #202 Fort Myers, FL | 2.0 | 2.0 | 1152 | $1,775 | $1.54 | 23d | 1 | 0.83mi |
| 16500 Kelly Cove Dr #2880 Fort Myers, FL | 2.0 | 2.0 | 1283 | $4,800 | $3.74 | 23d | 1 | 0.83mi |
| 13527 Siesta Pines Ct Fort Myers, FL | 2.0 | 2.5 | 1244 | $1,900 | $1.53 | 23d | 1 | 0.84mi |
| 15989 Mandolin Bay Dr Fort Myers, FL | 2.0 | 2.0 | 1152 | $1,695 | $1.47 | 23d | 1 | 0.85mi |
| 13533 Siesta Pines Ct Fort Myers, FL | 2.0 | 3.0 | 1246 | $1,800 | $1.44 | 23d | 1 | 0.85mi |
| 16821 Sanibel Sunset Ct #203 Fort Myers, FL | 2.0 | 2.0 | 1271 | $1,750 | $1.38 | 10d | 1 | 0.86mi |
| 13430 Pine Needle Ln Fort Myers, FL | 2.0 | 1.0 | 922 | $1,200 | $1.30 | 3d | 1 | 0.87mi |
| 13420 Hidden Palms Cv Fort Myers, FL | 2.0 | 2.0 | 1450 | $1,600 | $1.10 | 23d | 1 | 0.87mi |
| 13426 Pine Needle Ln Fort Myers, FL | 2.0 | 1.0 | 922 | $1,275 | $1.38 | 21d | 1 | 0.87mi |
| 16599 Davis Rd Fort Myers, FL | 2.0 | 2.0 | 851 | $1,800 | $2.12 | 23d | 1 | 0.89mi |
| 13401 Pine Needle Ln Unit 13405 Fort Myers, FL | 2.0 | 1.0 | 852 | $1,300 | $1.53 | 3d | 1 | 0.91mi |
| 13405 Pine Needle Ln Fort Myers, FL | 2.0 | 1.0 | 852 | $1,300 | $1.53 | 3d | 1 | 0.91mi |
| 11861 Caraway Ln #116 Fort Myers, FL | 2.0 | 2.0 | 1056 | $1,995 | $1.89 | 19d | 1 | 0.91mi |
| 13403 Pine Needle Ln Fort Myers, FL | 2.0 | 1.0 | 852 | $1,300 | $1.53 | 3d | 1 | 0.91mi |
| 11701 Olivetti Ln Unit 210 Fort Myers, FL | 2.0 | 2.0 | 1305 | $4,500 | $3.45 | 23d | 1 | 0.92mi |
| 15000 Iona Lakes Dr Fort Myers, FL | 1.0–3.0 | 1.0–2.0 | 900 | $1,946 | $2.16 | 1d | 26 | 0.92mi |
| 11701 Olivetti Ln Unit 1545836P Fort Myers, FL | 3.0 | 2.0 | 1388 | $4,214 | $3.04 | 13d | 1 | 0.93mi |
| 11711 Pasetto Ln #102 Fort Myers, FL | 2.0 | 2.0 | 1055 | $2,200 | $2.09 | 23d | 1 | 0.95mi |
| 16805 Davis Rd #123 Fort Myers, FL | 2.0 | 2.0 | 808 | $1,399 | $1.73 | 23d | 1 | 0.96mi |
| 16881 Davis Rd Fort Myers, FL | 1.0–2.0 | 1.0–2.0 | 767 | $1,800 | $2.35 | 15d | 3 | 0.97mi |
| 16881 Davis Rd Fort Myers, FL | 2.0 | 1.0–2.0 | 837 | $1,600 | $1.91 | 3d | 2 | 0.97mi |
| 11701 Pasetto Ln Unit 1049715P Fort Myers, FL | 3.0 | 2.0 | 1496 | $2,960 | $1.98 | 21d | 1 | 0.97mi |
| 20021 Sanibel View Cir #105 Fort Myers, FL | 2.0 | 2.0 | 1417 | $4,800 | $3.39 | 23d | 1 | 0.97mi |
HOA detail
- Monthly dues
- $99 · $1,188/yr
- Likely covers
- pool
Listing history 27 events
-
2026-06-17days on market $244,900 Active 264 DOM
-
2026-06-16days on market $244,900 Active 263 DOM
-
2026-06-16days on market $244,900 Active 262 DOM
-
2026-06-13days on market $244,900 Active 260 DOM
-
2026-06-09days on market $244,900 Active 256 DOM
-
2026-06-07days on market $244,900 Active 254 DOM
-
2026-06-02days on market $244,900 Active 249 DOM
-
2026-06-01days on market $244,900 Active 248 DOM
-
2026-06-01days on market $244,900 Active 247 DOM
-
2026-04-26price $244,900
-
2026-04-03price $249,900
-
2026-03-27price $259,900
-
2026-02-20price $264,900
-
2026-02-06price $269,900
-
2026-01-17price $274,900
-
2025-09-26$279,900 Active
-
2025-08-01historical
-
2025-06-17price $309,900
-
2025-05-16price $295,000
-
2024-11-22$324,900 Active
-
2024-10-18historical
-
2024-10-18historical
-
2024-10-16$60,000
-
2023-12-05soldstatus $55,000 Sold
-
2023-11-21status Pending
-
2023-10-17$60,000 Active
-
1986-07-01soldstatus $2,385,000
ⓘ Source: listings_history table (triggers on properties + properties_extension) + one-shot
backfill from property_details.listing_events for pre-trigger history.
Tax reassessment forecast FL · Resets to sale price
- Current annual tax
- $582 · $48/mo
- Projected year-2 tax
- $2,033 · $169/mo
- Expected delta
- +$1,451/yr (+$121/mo · 249.6%)
ⓘ Screening estimate from a state-policy table — verify with the county assessor before closing.
Climate risk First Street
- Flood 9/10 Extreme FEMA zone AE · 99% chance over 30 yrs
- Wildfire 3/10 Moderate
- Heat 10/10 Extreme 7 d/yr ≥107°F today · 28 d/yr by 30 yrs out
- Wind 10/10 Extreme 99% chance of damaging wind over 30 yrs
- Air quality 2/10 Low 1 unhealthy d/yr today · 1 by 30 yrs out
Nearby sold comps map
Loading sold comps map…
Walkable amenities ~0.75 mi
Loading nearby amenities…
Taxation est. · year 1
- Rental income
- $28,151
- − Mortgage interest
- −$13,718
- − Property taxes
- −$582
- − Insurance
- −$6,343
- − Repairs & maintenance
- −$2,252
- − Management
- −$2,252
- − HOA
- −$1,188
- − Depreciation
- −$7,124
- Taxable loss
- −$5,308
- Est. tax savings @ 24.0%
- +$1,274
- After-tax cash flow
- $-11/yr
For passive investors: Depreciation is non-cash, so a rental often shows a tax loss while cash-flowing — sheltering income. Rental losses are passive: they offset passive income freely, and up to $25,000/yr can offset ordinary (W-2) income if you actively participate and your MAGI is under $100k (phasing out to $0 by $150k); unused losses carry forward. On sale, claimed depreciation is recaptured at up to 25%, and gains may owe capital-gains tax (a 1031 exchange can defer both). Figures are a year-1 estimate at your 24.0% rate — not tax advice; consult a CPA.
Schools (NCES district)
- District
- Lee
- NCES district ID
- 1201080
- Math proficiency
- 47% ▼ -11.00%
- Reading proficiency
- 50% ▼ -4.00%
- Median HH income
- $49,518
- Composite
- 41.49/100
- National rank
- #3458
- State rank
- #42 of 73 in FL
Livability — Iona
- Score
- 72/100
- State rank
- #359
- US rank
- #6253
Category grades
Schools grade is shown separately in the Schools card above.
Census & demographics
- Census place
- Iona, FL
- County
- Lee County · 788,662 people
- Metro
- Cape Coral-Fort Myers, FL
- Population (ZIP)
- 37,423
- Household income
- $75,396
- Rent vs Own
- Severe rent burden
- 1944.0
Population outlook (Lee County) Hauer SSP2
- Today (2025)
- 871,946 people
- By 2030
- 955,468 · +9.6%
- By 2040
- 1,113,587 · +27.7%
- By 2050
- 1,256,891 · +44.1%
- By 2075
- 1,560,270 · +78.9%
- By 2100
- 1,726,848 · +98.0%
Race, ethnicity, and origin ACS 2023
- Neighborhood character
- Predominantly White (88%)
- Race & ethnicity
- White 88% Hispanic / Latino 6% Two or more races 5% Black 3% Asian 1%
- Hispanic origin (detail)
- Mexican 1% Puerto Rican 2%
- Common ancestry
- Romanian 5% Lithuanian 4% Slovak 3%
- Foreign-born
- 10% · Canada, Jamaica
- Languages at home
- 90% English-only · Spanish 4% Russian/Polish/Slavic 1% Other Indo-European 1%
Political lean MEDSL · Lee
- 2024 margin
- Strong R (+28.4) · D 35.5% · R 63.9%
- 2008→2024 swing
- -18.0pp toward R · 2008: -10.4pp · 2024: -28.4pp
- All cycles
- 2024: R+28.4 2020: R+19.2 2016: R+20.4 2012: R+16.6 2008: R+10.4
Not yet ingested
- Civics
- —
Market trends
- HPI YoY
- ▼ -102.22%
- Current HPI
- 209.7595
- Rent YoY
- ▼ -1.18%
- Metro
- Cape Coral-Fort Myers, FL
- State GDP YoY
- ▲ 3.28%
- F500 in state
- 36
Industry mix (Fortune 500 HQ in FL)
| Industry | F500 HQs | Revenue |
|---|---|---|
| Industrial Technology | 2 | $29B |
|
||
| Insurance | 2 | $17B |
|
||
| Retail | 1 | $60B |
|
||
| Technology Distribution | 1 | $58B |
|
||
| Homebuilding | 1 | $35B |
|
||
| Technology Manufacturing | 1 | $35B |
|
||
Price history
-89.7% since first listed18 events — show timeline
- 2026-04-26 Price Changed $244,900 FORTMLS
- 2026-04-03 Price Changed $249,900 FORTMLS
- 2026-03-27 Price Changed $259,900 FORTMLS
- 2026-02-20 Price Changed $264,900 FORTMLS
- 2026-02-06 Price Changed $269,900 FORTMLS
- 2026-01-17 Price Changed $274,900 FORTMLS
- 2025-09-26 Listed $279,900 FORTMLS
- 2025-08-01 Listing Removed — FORTMLS
- 2025-06-17 Price Changed $309,900 FORTMLS
- 2025-05-16 Price Changed $295,000 FORTMLS
- 2024-11-22 Listed $324,900 FORTMLS
- 2024-10-18 Listing Removed — FORTMLS
- 2024-10-18 Listing Removed — FORTMLS
- 2024-10-16 Listed $60,000 FORTMLS
- 2023-12-05 Sold (MLS) $55,000 BEARMLS
- 2023-11-21 Pending — BEARMLS
- 2023-10-17 Listed $60,000 BEARMLS
- 1986-07-01 Sold (Public Records) $2,385,000 Public Records
Property tax history
-4.4%/yrLatest (2025): $582 · -13.2% YoY. Source: county tax records.
Cash-flow waterfall
monthlySold comps — $/sqft
last 12 mo · ≤1 miLoading sold comps…