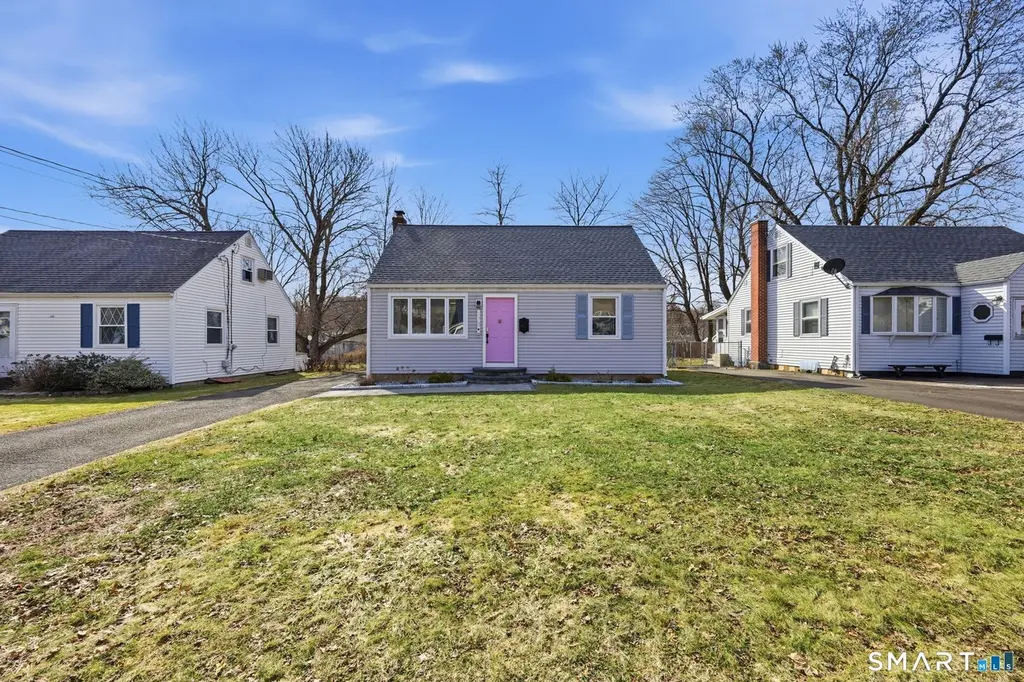
178 Alexander Rd · New Britain, CT
Flood risk 1/10 · Minimal
- FEMA flood zone
- X (unshaded)
- Chance of flooding over 30 yrs
- 0.0%
- Est. flood insurance / yr
- $473 – $860
Fire risk 1/10 · Minimal
- Est. fire insurance / yr
- $829 – $1,539
Heat risk 5/10 · Moderate
- Hot days now (above 97°F)
- 7 days/yr
- Hot days in 30 yrs
- 16 days/yr
Wind risk 6/10 · Moderate
- Chance of severe wind over 30 yrs
- 27.0%
Air-quality risk 3/10 · Minor
- Unhealthy air days now
- 2 days/yr
- Unhealthy air days in 30 yrs
- 3 days/yr
Risk factors via First Street. Map © Google.
Why this score? — see what drove the F grade
The composite is a weighted blend of 9 inputs, each scored 0–100. Each bar is that input's sub-score; the figure is the points it added to the 100-point composite (weight × sub-score).
- Appreciation +10.0/10.0
- Cash flow +7.9/30.0
- Rent growth +3.7/5.0
- Livability +3.7/5.0
- Condition / age +2.5/5.0
- 1% rule +2.4/10.0
- DSCR +2.0/10.0
- Schools +1.0/10.0
- ARV discount +0.0/15.0
$315,000
🖨 Deal sheet 📄 Offer letter ✓ Due diligence
Listing remarks MLS
*Nothing to do but move in* spacious cape w/huge master suite. Newer roof, vinyl siding & thermal windows. Remodeled kitchen w/vaulted ceilings. Finished basement not included in sf. Close to highways, shopping & parks.
Key facts
- Updated appliances
- Built-in cabinetry
- Finished basement
Tags
Neighborhood map
What this means for you Summary
Snapshot
- This is a 3-bed/1.0-bath single-family listed at $315k.
Deal economics
- At list price, monthly cash flow is $-336 ($-4k/yr) — negative.
- To cash-flow at today's rent, offer at most $256k (18.9% below list).
- To meet the 1% rule (rent ≥ 1% of price), the offer needs to be $232k (26.4% below list).
- Recommended offer: $232k (26.4% below list) — sets the bar for 1% rule.
Location & tenants
- Location reads 74/100 on livability (#67 in CT, #4,936 nationally) — a middle-class / working-renter tenant base. Strengths: health & safety A+, cost of living A, housing A; Watch: crime D, employment D, schools F.
- New Britain School District (suburban): math 6% / reading 17% proficiency, ranked #153 of 153 in CT (top 100%) — low school quality limits family demand, transient renter base, plan for 1-2y turnover; 71% free/reduced lunch — lower-income household profile, screen leases tightly.
- Market conditions: Rents rising fast (+4.9%/yr); 69 active listings in the ZIP; 5 comparable units currently listed for rent nearby; rentals leasing fast (median 2d on market — plan ~1-2 weeks tenant-placement turnaround); 1,867 units permitted in Capitol Planning Region in 2024 (1,399 in 5+ unit buildings).
- This rent runs 44% of the median local income ($63k/yr) — at the standard rent-burdened threshold; future hikes will face affordability resistance.
Forward outlook
- In year one you build about $34k of equity ($2k loan paydown + $32k appreciation (10.0% local appreciation)).
- By year 2, paydown + projected appreciation supports a ~$54k cash-out refi (75% LTV) — recoverable capital for the next deal without selling this one.
Negotiation context
- Only 6 days on market — expect competitive offers; lowballing is unlikely to land.
- 2 sale attempts since 19y ago with the ask held roughly flat each time — persistent listings suggest the price (not the market) is what's stuck; bring a comps-based counter.
- Current owner paid $150k; list at $315k implies a 110% gain — meaningful room to come down on a strong offer.
Risks & watch-outs
- Watch-outs: built in 1952 — expect roof / HVAC / electrical / plumbing capex.
- Climate carrying-cost: major wind risk, 27% chance of damaging wind over 30y; extreme-heat days projected 7→16/yr by 2055 (HVAC capex compounding) — expect insurance premiums to compound above CPI over the hold.
Questions for the listing agent
- What do current leases actually rent for vs. the listed asking? Can we see a recent rent roll and the last 12 months of T-12 income?
- Built in 1952 — when were the roof, HVAC, electrical panel, plumbing, and water heater last replaced?
- Is there a deadline driving the sale (1031 exchange, divorce, estate, relocation)? That informs how much negotiation room exists.
- Schools are F-rated, which usually means shorter tenancies and higher turnover. Who's the typical renter profile here, and what's been the actual vacancy rate?
- Crime grade is D in this area — have there been break-ins, vandalism, or insurance claims at this property in the last 3 years? What carrier currently insures it and at what premium?
- The area grade is low — what's the realistic commute time and amenity access for the typical tenant pool here? Any planned neighborhood developments (good or bad) we should know about?
- What's the average days-on-market for RENTAL listings here right now (not sales)? A rising rental-DOM trend means longer vacancies and softer asking-rent achievability than the comps imply.
- What's the recent tenant-quality profile in this submarket — average credit score on applications, eviction rate, late-payment / NSF rate, and stable-employment percentage? A property-management company in the area should have these aggregated.
- How much new for-sale + rental construction is in the pipeline within 1–3 miles? Heavy new supply typically softens prices + rents 12–24 months out; constrained supply supports both.
Investment metrics
- 1% rule
- 0.74% ✗
- Cap rate
- 5.01%
- Cash-on-cash
- -4.58%
- DSCR
- 0.80
- GRM
- 11.3
CMA / ARV
- ARV (on-the-fly)
- $246,582
- Comps found
- 4
Show comp detail 4 sales within ~0.75 mi
| Address | Dist | Beds/Ba | Sqft | Sold | Price | $/sf | Match |
|---|---|---|---|---|---|---|---|
| 35 Cianci Rd | 0.25mi | 3/1.0 | 832 (+4%) | 11mo | $250,000 | $300 | 72 |
| 80 Nachilly Dr | 0.18mi | 2/1.0 (-1) | 832 (+4%) | 9mo | $290,000 | $349 | 72 |
| 256 Alexander Rd | 0.15mi | 3/1.0 | 884 (+11%) | 10mo | $255,000 | $288 | 66 |
| 266 Cianci Rd | 0.19mi | 2/1.0 (-1) | 910 (+14%) | 10mo | $281,000 | $309 | 54 |
Match score weights: distance 35% · size 25% · config 20% · recency 20%. Top-matched comps best support the ARV.
Projected returns pro-forma
10.0% appreciation · 4.94% rent growth · sell at horizon
- IRR
- 21.6%
- Equity multiple
- 2.75×
- Total profit
- $154,772
- Equity at exit
- $283,777
- IRR
- 19.9%
- Equity multiple
- 6.47×
- Total profit
- $482,817
- Equity at exit
- $611,976
Cash invested: $88,200 (down + closing). Projections, not guarantees.
Landlord ↔ Tenant lean methodology
- Overall (STATE)
- 27 Tenant-Leaning
- State Connecticut
- 27 Tenant-Leaning · D+7
- County
- — inherits STATE
- City
- — inherits STATE
ZIP-level market 06053
- Home prices YoY
- 15.4%
- Rents YoY
- 4.9%
- Active inventory
- 69
- Price-to-rent
- 11.3×
Monthly cashflow live
- Estimated rent
- $2,319 medium interval (Pro) →
- Mortgage (P&I)
- −$1,652
- Tax from tax record
- −$385 /mo · $4,619/yr
- Insurance
- −$131
- HOA
- −$0
- Vacancy / Maint / Mgmt
- −$487
- Net cashflow
- $-336
Break-even live
UW: 25.0% down · 7.5% · 30yr · 1.5% tax · 5.0% vac · 8.0% maint · 8.0% mgmt
Financing live
Cash to close
- Down payment
- $78,750
- Closing costs
- $9,450
- Reserves months
- —
- Total cash needed
- —
Loan-product check · same deal, 3 products live
Conventional
25% down · 7.5% · 30yr
- Down + closing
- —
- Monthly P&I
- —
- Monthly cashflow
- —
- DSCR
- —
- Eligible?
- —
Personal DTI + credit; lowest rate.
DSCR
20% down · 8.5% · 30yr
- Down + closing
- —
- Monthly P&I
- —
- Monthly cashflow
- —
- DSCR
- —
- Eligible?
- —
No personal income docs; deal must DSCR.
Hard money
10% down · 12.0% · 12mo
- Down + closing
- —
- Monthly P&I
- —
- Monthly cashflow
- —
- DSCR
- —
- Eligible?
- —
Short-term bridge; refi at stabilization.
Rent comps 5 comps
| Address | Beds | Baths | Sqft | Rent | $/sqft | DOM | Units | Dist |
|---|---|---|---|---|---|---|---|---|
| 46 Brittany Farms Rd New Britain, CT | 1.0–2.0 | 1.0 | 820 | $2,025 | $2.47 | 1d | 1 | 0.63mi |
| 80 Batterson Park Rd Farmington, CT | 2.0 | 1.0–2.0 | 900 | $4,793 | $5.32 | 1d | 98 | 0.86mi |
| 15 Farm Springs Rd Farmington, CT | 2.0 | 2.0 | 864 | $3,599 | $4.16 | 1d | 18 | 1.16mi |
| 1600 New Britain Ave Farmington, CT | 1.0–2.0 | 1.0–1.5 | 1112 | $2,595 | $2.33 | 1d | 1 | 1.32mi |
| 87 Jackson St New Britain, CT | 2.0 | 1.0 | 800 | $1,700 | $2.12 | 43d | 1 | 1.44mi |
Listing history 7 events
-
2026-03-25status Under Contract
-
2026-03-19$315,000 Active
-
2020-12-21soldstatus $150,000
-
2007-04-30soldstatus $178,000
-
2007-04-27soldstatus $178,000 227-char remark
Show marketing remark (227 chars)
*Nothing to do but move in* spacious cape w/huge master suite. Newer roof, vinyl siding & thermal windows. Remodeled kitchen w/vaulted ceilings. Finished basement not included in sf. Close to highways, shopping & parks.
-
2007-02-13$179,900 227-char remark
Show marketing remark (227 chars)
*Nothing to do but move in* spacious cape w/huge master suite. Newer roof, vinyl siding & thermal windows. Remodeled kitchen w/vaulted ceilings. Finished basement not included in sf. Close to highways, shopping & parks.
-
1995-06-05soldstatus $61,500
ⓘ Source: listings_history table (triggers on properties + properties_extension) + one-shot
backfill from property_details.listing_events for pre-trigger history.
Tax reassessment forecast CT · Partial reset (capped growth)
- Current annual tax
- $4,619 · $385/mo
- Projected year-2 tax
- $5,680 · $473/mo
- Expected delta
- +$1,061/yr (+$88/mo · 23.0%)
ⓘ Screening estimate from a state-policy table — verify with the county assessor before closing.
Climate risk First Street
- Flood 1/10 Low FEMA zone X (unshaded) · 0% chance over 30 yrs
- Wildfire 1/10 Low
- Heat 5/10 Major 7 d/yr ≥97°F today · 16 d/yr by 30 yrs out
- Wind 6/10 Major 27% chance of damaging wind over 30 yrs
- Air quality 3/10 Moderate 2 unhealthy d/yr today · 3 by 30 yrs out
Nearby sold comps map
Loading sold comps map…
Walkable amenities ~0.75 mi
Loading nearby amenities…
Taxation est. · year 1
- Rental income
- $27,822
- − Mortgage interest
- −$17,645
- − Property taxes
- −$4,619
- − Insurance
- −$1,575
- − Repairs & maintenance
- −$2,226
- − Management
- −$2,226
- − Depreciation
- −$9,164
- Taxable loss
- −$9,632
- Est. tax savings @ 24.0%
- +$2,312
- After-tax cash flow
- $-1,726/yr
For passive investors: Depreciation is non-cash, so a rental often shows a tax loss while cash-flowing — sheltering income. Rental losses are passive: they offset passive income freely, and up to $25,000/yr can offset ordinary (W-2) income if you actively participate and your MAGI is under $100k (phasing out to $0 by $150k); unused losses carry forward. On sale, claimed depreciation is recaptured at up to 25%, and gains may owe capital-gains tax (a 1031 exchange can defer both). Figures are a year-1 estimate at your 24.0% rate — not tax advice; consult a CPA.
Schools (NCES district)
- District
- New Britain School District
- NCES district ID
- 0902670
- Math proficiency
- 6% ▼ -6.00%
- Reading proficiency
- 17% ▼ -5.00%
- Median HH income
- $40,827
- Composite
- 9.95/100
- National rank
- #9816
- State rank
- #153 of 153 in CT
Livability — New Britain
- Score
- 74/100
- State rank
- #67
- US rank
- #4936
Category grades
Schools grade is shown separately in the Schools card above.
Census & demographics
- Census place
- New Britain, CT
- County
- Hartford County · 754,208 people
- City population
- 66,322
- Metro
- Hartford-East Hartford-Middletown, CT
- Population (ZIP)
- 36,774
- Household income
- $62,645
- Rent vs Own
- Severe rent burden
- 1835.0
Population outlook (Capitol County) Hauer SSP2
- By 2040
- 1,063,519
Race, ethnicity, and origin ACS 2023
- Neighborhood character
- Diverse neighborhood (Simpson 0.64)
- Race & ethnicity
- White 47% Hispanic / Latino 36% Two or more races 13% Black 10% Asian 3%
- Hispanic origin (detail)
- Mexican 1% Puerto Rican 25% Dominican 4%
- Common ancestry
- Romanian 19% Lithuanian 3% Russian 1%
- Foreign-born
- 22% · Canada, Vietnam, China
- Languages at home
- 50% English-only · Spanish 26% Russian/Polish/Slavic 15% French/Haitian/Cajun 3%
Political lean MEDSL · Capitol
- 2024 margin
- Strong D (+21.9) · D 60.1% · R 38.2% · Other 1.7%
- All cycles
- 2024: D+21.9
Not yet ingested
- Civics
- —
Market trends
- HPI YoY
- ▲ 65.76%
- Current HPI
- 491.4724
- Rent YoY
- ▲ 4.94%
- Metro
- Hartford-East Hartford-Middletown, CT
- State GDP YoY
- ▲ 1.06%
- F500 in state
- 38
Industry mix (Fortune 500 HQ in CT)
| Industry | F500 HQs | Revenue |
|---|---|---|
| Industrial Machinery | 4 | $38B |
|
||
| Insurance | 3 | $71B |
|
||
| Financial Services | 2 | $25B |
|
||
| Transportation / Logistics | 2 | $18B |
|
||
| Healthcare | 1 | $247B |
|
||
| Telecommunications | 1 | $55B |
|
||
Price history
+412.2% since first listed7 events — show timeline
- 2026-03-25 Pending — Smart MLS
- 2026-03-19 Listed $315,000 Smart MLS
- 2020-12-21 Sold (Public Records) $150,000 Public Records
- 2007-04-30 Sold (Public Records) $178,000 Public Records
- 2007-04-27 Sold (MLS) $178,000 Smart MLS
- 2007-02-13 Listed $179,900 Smart MLS
- 1995-06-05 Sold (Public Records) $61,500 Public Records
Property tax history
+2.8%/yrLatest (2025): $4,619 · +2.8% YoY. Source: county tax records.
Cash-flow waterfall
monthlySold comps — $/sqft
last 12 mo · ≤1 miLoading sold comps…