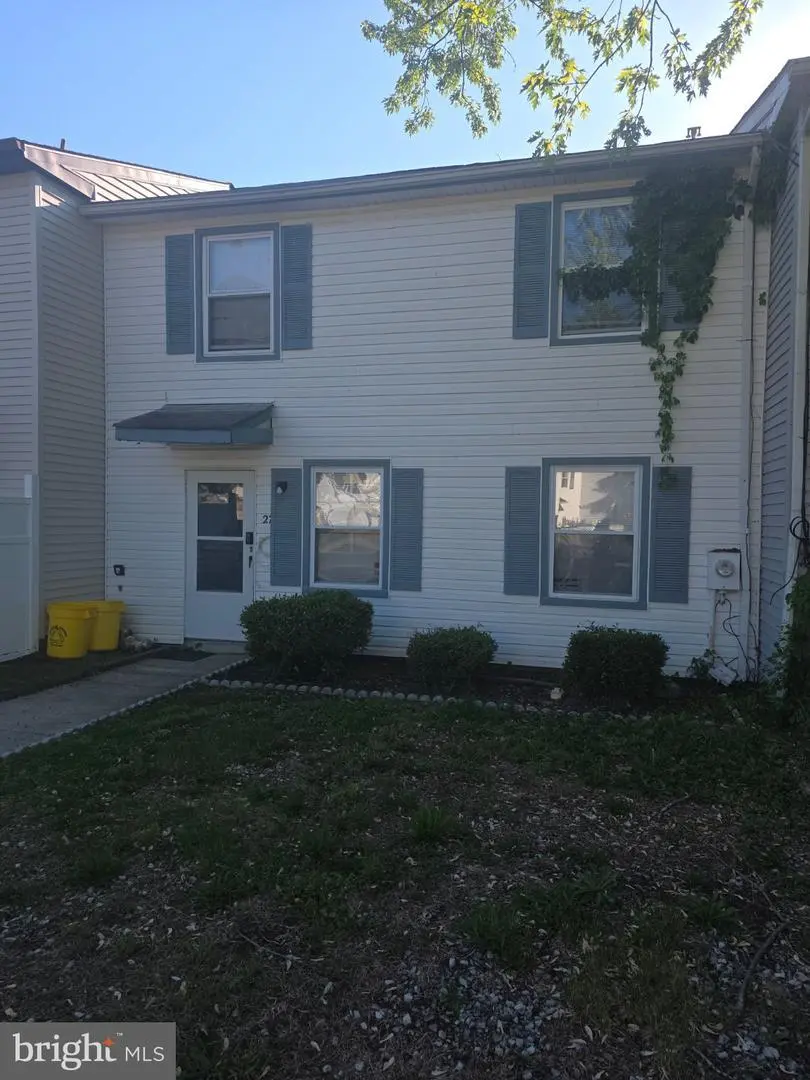
27 Berkshire · Sicklerville, NJ
Flood risk 1/10 · Minimal
- FEMA flood zone
- X (unshaded)
- Chance of flooding over 30 yrs
- 0.0%
- Est. flood insurance / yr
- $507 – $1,088
Fire risk 2/10 · Minimal
- Est. fire insurance / yr
- $526 – $976
Heat risk 6/10 · Moderate
- Hot days now (above 103°F)
- 7 days/yr
- Hot days in 30 yrs
- 15 days/yr
Wind risk 6/10 · Moderate
- Chance of severe wind over 30 yrs
- 62.0%
Air-quality risk 3/10 · Minor
- Unhealthy air days now
- 3 days/yr
- Unhealthy air days in 30 yrs
- 3 days/yr
Risk factors via First Street. Map © Google.
Why this score? — see what drove the C grade
The composite is a weighted blend of 9 inputs, each scored 0–100. Each bar is that input's sub-score; the figure is the points it added to the 100-point composite (weight × sub-score).
- Cash flow +23.8/30.0
- ARV discount +8.8/15.0
- DSCR +7.7/10.0
- 1% rule +5.7/10.0
- Rent growth +3.4/5.0
- Schools +2.6/10.0
- Livability +2.5/5.0
- Condition / age +2.5/5.0
- Appreciation +0.0/10.0
$200,000
🖨 Deal sheet 📄 Offer letter ✓ Due diligence
Listing remarks
This charming townhouse in Brittany Woods offers a perfect blend of comfort and functionality. With 2 cozy bedrooms and a well-appointed full bathroom, this home is designed for easy living. The eat-in kitchen features stainless steel appliances, including a sleek stove and range hood, making meal prep a delight. The laminate plank flooring throughout adds a modern touch while ensuring durability. Natural light pours in through double-hung windows, creating a warm and inviting atmosphere. Enjoy the convenience of upper-floor laundry, making chores a breeze. The concrete driveway provides ample parking for you and your guests. Set on a manageable 0.14-acre lot, this home is perfect for those
Key facts
- 2 parking spots
- Built 1978
- Listed 23 days
Property features AI
Finance
- HOA & community: Ground rent paid annually
Exterior
- Parking: Concrete driveway with space for two vehicles (driveway provides 2 spaces); Total of 2 garage/parking spaces
- Utilities: Public water; Public sewer; 100 amp electric service; Hot water: Other
- Home design: Interior townhouse/rowhouse; Shingle, pitched roof; Double-hung windows; Fee simple ownership; Not in a federal flood zone
- Construction: Vinyl siding; Slab foundation; Building not winterized; Other structures above and below grade
- Exterior features: Chain link fencing; Lot dimensions approximately 30 x 210
Interior
- Kitchen: Refrigerator; Range hood; Stove; Stainless steel appliances
- Bedrooms: Two bedrooms on the first upper level
- Flooring: Laminate plank
- Bathrooms: One full bathroom
- Heating & cooling: Forced air heating (natural gas); Central air conditioning (natural gas)
- Interior features: Eat-in kitchen; Not furnished
- Laundry & utility: Laundry on upper floor
Neighborhood map
What this means for you Summary
Snapshot
- This is a 2-bed/1.0-bath townhouse listed at $200k.
Deal economics
- At list price, monthly cash flow is $384 ($5k/yr) — positive.
- The deal already cash-flows at list — no discount required.
- Meets the 1% rule at list price ($2k rent vs $200k).
- Recommended offer: $197k (1.5% below list) — sets the bar for market timing.
- Cap rate 8.6% vs local median 4.7% in Sicklerville — top-decile yield for the area; either an underpriced asset or a hidden risk that comps aren't pricing in. Stress-test before assuming the spread holds.
Location & tenants
- Location reads: area grade C — affects rentability + tenant quality, not the cash-flow math above.
- Gloucester Township Public Schools (suburban): math 14% / reading 41% proficiency, ranked #351 of 472 in NJ (top 74%) — low school quality limits family demand, transient renter base, plan for 1-2y turnover.
- Zoned schools: Gloucester Township Elementary School (math 8% / reading 42%, grade F, #871 of 1,303 statewide, top 67%, 244 students, 33% FRL).
- Market conditions: Rents rising (+3.4%/yr); 329 active listings in the ZIP; 11 comparable units currently listed for rent nearby; rentals leasing fast (median 1d on market — plan ~1-2 weeks tenant-placement turnaround); solid renter incomes; 1,018 units permitted in Camden County in 2024 (509 in 5+ unit buildings).
Forward outlook
- Local home prices are declining (-3.0%/yr); year-one equity from $1k of loan paydown is wiped out by about $6k of value loss. Plan a longer hold.
- Camden County population projected to shrink 8% by 2050 — rents likely to lag national; underwrite the cash flow, not the appreciation.
Negotiation context
- It's been on market 24 days — a 2% lower offer ($197k) is reasonable based on typical stale-listing flexibility.
- Current owner paid $60k; list at $200k implies a 233% gain — meaningful room to come down on a strong offer.
Risks & watch-outs
- Climate carrying-cost: major wind risk, 62% chance of damaging wind over 30y; extreme-heat days projected 7→15/yr by 2055 (HVAC capex compounding) — expect insurance premiums to compound above CPI over the hold.
Questions for the listing agent
- Built in 1978 — when were the roof, HVAC, electrical panel, plumbing, and water heater last replaced?
- Is there a deadline driving the sale (1031 exchange, divorce, estate, relocation)? That informs how much negotiation room exists.
- What's the average days-on-market for RENTAL listings here right now (not sales)? A rising rental-DOM trend means longer vacancies and softer asking-rent achievability than the comps imply.
- What's the recent tenant-quality profile in this submarket — average credit score on applications, eviction rate, late-payment / NSF rate, and stable-employment percentage? A property-management company in the area should have these aggregated.
- How much new for-sale + rental construction is in the pipeline within 1–3 miles? Heavy new supply typically softens prices + rents 12–24 months out; constrained supply supports both.
Investment metrics
- 1% rule
- 1.07% ✓
- Cap rate
- 8.59%
- Cash-on-cash
- 8.22%
- DSCR
- 1.37
- GRM
- 7.8
CMA / ARV
- ARV (on-the-fly)
- $205,800
- Comps found
- 12
Show comp detail 12 sales within ~0.75 mi
| Address | Dist | Beds/Ba | Sqft | Sold | Price | $/sf | Match |
|---|---|---|---|---|---|---|---|
| 14 Berkshire Rd | 0.04mi | 2/1.0 | 1,050 (0%) | 6mo | $206,000 | $196 | 93 |
| 61 Berkshire Rd | 0.08mi | 3/1.0 (+1) | 1,050 (0%) | 3mo | $215,000 | $205 | 89 |
| 9 Berkshire Rd | 0.05mi | 2/1.0 | 1,050 (0%) | 11mo | $205,000 | $195 | 89 |
| 69 Edinshire Rd | 0.28mi | 2/1.0 | 1,050 (0%) | 3mo | $215,000 | $205 | 85 |
| 57 Berkshire Rd | 0.08mi | 2/1.0 | 1,050 (0%) | 22mo | $175,000 | $167 | 78 |
| 34--A Maynard | 0.20mi | 2/1.0 | 1,020 (-3%) | 18mo | $200,000 | $196 | 71 |
| 152 Hampshire Rd | 0.29mi | 2/1.0 | 1,050 (0%) | 21mo | $205,000 | $195 | 69 |
| 16 Presidential Dr | 0.47mi | 2/1.0 | 1,056 (+1%) | 18mo | $196,000 | $186 | 62 |
| 51 Edinshire Rd | 0.33mi | 3/1.0 (+1) | 1,162 (+11%) | 6mo | $175,000 | $151 | 57 |
| 61 Edinshire Rd | 0.30mi | 3/1.0 (+1) | 1,162 (+11%) | 9mo | $200,000 | $172 | 56 |
| 62 Hampshire Rd | 0.43mi | 3/1.0 (+1) | 1,162 (+11%) | 13mo | $232,500 | $200 | 46 |
| 82 Hampshire Rd | 0.42mi | 3/1.5 (+1) | 1,162 (+11%) | 17mo | $235,000 | $202 | 42 |
Match score weights: distance 35% · size 25% · config 20% · recency 20%. Top-matched comps best support the ARV.
Projected returns pro-forma
-3.0% appreciation · 3.41% rent growth · sell at horizon
- IRR
- -3.4%
- Equity multiple
- 0.87×
- Total profit
- $-7,101
- Equity at exit
- $29,821
- IRR
- 6.8%
- Equity multiple
- 1.52×
- Total profit
- $28,895
- Equity at exit
- $17,292
Cash invested: $56,000 (down + closing). Projections, not guarantees.
Landlord ↔ Tenant lean methodology
- Overall (STATE)
- 21 Tenant-Leaning
- State New Jersey
- 21 Tenant-Leaning · D+6
- County
- — inherits STATE
- City
- — inherits STATE
ZIP-level market 08081
- Rents YoY
- 3.4%
- Active inventory
- 329
- Price-to-rent
- 7.8×
Monthly cashflow live
- Estimated rent
- $2,141 high interval (Pro) →
- Mortgage (P&I)
- −$1,049
- Tax from tax record
- −$176 /mo · $2,110/yr
- Insurance
- −$83
- HOA
- −$0
- Vacancy / Maint / Mgmt
- −$450
- Net cashflow
- $384
Break-even live
UW: 25.0% down · 7.5% · 30yr · 1.5% tax · 5.0% vac · 8.0% maint · 8.0% mgmt
Financing live
Cash to close
- Down payment
- $50,000
- Closing costs
- $6,000
- Reserves months
- —
- Total cash needed
- —
Loan-product check · same deal, 3 products live
Conventional
25% down · 7.5% · 30yr
- Down + closing
- —
- Monthly P&I
- —
- Monthly cashflow
- —
- DSCR
- —
- Eligible?
- —
Personal DTI + credit; lowest rate.
DSCR
20% down · 8.5% · 30yr
- Down + closing
- —
- Monthly P&I
- —
- Monthly cashflow
- —
- DSCR
- —
- Eligible?
- —
No personal income docs; deal must DSCR.
Hard money
10% down · 12.0% · 12mo
- Down + closing
- —
- Monthly P&I
- —
- Monthly cashflow
- —
- DSCR
- —
- Eligible?
- —
Short-term bridge; refi at stabilization.
Rent comps 11 comps
| Address | Beds | Baths | Sqft | Rent | $/sqft | DOM | Units | Dist |
|---|---|---|---|---|---|---|---|---|
| 37 Berkshire Rd Sicklerville, NJ | 2.0 | 1.0 | 1050 | $1,900 | $1.81 | 1d | 1 | 0.05mi |
| 478 Jarvis Rd Sicklerville, NJ | 3.0 | 1.0 | 1000 | $2,150 | $2.15 | 1d | 1 | 0.25mi |
| 79 Edinshire Rd Sicklerville, NJ | 3.0 | 1.0 | 1050 | $2,500 | $2.38 | 15d | 1 | 0.28mi |
| 55 Presidential Dr Sicklerville, NJ | 3.0 | 1.5 | 1332 | $2,500 | $1.88 | 3d | 1 | 0.48mi |
| 126 Presidential Dr Unit 1 Sicklerville, NJ | 2.0 | 1.0 | 1056 | $1,500 | $1.42 | 16d | 1 | 0.53mi |
| 785 Jarvis Rd Unit B Sicklerville, NJ | 2.0 | 1.0 | 1000 | $1,900 | $1.90 | 1d | 1 | 0.73mi |
| 30 Girard Ave Sicklerville, NJ | 3.0 | 1.0 | 1008 | $2,349 | $2.33 | 16d | 1 | 0.90mi |
| 30 Girard Ave Sicklerville, NJ | 3.0 | 1.0 | 1008 | $2,349 | $2.33 | 24d | 1 | 0.90mi |
| 423 Sonora Ln Sicklerville, NJ | 2.0 | 1.5 | 1292 | $2,400 | $1.86 | 1d | 1 | 0.94mi |
| 33 Cottage Gate Rd Unit B Sicklerville, NJ | 2.0 | 1.0 | 1200 | $1,790 | $1.49 | 1d | 1 | 1.08mi |
| 2403 Beacon Hill Dr Sicklerville, NJ | 2.0 | 2.5 | 1248 | $2,650 | $2.12 | 1d | 1 | 1.16mi |
Listing history 23 events
-
2026-06-18days on market $200,000 Active 24 DOM
-
2026-06-17days on market $200,000 Active 23 DOM
-
2026-06-16days on market $200,000 Active 22 DOM
-
2026-06-15days on market $200,000 Active 21 DOM
-
2026-06-13days on market $200,000 Active 19 DOM
-
2026-06-13days on market $200,000 Active 18 DOM
-
2026-06-09days on market $200,000 Active 15 DOM
-
2026-06-08days on market $200,000 Active 14 DOM
-
2026-06-07days on market $200,000 Active 13 DOM
-
2026-06-04days on market $200,000 Active 10 DOM
-
2026-06-03days on market $200,000 Active 9 DOM
-
2026-06-02days on market $200,000 Active 8 DOM
-
2026-06-01days on market $200,000 Active 7 DOM
-
2026-05-31days on market $200,000 Active 6 DOM
-
2026-05-21historical $200,000
-
2018-06-06soldstatus $60,000
-
2018-05-10historical
-
2017-11-09$71,900 Active
-
1996-05-06soldstatus $49,900
-
1994-03-24soldstatus $33,190
-
1989-09-05soldstatus $55,000
-
1984-01-01soldstatus $43,000
-
1979-02-01soldstatus $28,990
ⓘ Source: listings_history table (triggers on properties + properties_extension) + one-shot
backfill from property_details.listing_events for pre-trigger history.
Tax reassessment forecast NJ · Partial reset (capped growth)
- Current annual tax
- $2,110 · $176/mo
- Projected year-2 tax
- $3,545 · $295/mo
- Expected delta
- +$1,435/yr (+$120/mo · 68.0%)
ⓘ Screening estimate from a state-policy table — verify with the county assessor before closing.
Climate risk First Street
- Flood 1/10 Low FEMA zone X (unshaded) · 0% chance over 30 yrs
- Wildfire 2/10 Low
- Heat 6/10 Major 7 d/yr ≥103°F today · 15 d/yr by 30 yrs out
- Wind 6/10 Major 62% chance of damaging wind over 30 yrs
- Air quality 3/10 Moderate 3 unhealthy d/yr today · 3 by 30 yrs out
Nearby sold comps map
Loading sold comps map…
Walkable amenities ~0.75 mi
Loading nearby amenities…
Taxation est. · year 1
- Rental income
- $25,695
- − Mortgage interest
- −$11,203
- − Property taxes
- −$2,110
- − Insurance
- −$1,000
- − Repairs & maintenance
- −$2,056
- − Management
- −$2,056
- − Depreciation
- −$5,818
- Taxable income
- $1,453
- Est. tax owed @ 24.0%
- −$349
- After-tax cash flow
- $4,255/yr
For passive investors: Depreciation is non-cash, so a rental often shows a tax loss while cash-flowing — sheltering income. Rental losses are passive: they offset passive income freely, and up to $25,000/yr can offset ordinary (W-2) income if you actively participate and your MAGI is under $100k (phasing out to $0 by $150k); unused losses carry forward. On sale, claimed depreciation is recaptured at up to 25%, and gains may owe capital-gains tax (a 1031 exchange can defer both). Figures are a year-1 estimate at your 24.0% rate — not tax advice; consult a CPA.
Schools (NCES district)
- District
- Gloucester Township Public Schools
- NCES district ID
- 3406030
- Math proficiency
- 14% ▼ -28.00%
- Reading proficiency
- 41% ▼ -13.00%
- Median HH income
- $72,539
- Composite
- 26.18/100
- National rank
- #7269
- State rank
- #351 of 472 in NJ
Livability — Sicklerville
No livability data for this city. (Only ~50 U.S. cities are tracked.)
Census & demographics
- Census place
- Sicklerville, NJ
- County
- Camden County · 407,624 people
- City population
- 50,264
- Metro
- Philadelphia-Camden-Wilmington, PA-NJ-DE-MD
- Population (ZIP)
- 50,264
- Household income
- $105,800
- Rent vs Own
- Severe rent burden
- 979.0
Population outlook (Camden County) Hauer SSP2
- Today (2025)
- 507,964 people
- By 2030
- 502,182 · -1.1%
- By 2040
- 485,602 · -4.4%
- By 2050
- 465,630 · -8.3%
- By 2075
- 419,986 · -17.3%
- By 2100
- 369,492 · -27.3%
Race, ethnicity, and origin ACS 2023
- Neighborhood character
- Diverse neighborhood (Simpson 0.65)
- Race & ethnicity
- White 47% Black 34% Two or more races 9% Hispanic / Latino 9% Asian 4%
- Hispanic origin (detail)
- Puerto Rican 5%
- Common ancestry
- Romanian 6% Slovak 2% Iranian 1%
- Foreign-born
- 8% · Canada, China, South Korea
- Languages at home
- 90% English-only · Spanish 4% Other Indo-European 1% Tagalog/Filipino 1%
Political lean MEDSL · Camden
- 2024 margin
- Strong D (+27.4) · D 63.0% · R 35.5% · Other 1.5%
- 2008→2024 swing
- -8.8pp toward R · 2008: 36.2pp · 2024: 27.4pp
- All cycles
- 2024: D+27.4 2020: D+33.5 2016: D+32.4 2012: D+36.6 2008: D+36.2
Not yet ingested
- Civics
- —
Market trends
- HPI YoY
- ▼ -176.48%
- Current HPI
- 303.1017
- Rent YoY
- ▲ 3.41%
- Metro
- Philadelphia-Camden-Wilmington, PA-NJ-DE-MD
- State GDP YoY
- ▲ 2.05%
- F500 in state
- 34
Industry mix (Fortune 500 HQ in NJ)
| Industry | F500 HQs | Revenue |
|---|---|---|
| Consumer Goods | 3 | $31B |
|
||
| Pharmaceuticals | 2 | $153B |
|
||
| Technology | 2 | $21B |
|
||
| Insurance | 2 | $20B |
|
||
| Healthcare | 2 | $19B |
|
||
| Financial Services | 1 | $70B |
|
||
Price history
+589.9% since first listed9 events — show timeline
- 2026-05-21 Coming Soon $200,000 BRIGHT MLS
- 2018-06-06 Sold (Public Records) $60,000 Public Records
- 2018-05-10 Listing Removed — BRIGHT MLS
- 2017-11-09 Listed $71,900 BRIGHT MLS
- 1996-05-06 Sold (Public Records) $49,900 Public Records
- 1994-03-24 Sold (Public Records) $33,190 Public Records
- 1989-09-05 Sold (Public Records) $55,000 Public Records
- 1984-01-01 Sold (Public Records) $43,000 Public Records
- 1979-02-01 Sold (Public Records) $28,990 Public Records
Property tax history
-1.3%/yrLatest (2025): $2,110 · +1.9% YoY. Source: county tax records.
Cash-flow waterfall
monthlySold comps — $/sqft
last 12 mo · ≤1 miLoading sold comps…