 🏗️ New Construction
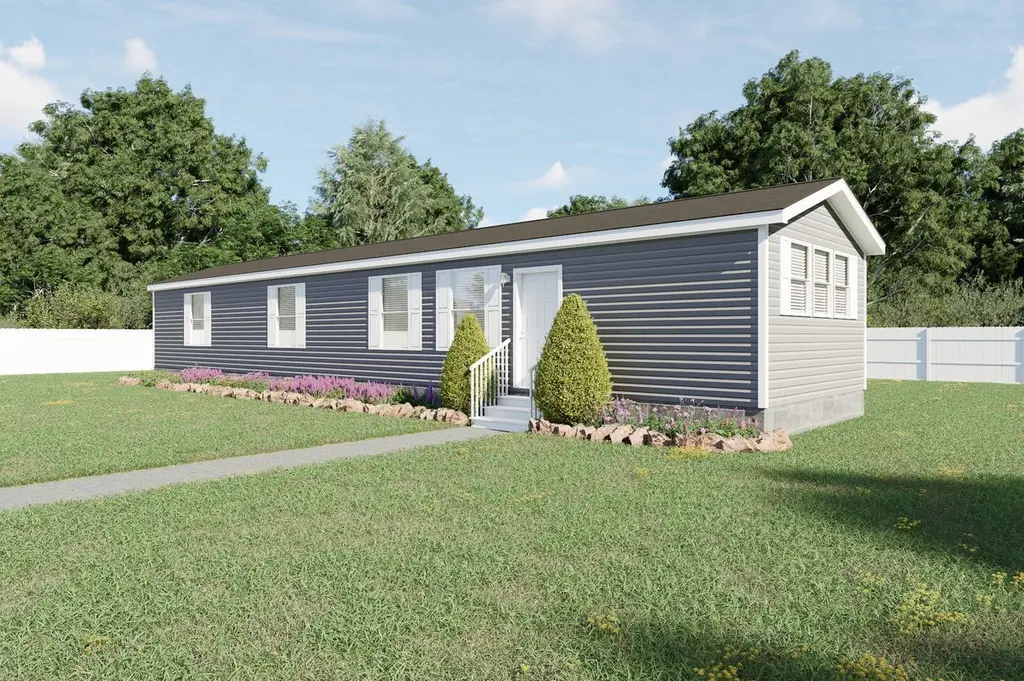
Clayton 198 River Valley Estates Plan · Marion, OH
Flood risk 1/10 · Minimal
- FEMA flood zone
- X (unshaded)
- Chance of flooding over 30 yrs
- 0.0%
- Est. flood insurance / yr
- $507 – $1,088
Fire risk 1/10 · Minimal
- Est. fire insurance / yr
- $713 – $1,323
Heat risk 3/10 · Minor
- Hot days now (above 98°F)
- 7 days/yr
- Hot days in 30 yrs
- 17 days/yr
Wind risk 2/10 · Minimal
- Chance of severe wind over 30 yrs
- —
Air-quality risk 2/10 · Minimal
- Unhealthy air days now
- 1 days/yr
- Unhealthy air days in 30 yrs
- 1 days/yr
Risk factors via First Street. Map © Google.
Why this score? — see what drove the B grade
The composite is a weighted blend of 9 inputs, each scored 0–100. Each bar is that input's sub-score; the figure is the points it added to the 100-point composite (weight × sub-score).
- Cash flow +30.0/30.0
- DSCR +10.0/10.0
- 1% rule +8.6/10.0
- ARV discount +7.5/15.0
- Schools +5.2/10.0
- Condition / age +5.0/5.0
- Livability +3.2/5.0
- Rent growth +2.5/5.0
- Appreciation +0.0/10.0
$109,770
🖨 Deal sheet 📄 Offer letter ✓ Due diligence
Listing remarks
Don't miss out on this brand new 3 bedroom 2 bath home built for comfort, convenience and modern living. Open concept living space. Beautiful kitchen with an island and pantry storage. Spacious master suite with stand up shower. Energy-efficient and low maintenace.
Key facts
- Beautiful kitchen
- Pantry storage
- Stand up shower
Tags
Property features AI
Finance
- Financial info: List price $109,770
Exterior
- Utilities: Natural gas; Central air
- Home design: Plan home (Clayton 198 River Valley Estates)
- Construction: Living area 1216 (listed)
- Exterior features: Shake roof
Interior
- Bedrooms: 3 bedrooms
- Bathrooms: 2 full bathrooms
- Heating & cooling: Natural gas heating; Central air conditioning
- Interior features: Active status listing (Plan: Clayton 198 River Valley Estates)
Neighborhood map
What this means for you Summary
Snapshot
- This is a 3-bed/2.0-bath manufactured listed at $110k. Condition is rated excellent.
Deal economics
- At list price, monthly cash flow is $422 ($5k/yr) — positive.
- The deal already cash-flows at list — no discount required.
- Meets the 1% rule at list price ($1k rent vs $110k).
- Recommended offer: $108k (1.5% below list) — sets the bar for market timing.
- Cap rate 10.9% vs local median 6.9% in Marion — top-decile yield for the area; either an underpriced asset or a hidden risk that comps aren't pricing in. Stress-test before assuming the spread holds.
Location & tenants
- Location reads 65/100 on livability (#704 in OH) — a middle-class / working-renter tenant base. Strengths: cost of living A+, housing A+; Watch: schools D+, crime D+, amenities F.
- River Valley Local (rural): math 60% / reading 62% proficiency, ranked #264 of 656 in OH (top 40%) — acceptable for families but not a draw, mixed tenant base, ~2y average lease.
- Market conditions: 210 active listings in the ZIP; 53 units permitted in Marion County in 2024 (0 in 5+ unit buildings).
- This rent runs 33% of the median local income ($55k/yr) — at the standard rent-burdened threshold; future hikes will face affordability resistance.
Forward outlook
- Local home prices are declining (-3.0%/yr); year-one equity from $758 of loan paydown is wiped out by about $3k of value loss. Plan a longer hold.
- Marion County population projected at -18% by 2050 — secular population decline; favor cash flow + early exit over multi-decade hold.
- At projected returns (-3.0% appreciation + 3.0% rent growth), your $31k cash investment doubles in ~8 years — after that, you're playing with house money.
Negotiation context
- It's been on market 21 days — a 2% lower offer ($108k) is reasonable based on typical stale-listing flexibility.
Questions for the listing agent
- Is there a deadline driving the sale (1031 exchange, divorce, estate, relocation)? That informs how much negotiation room exists.
- Schools are D-rated, which usually means shorter tenancies and higher turnover. Who's the typical renter profile here, and what's been the actual vacancy rate?
- Crime grade is D in this area — have there been break-ins, vandalism, or insurance claims at this property in the last 3 years? What carrier currently insures it and at what premium?
- What's the average days-on-market for RENTAL listings here right now (not sales)? A rising rental-DOM trend means longer vacancies and softer asking-rent achievability than the comps imply.
- What's the recent tenant-quality profile in this submarket — average credit score on applications, eviction rate, late-payment / NSF rate, and stable-employment percentage? A property-management company in the area should have these aggregated.
- How much new for-sale + rental construction is in the pipeline within 1–3 miles? Heavy new supply typically softens prices + rents 12–24 months out; constrained supply supports both.
Investment metrics
- 1% rule
- 1.36% ✓
- Cap rate
- 10.91%
- Cash-on-cash
- 16.48%
- DSCR
- 1.73
- GRM
- 6.1
CMA / ARV
No comps found within radius.
Projected returns pro-forma
-3.0% appreciation · 3.0% rent growth · sell at horizon
- IRR
- 7.6%
- Equity multiple
- 1.30×
- Total profit
- $9,113
- Equity at exit
- $16,367
- IRR
- 16.9%
- Equity multiple
- 2.39×
- Total profit
- $42,636
- Equity at exit
- $9,491
Cash invested: $30,736 (down + closing). Projections, not guarantees.
Landlord ↔ Tenant lean methodology
- Overall (STATE)
- 73 Landlord-Friendly
- State Ohio
- 73 Landlord-Friendly · R+6
- County
- — inherits STATE
- City
- — inherits STATE
ZIP-level market 43302
- Home prices YoY
- -33.9%
- Active inventory
- 210
- Price-to-rent
- 6.1×
Monthly cashflow live
- Estimated rent
- $1,494 medium interval (Pro) →
- Mortgage (P&I)
- −$576
- Tax est. 1.5%
- −$137 /mo · $1,647/yr
- Insurance
- −$46
- HOA
- −$0
- Vacancy / Maint / Mgmt
- −$314
- Net cashflow
- $422
Break-even live
UW: 25.0% down · 7.5% · 30yr · 1.5% tax · 5.0% vac · 8.0% maint · 8.0% mgmt
Financing live
Cash to close
- Down payment
- $27,442
- Closing costs
- $3,293
- Reserves months
- —
- Total cash needed
- —
Loan-product check · same deal, 3 products live
Conventional
25% down · 7.5% · 30yr
- Down + closing
- —
- Monthly P&I
- —
- Monthly cashflow
- —
- DSCR
- —
- Eligible?
- —
Personal DTI + credit; lowest rate.
DSCR
20% down · 8.5% · 30yr
- Down + closing
- —
- Monthly P&I
- —
- Monthly cashflow
- —
- DSCR
- —
- Eligible?
- —
No personal income docs; deal must DSCR.
Hard money
10% down · 12.0% · 12mo
- Down + closing
- —
- Monthly P&I
- —
- Monthly cashflow
- —
- DSCR
- —
- Eligible?
- —
Short-term bridge; refi at stabilization.
Listing history 14 events
-
2026-06-19days on market $109,770 Active 21 DOM
-
2026-06-18days on market $109,770 Active 20 DOM
-
2026-06-17days on market $109,770 Active 19 DOM
-
2026-06-16days on market $109,770 Active 18 DOM
-
2026-06-15days on market $109,770 Active 17 DOM
-
2026-06-14days on market $109,770 Active 15 DOM
-
2026-06-12days on market $109,770 Active 14 DOM
-
2026-06-09days on market $109,770 Active 11 DOM
-
2026-06-08days on market $109,770 Active 10 DOM
-
2026-06-07days on market $109,770 Active 9 DOM
-
2026-06-03days on market $109,770 Active 5 DOM
-
2026-06-02days on market $109,770 Active 4 DOM
-
2026-06-01days on market $109,770 Active 3 DOM
-
2026-05-31days on market $109,770 Active 2 DOM
ⓘ Source: listings_history table (triggers on properties + properties_extension) + one-shot
backfill from property_details.listing_events for pre-trigger history.
Climate risk First Street
- Flood 1/10 Low FEMA zone X (unshaded) · 0% chance over 30 yrs
- Wildfire 1/10 Low
- Heat 3/10 Moderate 7 d/yr ≥98°F today · 17 d/yr by 30 yrs out
- Wind 2/10 Low
- Air quality 2/10 Low 1 unhealthy d/yr today · 1 by 30 yrs out
Nearby sold comps map
Loading sold comps map…
Walkable amenities ~0.75 mi
Loading nearby amenities…
Taxation est. · year 1
- Rental income
- $17,933
- − Mortgage interest
- −$6,149
- − Property taxes
- −$1,647
- − Insurance
- −$549
- − Repairs & maintenance
- −$1,435
- − Management
- −$1,435
- − Depreciation
- −$3,193
- Taxable income
- $3,526
- Est. tax owed @ 24.0%
- −$846
- After-tax cash flow
- $4,218/yr
For passive investors: Depreciation is non-cash, so a rental often shows a tax loss while cash-flowing — sheltering income. Rental losses are passive: they offset passive income freely, and up to $25,000/yr can offset ordinary (W-2) income if you actively participate and your MAGI is under $100k (phasing out to $0 by $150k); unused losses carry forward. On sale, claimed depreciation is recaptured at up to 25%, and gains may owe capital-gains tax (a 1031 exchange can defer both). Figures are a year-1 estimate at your 24.0% rate — not tax advice; consult a CPA.
Condition & rehab AI · 4 photos
This brand new Clayton River Valley Estates home is move-in ready with excellent condition and modern features, offering a great value for both resale and rental markets.
Value-add opportunities
- Both Paint exterior siding — Enhances curb appeal and value.
- Both Replace window treatments — Freshens look and improves energy efficiency.
- Both Install smart home devices — Enhances convenience and marketability.
- Both Add outdoor lighting — Improves safety and curb appeal.
- Both Upgrade appliances — Modernizes kitchen and increases value.
- Both Add a small patio or deck — Increases outdoor living space and appeal.
Renovation cost estimate screening
Value-add ROI direction
- Both Paint exterior siding — Enhances curb appeal and value. ↑
- Both Replace window treatments — Freshens look and improves energy efficiency. ↑
- Both Install smart home devices — Enhances convenience and marketability. ↑
- Both Add outdoor lighting — Improves safety and curb appeal. ↑
- Both Upgrade appliances — Modernizes kitchen and increases value. ↑
- Both Add a small patio or deck — Increases outdoor living space and appeal. ↑
ⓘ Cost ranges are severity-bucket heuristics (US national rule-of-thumb). Get contractor quotes + a written scope before underwriting a rehab budget.
Schools (NCES district)
- District
- River Valley Local
- NCES district ID
- 3904844
- Math proficiency
- 60% ▼ -13.00%
- Reading proficiency
- 62% ▼ -9.00%
- Median HH income
- $55,645
- Composite
- 52.44/100
- National rank
- #1574
- State rank
- #264 of 656 in OH
Livability — Marion
- Score
- 65/100
- State rank
- #704
- US rank
- #12605
Category grades
Schools grade is shown separately in the Schools card above.
Census & demographics
- County
- Marion County · 53,702 people
- City population
- 53,702
- Metro
- Marion, OH
- Population (ZIP)
- 53,702
- Household income
- $55,057
- Rent vs Own
- Severe rent burden
- 1554.0
Population outlook (Marion County) Hauer SSP2
- Today (2025)
- 62,078 people
- By 2030
- 60,049 · -3.3%
- By 2040
- 55,413 · -10.7%
- By 2050
- 50,604 · -18.5%
- By 2075
- 40,162 · -35.3%
- By 2100
- 29,105 · -53.1%
Race, ethnicity, and origin ACS 2023
- Neighborhood character
- Predominantly White (85%)
- Race & ethnicity
- White 85% Black 6% Two or more races 6% Hispanic / Latino 3%
- Common ancestry
- Slovak 2% Romanian 2% Lithuanian 2%
- Foreign-born
- 2% · Canada
- Languages at home
- 96% English-only · Spanish 2% Arabic 1%
Political lean MEDSL · Marion
- 2024 margin
- Solid R (+41.4) · D 28.9% · R 70.3%
- 2008→2024 swing
- -32.5pp toward R · 2008: -8.9pp · 2024: -41.4pp
- All cycles
- 2024: R+41.4 2020: R+38.6 2016: R+34.4 2012: R+7.6 2008: R+8.9
Not yet ingested
- Civics
- —
Market trends
- HPI YoY
- ▼ -114.52%
- Current HPI
- 223.5344
- Rent YoY
- —
- Metro
- Marion, OH
- State GDP YoY
- ▲ 1.98%
- F500 in state
- 48
Industry mix (Fortune 500 HQ in OH)
| Industry | F500 HQs | Revenue |
|---|---|---|
| Insurance | 3 | $145B |
|
||
| Industrial Machinery | 3 | $49B |
|
||
| Financial Services | 3 | $24B |
|
||
| Consumer Goods | 2 | $93B |
|
||
| Aerospace / Defense | 2 | $47B |
|
||
| Utilities | 2 | $33B |
|
||
Cash-flow waterfall
monthlySold comps — $/sqft
last 12 mo · ≤1 miLoading sold comps…