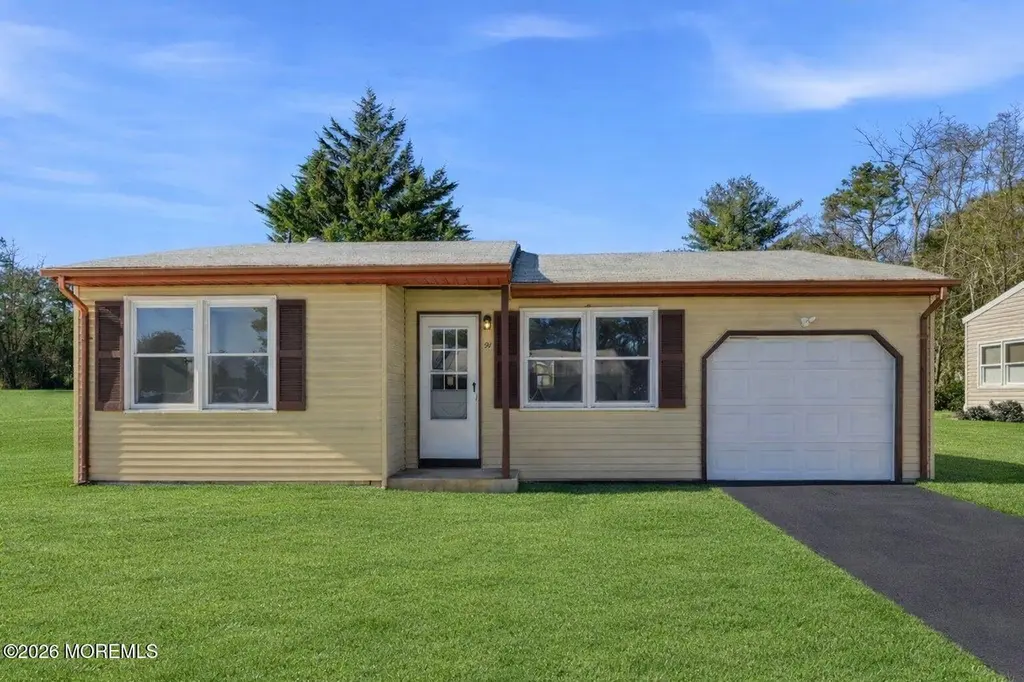
91 Westport Dr #71 · Crestwood Village, NJ
Flood risk 1/10 · Minimal
- FEMA flood zone
- X (unshaded)
- Chance of flooding over 30 yrs
- 0.0%
- Est. flood insurance / yr
- $507 – $1,088
Fire risk 6/10 · Moderate
- Est. fire insurance / yr
- $526 – $976
Heat risk 6/10 · Moderate
- Hot days now (above 103°F)
- 7 days/yr
- Hot days in 30 yrs
- 14 days/yr
Wind risk 6/10 · Moderate
- Chance of severe wind over 30 yrs
- 63.0%
Air-quality risk 4/10 · Minor
- Unhealthy air days now
- 4 days/yr
- Unhealthy air days in 30 yrs
- 5 days/yr
Risk factors via First Street. Map © Google.
Why this score? — see what drove the D grade
The composite is a weighted blend of 9 inputs, each scored 0–100. Each bar is that input's sub-score; the figure is the points it added to the 100-point composite (weight × sub-score).
- Cash flow +13.4/30.0
- ARV discount +8.2/15.0
- 1% rule +4.3/10.0
- DSCR +4.0/10.0
- Livability +3.2/5.0
- Schools +2.9/10.0
- Rent growth +2.5/5.0
- Condition / age +2.5/5.0
- Appreciation +0.0/10.0
$234,900
🖨 Deal sheet 📄 Offer letter ✓ Due diligence
Listing remarks MLS
Welcome to your beautifully updated Andover model, thoughtfully and lightly renovated throughout. This home features brand-new luxury vinyl flooring, modern recessed lighting, and a tastefully updated bathroom complete with a sleek walk-in shower. Offering a fresh, move-in-ready feel while maintaining comfort and charm, this home is perfect for its next homeowner seeking style and convenience.
Key facts
- Walk-in shower
- Updated bathroom
- 6,098 sq ft lot
Tags
Neighborhood map
What this means for you Summary
Snapshot
- This is a 2-bed/1.0-bath single-family listed at $235k.
Deal economics
- At list price, monthly cash flow is $4 ($49/yr) — positive.
- The deal already cash-flows at list — no discount required.
- To meet the 1% rule (rent ≥ 1% of price), the offer needs to be $219k (6.9% below list).
- Recommended offer: $219k (6.9% below list) — sets the bar for 1% rule.
Location & tenants
- Location reads 63/100 on livability (#422 in NJ) — a middle-class / working-renter tenant base. Strengths: cost of living A, housing A, health & safety B+; Watch: schools F, amenities F, commute F.
- Manchester Township School District (suburban): math 25% / reading 44% proficiency, ranked #320 of 472 in NJ (top 68%) — families likely to look elsewhere, expect single-tenant / working-renter base with shorter leases.
- Market conditions: 648 active listings in the ZIP; 3 comparable units currently listed for rent nearby; rentals at typical pace (median 17d on market — plan ~3-4 weeks tenant-placement turnaround); 4,434 units permitted in Ocean County in 2024 (868 in 5+ unit buildings).
Forward outlook
- Local home prices are declining (-3.0%/yr); year-one equity from $2k of loan paydown is wiped out by about $7k of value loss. Plan a longer hold.
- Ocean County population projected to shrink 8% by 2050 — rents likely to lag national; underwrite the cash flow, not the appreciation.
Negotiation context
- It's been on market 83 days — a 6% lower offer ($221k) is reasonable based on typical stale-listing flexibility.
- 2 sale attempts with the ask held roughly flat each time — persistent listings suggest the price (not the market) is what's stuck; bring a comps-based counter.
- Current owner paid $110k; list at $235k implies a 114% gain — meaningful room to come down on a strong offer.
Risks & watch-outs
- Climate carrying-cost: major wind risk, 63% chance of damaging wind over 30y; major wildfire risk; extreme-heat days projected 7→14/yr by 2055 (HVAC capex compounding) — expect insurance premiums to compound above CPI over the hold.
Questions for the listing agent
- It's been on market 83 days. Have you received any prior offers? Is the seller open to a 7% concession, seller financing, or rate buy-down credit?
- Built in 1978 — when were the roof, HVAC, electrical panel, plumbing, and water heater last replaced?
- What does the HOA fee cover, when was the last increase, and are there any pending special assessments or reserve-fund shortfalls?
- Why hasn't it sold? Are there any deal-killer items the seller is aware of (foundation, flood, title, zoning, code violations)?
- Is there a deadline driving the sale (1031 exchange, divorce, estate, relocation)? That informs how much negotiation room exists.
- Schools are F-rated, which usually means shorter tenancies and higher turnover. Who's the typical renter profile here, and what's been the actual vacancy rate?
- The area grade is low — what's the realistic commute time and amenity access for the typical tenant pool here? Any planned neighborhood developments (good or bad) we should know about?
- What's the average days-on-market for RENTAL listings here right now (not sales)? A rising rental-DOM trend means longer vacancies and softer asking-rent achievability than the comps imply.
- What's the recent tenant-quality profile in this submarket — average credit score on applications, eviction rate, late-payment / NSF rate, and stable-employment percentage? A property-management company in the area should have these aggregated.
- How much new for-sale + rental construction is in the pipeline within 1–3 miles? Heavy new supply typically softens prices + rents 12–24 months out; constrained supply supports both.
Investment metrics
- 1% rule
- 0.93% ✗
- Cap rate
- 6.31%
- Cash-on-cash
- 0.07%
- DSCR
- 1.00
- GRM
- 9.0
CMA / ARV
- ARV (median comp)
- $238,506
- List price
- $234,900
- Delta
- -1.51%
- Verdict
- FAIR
- Comps
- 20 within 1.0 mi
Show comp detail 12 sales within ~0.75 mi
| Address | Dist | Beds/Ba | Sqft | Sold | Price | $/sf | Match |
|---|---|---|---|---|---|---|---|
| 13 Churchill Rd #71 | 0.14mi | 2/1.0 | 966 (0%) | 2mo | $189,000 | $196 | 92 |
| 53 Westport Dr | 0.14mi | 2/1.0 | 966 (0%) | 8mo | $204,000 | $211 | 87 |
| 24 Churchill Rd Sec 71 | 0.16mi | 2/1.0 | 966 (0%) | 7mo | $256,000 | $265 | 87 |
| 38 Chelsea Dr #70 | 0.38mi | 2/1.0 | 966 (0%) | 8mo | $232,000 | $240 | 75 |
| 55 Westport Dr #71 | 0.13mi | 2/1.0 | 858 (-11%) | 0mo | $170,000 | $198 | 75 |
| 43 S Chestnut Ave #72 | 0.54mi | 2/1.0 | 966 (0%) | 6mo | $235,000 | $243 | 70 |
| 8 Westport Dr Sec 71 Dr | 0.26mi | 2/1.0 | 858 (-11%) | 7mo | $230,000 | $268 | 64 |
| 8 Westport Dr #71 | 0.26mi | 2/1.0 | 858 (-11%) | 7mo | $230,000 | $268 | 64 |
| 46 Franklin Ln Unit 46A | 0.31mi | 2/2.0 | 1,076 (+11%) | 7mo | $170,000 | $158 | 57 |
| 250 Columbine Ct Unit B | 0.67mi | 1/1.0 (-1) | 1,001 (+4%) | 6mo | $110,000 | $110 | 53 |
| 4 Bunker Hill Dr Unit A | 0.69mi | 2/1.5 | 1,002 (+4%) | 10mo | $120,000 | $120 | 52 |
| 9 Apple Ln | 0.56mi | 2/1.5 | 1,072 (+11%) | 5mo | $222,000 | $207 | 50 |
Match score weights: distance 35% · size 25% · config 20% · recency 20%. Top-matched comps best support the ARV.
Projected returns pro-forma
-3.0% appreciation · 3.0% rent growth · sell at horizon
- IRR
- -16.1%
- Equity multiple
- 0.43×
- Total profit
- $-37,709
- Equity at exit
- $35,024
- IRR
- -7.7%
- Equity multiple
- 0.51×
- Total profit
- $-32,119
- Equity at exit
- $20,310
Cash invested: $65,772 (down + closing). Projections, not guarantees.
Landlord ↔ Tenant lean methodology
- Overall (STATE)
- 21 Tenant-Leaning
- State New Jersey
- 21 Tenant-Leaning · D+6
- County
- — inherits STATE
- City
- — inherits STATE
ZIP-level market 08759
- Active inventory
- 648
- Price-to-rent
- 9.0×
Monthly cashflow live
- Estimated rent
- $2,186 medium interval (Pro) →
- Mortgage (P&I)
- −$1,232
- Tax from tax record
- −$223 /mo · $2,679/yr
- Insurance
- −$98
- HOA
- −$170
- Vacancy / Maint / Mgmt
- −$459
- Net cashflow
- $4
Break-even live
UW: 25.0% down · 7.5% · 30yr · 1.5% tax · 5.0% vac · 8.0% maint · 8.0% mgmt
Financing live
Cash to close
- Down payment
- $58,725
- Closing costs
- $7,047
- Reserves months
- —
- Total cash needed
- —
Loan-product check · same deal, 3 products live
Conventional
25% down · 7.5% · 30yr
- Down + closing
- —
- Monthly P&I
- —
- Monthly cashflow
- —
- DSCR
- —
- Eligible?
- —
Personal DTI + credit; lowest rate.
DSCR
20% down · 8.5% · 30yr
- Down + closing
- —
- Monthly P&I
- —
- Monthly cashflow
- —
- DSCR
- —
- Eligible?
- —
No personal income docs; deal must DSCR.
Hard money
10% down · 12.0% · 12mo
- Down + closing
- —
- Monthly P&I
- —
- Monthly cashflow
- —
- DSCR
- —
- Eligible?
- —
Short-term bridge; refi at stabilization.
Rent comps 3 comps
| Address | Beds | Baths | Sqft | Rent | $/sqft | DOM | Units | Dist |
|---|---|---|---|---|---|---|---|---|
| 50 Westport Dr #71 Whiting, NJ | 2.0 | 1.0 | 1120 | $2,200 | $1.96 | 1d | 1 | 0.10mi |
| 19B Maplewood Dr #52 Whiting, NJ | 2.0 | 1.5 | 1109 | $2,250 | $2.03 | 16d | 1 | 1.46mi |
| 9A Juniper Ln Unit 50 Whiting, NJ | 1.0 | 1.0 | 1009 | $1,950 | $1.93 | 43d | 1 | 1.47mi |
HOA detail
- Monthly dues
- $170 · $2,040/yr
Listing history 20 events
-
2026-06-18days on market $234,900 Active 83 DOM
-
2026-06-17days on market $234,900 Active 82 DOM
-
2026-06-16days on market $234,900 Active 81 DOM
-
2026-06-15days on market $234,900 Active 80 DOM
-
2026-06-13days on market $234,900 Active 78 DOM
-
2026-06-09days on market $234,900 Active 74 DOM
-
2026-06-08days on market $234,900 Active 73 DOM
-
2026-06-07remarks 605-char remark
-
2026-06-07days on market $234,900 Active 72 DOM
-
2026-06-04days on market $234,900 Active 69 DOM
-
2026-06-03days on market $234,900 Active 68 DOM
-
2026-06-02days on market $234,900 Active 67 DOM
-
2026-06-01days on market $234,900 Active 66 DOM
-
2026-05-31days on market $234,900 Active 65 DOM
-
2026-03-27$234,900 Active 396-char remark
Show marketing remark (396 chars)
Welcome to your beautifully updated Andover model, thoughtfully and lightly renovated throughout. This home features brand-new luxury vinyl flooring, modern recessed lighting, and a tastefully updated bathroom complete with a sleek walk-in shower. Offering a fresh, move-in-ready feel while maintaining comfort and charm, this home is perfect for its next homeowner seeking style and convenience.
-
2026-03-03historical $2,300
-
2026-02-18price $2,300
-
2026-02-07$2,400
-
2004-02-13soldstatus $110,000
-
1987-09-02soldstatus $75,000
ⓘ Source: listings_history table (triggers on properties + properties_extension) + one-shot
backfill from property_details.listing_events for pre-trigger history.
Tax reassessment forecast NJ · Partial reset (capped growth)
- Current annual tax
- $2,679 · $223/mo
- Projected year-2 tax
- $4,264 · $355/mo
- Expected delta
- +$1,585/yr (+$132/mo · 59.2%)
ⓘ Screening estimate from a state-policy table — verify with the county assessor before closing.
Climate risk First Street
- Flood 1/10 Low FEMA zone X (unshaded) · 0% chance over 30 yrs
- Wildfire 6/10 Major
- Heat 6/10 Major 7 d/yr ≥103°F today · 14 d/yr by 30 yrs out
- Wind 6/10 Major 63% chance of damaging wind over 30 yrs
- Air quality 4/10 Moderate 4 unhealthy d/yr today · 5 by 30 yrs out
Nearby sold comps map
Loading sold comps map…
Walkable amenities ~0.75 mi
Loading nearby amenities…
Taxation est. · year 1
- Rental income
- $26,233
- − Mortgage interest
- −$13,158
- − Property taxes
- −$2,679
- − Insurance
- −$1,174
- − Repairs & maintenance
- −$2,099
- − Management
- −$2,099
- − HOA
- −$2,040
- − Depreciation
- −$6,833
- Taxable loss
- −$3,849
- Est. tax savings @ 24.0%
- +$924
- After-tax cash flow
- $973/yr
For passive investors: Depreciation is non-cash, so a rental often shows a tax loss while cash-flowing — sheltering income. Rental losses are passive: they offset passive income freely, and up to $25,000/yr can offset ordinary (W-2) income if you actively participate and your MAGI is under $100k (phasing out to $0 by $150k); unused losses carry forward. On sale, claimed depreciation is recaptured at up to 25%, and gains may owe capital-gains tax (a 1031 exchange can defer both). Figures are a year-1 estimate at your 24.0% rate — not tax advice; consult a CPA.
Schools (NCES district)
- District
- Manchester Township School District
- NCES district ID
- 3409450
- Math proficiency
- 25% ▼ -17.00%
- Reading proficiency
- 44% ▼ -5.00%
- Median HH income
- $38,905
- Composite
- 28.8/100
- National rank
- #6662
- State rank
- #320 of 472 in NJ
Livability — Crestwood Village
- Score
- 63/100
- State rank
- #422
- US rank
- #15006
Category grades
Schools grade is shown separately in the Schools card above.
Census & demographics
- City population
- 34,290
- Population (ZIP)
- 34,290
Population outlook (Ocean County) Hauer SSP2
- Today (2025)
- 586,991 people
- By 2030
- 581,403 · -1.0%
- By 2040
- 564,913 · -3.8%
- By 2050
- 538,149 · -8.3%
- By 2075
- 468,845 · -20.1%
- By 2100
- 350,297 · -40.3%
Race, ethnicity, and origin ACS 2023
- Neighborhood character
- Predominantly White (87%)
- Race & ethnicity
- White 87% Hispanic / Latino 5% Black 4% Two or more races 4% Asian 2%
- Hispanic origin (detail)
- Puerto Rican 2%
- Common ancestry
- Romanian 8% Scotch-Irish 2% Lithuanian 2%
- Foreign-born
- 11% · Canada, China
- Languages at home
- 88% English-only · Spanish 3% Russian/Polish/Slavic 2% Other Indo-European 2%
Political lean MEDSL · Ocean
- 2024 margin
- Solid R (+36.0) · D 31.4% · R 67.4% · Other 1.2%
- 2008→2024 swing
- -17.6pp toward R · 2008: -18.4pp · 2024: -36.0pp
- All cycles
- 2024: R+36.0 2020: R+28.7 2016: R+34.0 2012: R+17.7 2008: R+18.4
Not yet ingested
- Civics
- —
Market trends
- HPI YoY
- ▼ -347.85%
- Current HPI
- 274.4679
- Rent YoY
- —
- Metro
- —
- State GDP YoY
- ▲ 2.05%
- F500 in state
- 34
Industry mix (Fortune 500 HQ in NJ)
| Industry | F500 HQs | Revenue |
|---|---|---|
| Consumer Goods | 3 | $31B |
|
||
| Pharmaceuticals | 2 | $153B |
|
||
| Technology | 2 | $21B |
|
||
| Insurance | 2 | $20B |
|
||
| Healthcare | 2 | $19B |
|
||
| Financial Services | 1 | $70B |
|
||
Price history
+213.2% since first listed6 events — show timeline
- 2026-03-27 Listed $234,900 MOMLS
- 2026-03-03 Rental Removed $2,300 MOMLS
- 2026-02-18 Price Changed $2,300 MOMLS
- 2026-02-07 Listed for Rent $2,400 MOMLS
- 2004-02-13 Sold (Public Records) $110,000 Public Records
- 1987-09-02 Sold (Public Records) $75,000 Public Records
Property tax history
+3.7%/yrLatest (2025): $2,679 · +24.0% YoY. Source: county tax records.
Cash-flow waterfall
monthlySold comps — $/sqft
last 12 mo · ≤1 miLoading sold comps…