1214 Lowery St · Bryan, TX
Flood risk No data
- FEMA flood zone
- —
- Chance of flooding over 30 yrs
- —
- Est. flood insurance / yr
- —
Fire risk No data
- Est. fire insurance / yr
- —
Heat risk No data
- Hot days now (above threshold)
- —
- Hot days in 30 yrs
- —
Wind risk No data
- Chance of severe wind over 30 yrs
- —
Air-quality risk No data
- Unhealthy air days now
- —
- Unhealthy air days in 30 yrs
- —
Risk factors via First Street. Map © Google.
Why this score? — see what drove the D grade
The composite is a weighted blend of 9 inputs, each scored 0–100. Each bar is that input's sub-score; the figure is the points it added to the 100-point composite (weight × sub-score).
- Cash flow +15.0/30.0
- ARV discount +7.5/15.0
- 1% rule +5.0/10.0
- DSCR +5.0/10.0
- Livability +3.8/5.0
- Rent growth +2.9/5.0
- Schools +2.6/10.0
- Condition / age +2.2/5.0
- Appreciation +0.0/10.0
$28,000
🖨 Deal sheet 📄 Offer letter ✓ Due diligence
Listing remarks MLS
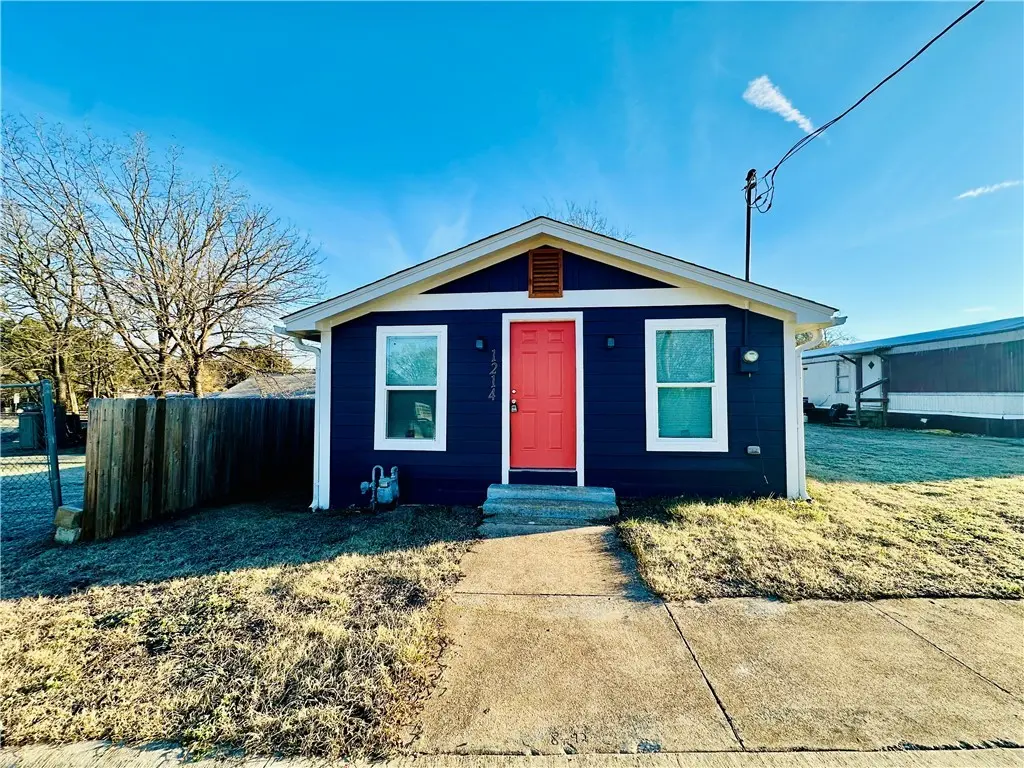
Located just minutes from Downtown Bryan, this lot is ready for a new beginning. Zoned RD-5, allowing for the construction of a single-family home within setbacks, as illustrated in the example photos. Buyer to perform their own due diligence to verify zoning, permitted uses, and building requirements.
Key facts
- Zoned rd-5
- 1,651 sq ft lot
- Built 1979
Tags
Neighborhood map
What this means for you Summary
Snapshot
- This is a 2-bed/2.0-bath single-family listed at $28k. Condition is rated fair.
Deal economics
- At list price, monthly cash flow is $804 ($10k/yr) — positive.
- The deal already cash-flows at list — no discount required.
- Meets the 1% rule at list price ($1k rent vs $28k).
- Recommended offer: $25k (12.0% below list) — sets the bar for market timing.
- Cap rate 40.7% vs local median 4.0% in Bryan — top-decile yield for the area; either an underpriced asset or a hidden risk that comps aren't pricing in. Stress-test before assuming the spread holds.
Location & tenants
- Location reads 76/100 on livability (#99 in TX, #3,341 nationally) — a middle-class / working-renter tenant base. Strengths: cost of living A+, housing A+, health & safety A+; Watch: schools C-, crime C-, amenities C-.
- Bryan ISD (urban): math 30% / reading 32% proficiency, ranked #608 of 826 in TX (top 74%) — families likely to look elsewhere, expect single-tenant / working-renter base with shorter leases; 68% free/reduced lunch — lower-income household profile, screen leases tightly.
- Market conditions: Rents rising (+1.4%/yr); 288 active listings in the ZIP; 15 comparable units currently listed for rent nearby; rentals lingering (median 44d on market — plan ~5-8 weeks vacancy on turnover, expect pricing pressure); 60% of comp listings sitting > 30 days — soft ceiling on asking rent; 2,211 units permitted in Brazos County in 2024 (768 in 5+ unit buildings).
Forward outlook
- Local home prices are declining (-3.0%/yr); year-one equity from $194 of loan paydown is wiped out by about $840 of value loss. Plan a longer hold.
- Brazos County population projected at +55% by 2050 — long-run rental-demand tailwind backs the buy-and-hold thesis.
- At projected returns (-3.0% appreciation + 1.4% rent growth), your $8k cash investment doubles in ~1 year — after that, you're playing with house money.
Negotiation context
- It's been on market 143 days — a 12% lower offer ($25k) is reasonable based on typical stale-listing flexibility.
Questions for the listing agent
- It's been on market 143 days. Have you received any prior offers? Is the seller open to a 12% concession, seller financing, or rate buy-down credit?
- Have any recent inspections been done? Can we get a copy of the seller's disclosures and any deferred-maintenance estimates?
- Built in 1979 — when were the roof, HVAC, electrical panel, plumbing, and water heater last replaced?
- Why hasn't it sold? Are there any deal-killer items the seller is aware of (foundation, flood, title, zoning, code violations)?
- Is there a deadline driving the sale (1031 exchange, divorce, estate, relocation)? That informs how much negotiation room exists.
- The area grade is low — what's the realistic commute time and amenity access for the typical tenant pool here? Any planned neighborhood developments (good or bad) we should know about?
- What's the average days-on-market for RENTAL listings here right now (not sales)? A rising rental-DOM trend means longer vacancies and softer asking-rent achievability than the comps imply.
- What's the recent tenant-quality profile in this submarket — average credit score on applications, eviction rate, late-payment / NSF rate, and stable-employment percentage? A property-management company in the area should have these aggregated.
- How much new for-sale + rental construction is in the pipeline within 1–3 miles? Heavy new supply typically softens prices + rents 12–24 months out; constrained supply supports both.
Investment metrics
- 1% rule
- 4.51% ✓
- Cap rate
- 40.74%
- Cash-on-cash
- 123.04%
- DSCR
- 6.47
- GRM
- 1.8
CMA / ARV
- ARV (median comp)
- $143,225
- List price
- $28,000
- Delta
- -80.45%
- Verdict
- UNDERPRICED
- Comps
- 9 within 1.0 mi
Show comp detail 2 sales within ~0.75 mi
| Address | Dist | Beds/Ba | Sqft | Sold | Price | $/sf | Match |
|---|---|---|---|---|---|---|---|
| 1113 Lowery St | 0.07mi | 3/2.0 (+1) | 940 (+7%) | 15mo | $185,000 | $197 | 68 |
| 1115 Lowery St | 0.06mi | 3/2.0 (+1) | 979 (+11%) | 14mo | $188,000 | $192 | 62 |
Match score weights: distance 35% · size 25% · config 20% · recency 20%. Top-matched comps best support the ARV.
Projected returns pro-forma
-3.0% appreciation · 1.43% rent growth · sell at horizon
- IRR
- —
- Equity multiple
- 6.70×
- Total profit
- $44,717
- Equity at exit
- $4,175
- IRR
- —
- Equity multiple
- 13.39×
- Total profit
- $97,135
- Equity at exit
- $2,421
Cash invested: $7,840 (down + closing). Projections, not guarantees.
Landlord ↔ Tenant lean methodology
- Overall (STATE)
- 87 Strongly Landlord-Friendly
- State Texas
- 87 Strongly Landlord-Friendly · R+5
- County
- — inherits STATE
- City
- — inherits STATE
ZIP-level market 77803
- Home prices YoY
- -30.1%
- Rents YoY
- 1.4%
- Active inventory
- 288
- Price-to-rent
- 1.8×
Monthly cashflow live
- Estimated rent
- $1,262 high interval (Pro) →
- Mortgage (P&I)
- −$147
- Tax est. 1.5%
- −$35 /mo · $420/yr
- Insurance
- −$12
- HOA
- −$0
- Vacancy / Maint / Mgmt
- −$265
- Net cashflow
- $804
Break-even live
UW: 25.0% down · 7.5% · 30yr · 1.5% tax · 5.0% vac · 8.0% maint · 8.0% mgmt
Financing live
Cash to close
- Down payment
- $7,000
- Closing costs
- $840
- Reserves months
- —
- Total cash needed
- —
Loan-product check · same deal, 3 products live
Conventional
25% down · 7.5% · 30yr
- Down + closing
- —
- Monthly P&I
- —
- Monthly cashflow
- —
- DSCR
- —
- Eligible?
- —
Personal DTI + credit; lowest rate.
DSCR
20% down · 8.5% · 30yr
- Down + closing
- —
- Monthly P&I
- —
- Monthly cashflow
- —
- DSCR
- —
- Eligible?
- —
No personal income docs; deal must DSCR.
Hard money
10% down · 12.0% · 12mo
- Down + closing
- —
- Monthly P&I
- —
- Monthly cashflow
- —
- DSCR
- —
- Eligible?
- —
Short-term bridge; refi at stabilization.
Rent comps 15 comps
| Address | Beds | Baths | Sqft | Rent | $/sqft | DOM | Units | Dist |
|---|---|---|---|---|---|---|---|---|
| 306 W 23rd St Bryan, TX | 3.0 | 1.0 | 999 | $1,500 | $1.50 | 43d | 1 | 0.77mi |
| 501 N Main St Unit 407 Bryan, TX | 1.0 | 1.0 | 707 | $1,300 | $1.84 | 13d | 1 | 0.85mi |
| 501 N Main St Unit 409 Bryan, TX | 1.0 | 1.0 | 721 | $1,350 | $1.87 | 43d | 1 | 0.85mi |
| 501 N Main St Unit 203 Bryan, TX | 1.0 | 1.0 | 708 | $1,300 | $1.84 | 43d | 1 | 0.85mi |
| 401 N Main St Unit 306 Bryan, TX | 1.0 | 1.0 | 640 | $1,000 | $1.56 | 43d | 1 | 0.89mi |
| 206 N Main St Bryan, TX | 1.0 | 1.0 | 597 | $1,125 | $1.88 | 21d | 1 | 0.95mi |
| 207 N Preston Ave Bryan, TX | 2.0 | 2.0 | 1100 | $1,650 | $1.50 | 21d | 1 | 1.21mi |
| 603 S Sims Ave Unit 113 Bryan, TX | 1.0 | 1.0 | 650 | $1,250 | $1.92 | 43d | 1 | 1.24mi |
| 400 Robertson St Bryan, TX | 1.0 | 1.0 | 576 | $725 | $1.26 | 43d | 1 | 1.30mi |
| 700 S Sims Ave Bryan, TX | 2.0 | 1.0 | 918 | $1,150 | $1.25 | 21d | 1 | 1.30mi |
| 101 W 33rd St Unit 103 Bryan, TX | 1.0 | 1.0 | 615 | $1,250 | $2.03 | 21d | 1 | 1.41mi |
| 1014 E 23rd St Bryan, TX | 1.0 | 1.0 | 700 | $850 | $1.21 | 43d | 1 | 1.45mi |
| 514 E 30th St Unit B1 Bryan, TX | 2.0 | 1.5 | 879 | $875 | $1.00 | 44d | 1 | 1.46mi |
| 1300 Baker Ave Bryan, TX | 2.0 | 1.0 | 850 | $970 | $1.14 | 13d | 1 | 1.47mi |
| 1112 Baker Ave Bryan, TX | 3.0 | 1.0 | 900 | $1,695 | $1.88 | 43d | 1 | 1.50mi |
Listing history 17 events
-
2026-06-18days on market $28,000 Active 143 DOM
-
2026-06-17days on market $28,000 Active 142 DOM
-
2026-06-16days on market $28,000 Active 141 DOM
-
2026-06-15days on market $28,000 Active 140 DOM
-
2026-06-14days on market $28,000 Active 138 DOM
-
2026-06-13days on market $28,000 Active 137 DOM
-
2026-06-10days on market $28,000 Active 135 DOM
-
2026-06-09days on market $28,000 Active 134 DOM
-
2026-06-08days on market $28,000 Active 133 DOM
-
2026-06-07days on market $28,000 Active 132 DOM
-
2026-06-03days on market $28,000 Active 128 DOM
-
2026-06-02days on market $28,000 Active 127 DOM
-
2026-06-01days on market $28,000 Active 126 DOM
-
2026-05-31days on market $28,000 Active 125 DOM
-
2026-05-30days on market $28,000 Active 124 DOM
-
2026-04-08price $28,000 303-char remark
Show marketing remark (303 chars)
Located just minutes from Downtown Bryan, this lot is ready for a new beginning. Zoned RD-5, allowing for the construction of a single-family home within setbacks, as illustrated in the example photos. Buyer to perform their own due diligence to verify zoning, permitted uses, and building requirements.
-
2026-01-27$32,000 Active 303-char remark
Show marketing remark (303 chars)
Located just minutes from Downtown Bryan, this lot is ready for a new beginning. Zoned RD-5, allowing for the construction of a single-family home within setbacks, as illustrated in the example photos. Buyer to perform their own due diligence to verify zoning, permitted uses, and building requirements.
ⓘ Source: listings_history table (triggers on properties + properties_extension) + one-shot
backfill from property_details.listing_events for pre-trigger history.
Nearby sold comps map
Loading sold comps map…
Walkable amenities ~0.75 mi
Loading nearby amenities…
Taxation est. · year 1
- Rental income
- $15,150
- − Mortgage interest
- −$1,568
- − Property taxes
- −$420
- − Insurance
- −$140
- − Repairs & maintenance
- −$1,212
- − Management
- −$1,212
- − Depreciation
- −$815
- Taxable income
- $9,783
- Est. tax owed @ 24.0%
- −$2,348
- After-tax cash flow
- $7,298/yr
For passive investors: Depreciation is non-cash, so a rental often shows a tax loss while cash-flowing — sheltering income. Rental losses are passive: they offset passive income freely, and up to $25,000/yr can offset ordinary (W-2) income if you actively participate and your MAGI is under $100k (phasing out to $0 by $150k); unused losses carry forward. On sale, claimed depreciation is recaptured at up to 25%, and gains may owe capital-gains tax (a 1031 exchange can defer both). Figures are a year-1 estimate at your 24.0% rate — not tax advice; consult a CPA.
Condition & rehab AI · 6 photos
This property requires moderate renovations to improve its curb appeal and increase its value. Exterior repairs and updates are necessary to enhance its overall condition.
Repairs flagged
- Major exterior siding — Severe weathering
- Major exterior paint — Peeling paint
- Major flooring — Dirtied and worn
Value-add opportunities
- Both paint exterior — Enhances curb appeal and value
- Both replace flooring — Improves living space and value
- Both repair and paint exterior siding — Restores home's appearance and value
Renovation cost estimate screening
| Repair item | Severity | Est. cost |
|---|---|---|
| exterior siding · Severe weathering | Major | $15,000–50,000 |
| exterior paint · Peeling paint | Major | $15,000–50,000 |
| flooring · Dirtied and worn | Major | $15,000–50,000 |
| Total estimated repair cost · 3 items | $45,000–150,000 |
Value-add ROI direction
- Both paint exterior — Enhances curb appeal and value ↑
- Both replace flooring — Improves living space and value ↑
- Both repair and paint exterior siding — Restores home's appearance and value ↑
ⓘ Cost ranges are severity-bucket heuristics (US national rule-of-thumb). Get contractor quotes + a written scope before underwriting a rehab budget.
Schools (NCES district)
- District
- Bryan ISD
- NCES district ID
- 4811790
- Math proficiency
- 30% ▼ -8.00%
- Reading proficiency
- 32% ▼ -3.00%
- Median HH income
- $41,895
- Composite
- 26.26/100
- National rank
- #7253
- State rank
- #608 of 826 in TX
Livability — Bryan
- Score
- 76/100
- State rank
- #99
- US rank
- #3341
Category grades
Schools grade is shown separately in the Schools card above.
Census & demographics
- Census place
- Bryan, TX
- County
- Brazos County · 233,400 people
- City population
- 101,772
- Metro
- College Station-Bryan, TX
- Population (ZIP)
- 31,525
- Household income
- $52,274
- Rent vs Own
- Severe rent burden
- 1094.0
Population outlook (Brazos County) Hauer SSP2
- Today (2025)
- 267,942 people
- By 2030
- 296,630 · +10.7%
- By 2040
- 354,560 · +32.3%
- By 2050
- 414,616 · +54.7%
- By 2075
- 562,158 · +109.8%
- By 2100
- 678,828 · +153.3%
Race, ethnicity, and origin ACS 2023
- Neighborhood character
- Diverse neighborhood (Simpson 0.56)
- Race & ethnicity
- Hispanic / Latino 61% Black 21% Two or more races 18% White 17%
- Hispanic origin (detail)
- Mexican 56%
- Common ancestry
- Lithuanian 1% Romanian 1% Slovak 1%
- Foreign-born
- 21% · Canada, Jamaica, Dominican Republic
- Languages at home
- 52% English-only · Spanish 47%
Political lean MEDSL · Brazos
- 2024 margin
- Strong R (+24.9) · D 36.9% · R 61.7% · Other 1.4%
- 2008→2024 swing
- +4.1pp toward D · 2008: -28.9pp · 2024: -24.9pp
- All cycles
- 2024: R+24.9 2020: R+14.3 2016: R+23.7 2012: R+35.3 2008: R+28.9
Not yet ingested
- Civics
- —
Market trends
- HPI YoY
- ▼ -110.84%
- Current HPI
- 257.2885
- Rent YoY
- ▲ 1.43%
- Metro
- College Station-Bryan, TX
- State GDP YoY
- ▲ 3.95%
- F500 in state
- 110
Industry mix (Fortune 500 HQ in TX)
| Industry | F500 HQs | Revenue |
|---|---|---|
| Energy | 16 | $1,198B |
|
||
| Technology | 5 | $198B |
|
||
| Engineering / Construction | 4 | $72B |
|
||
| Energy Services | 3 | $60B |
|
||
| Utilities | 3 | $41B |
|
||
| Healthcare | 2 | $330B |
|
||
Price history
-12.5% since first listed2 events — show timeline
- 2026-04-08 Price Changed $28,000 BCSRMLS
- 2026-01-27 Listed $32,000 BCSRMLS
Cash-flow waterfall
monthlySold comps — $/sqft
last 12 mo · ≤1 miLoading sold comps…