1208 S Buckley Ave · Tyler, TX
Flood risk 1/10 · Minimal
- FEMA flood zone
- X (unshaded)
- Chance of flooding over 30 yrs
- 0.0%
- Est. flood insurance / yr
- $507 – $1,088
Fire risk 3/10 · Minor
- Est. fire insurance / yr
- $1,222 – $2,270
Heat risk 6/10 · Moderate
- Hot days now (above 109°F)
- 7 days/yr
- Hot days in 30 yrs
- 26 days/yr
Wind risk 6/10 · Moderate
- Chance of severe wind over 30 yrs
- 59.0%
Air-quality risk 2/10 · Minimal
- Unhealthy air days now
- 0 days/yr
- Unhealthy air days in 30 yrs
- 1 days/yr
Risk factors via First Street. Map © Google.
Why this score? — see what drove the B- grade
The composite is a weighted blend of 9 inputs, each scored 0–100. Each bar is that input's sub-score; the figure is the points it added to the 100-point composite (weight × sub-score).
- Cash flow +29.3/30.0
- DSCR +10.0/10.0
- 1% rule +9.1/10.0
- ARV discount +7.5/15.0
- Livability +3.8/5.0
- Rent growth +3.4/5.0
- Schools +3.3/10.0
- Condition / age +2.5/5.0
- Appreciation +0.0/10.0
$147,500
🖨 Deal sheet 📄 Offer letter ✓ Due diligence
Listing remarks
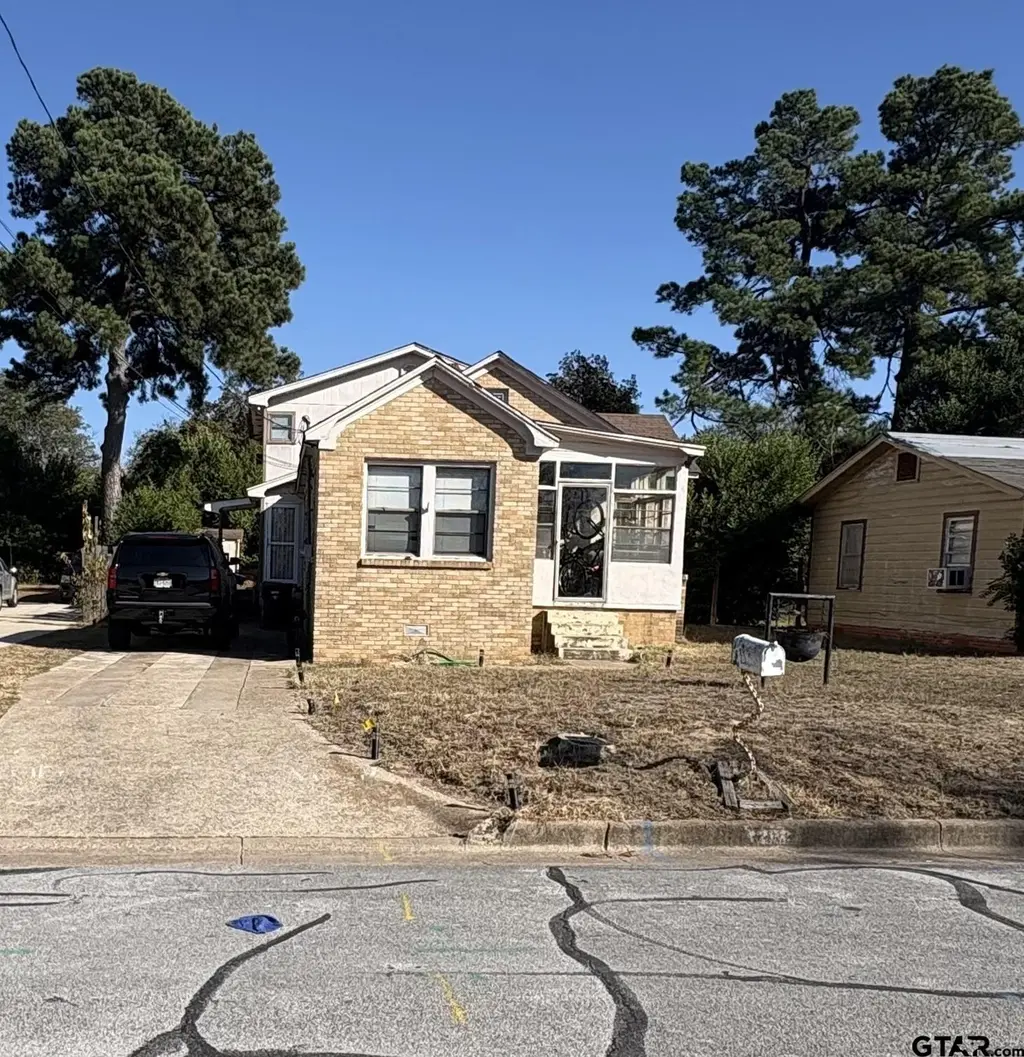
Investor Special! This spacious 5-bedroom, 2.5-bath, two-story home is packed with potential and ready for the right vision. Whether you’re looking to add to your rental portfolio, complete your next fix-and-flip project, or create the perfect family home, this property offers endless opportunities. Featuring a generous layout with ample living space, this home has the bones and square footage investors and savvy buyers are searching for. With some TLC and updates, this property could truly shine. Conveniently located and priced with repairs in mind, this is your chance to transform a diamond in the rough into something special. Sold as-is. Bring your ideas and make it your next succe
Key facts
- Built 1940
- Listed 26 days
Property features AI
Finance
- Other: Subdivision: HERNDONS 2ND
- Financial info: Annual tax: $1,998
Exterior
- Home design: Single-family detached residence; 2-story
- Construction: Brick and wood siding construction
- Exterior features: Deck; Screened porch; Wood fencing; Composition roof
Interior
- Kitchen: Refrigerator; Gas cooktop
- Bathrooms: 2 full bathrooms; 1 half bathroom
- Heating & cooling: Central heating (natural gas); Ceiling fans; Window air conditioning units
- Interior features: Refrigerator; Gas cooktop
Neighborhood map
What this means for you Summary
Snapshot
- This is a 5-bed/2.0-bath single-family listed at $148k.
Deal economics
- At list price, monthly cash flow is $517 ($6k/yr) — positive.
- The deal already cash-flows at list — no discount required.
- Meets the 1% rule at list price ($2k rent vs $148k).
- Recommended offer: $145k (1.5% below list) — sets the bar for market timing.
- Cap rate 10.5% vs local median 3.6% in Tyler — top-decile yield for the area; either an underpriced asset or a hidden risk that comps aren't pricing in. Stress-test before assuming the spread holds.
Location & tenants
- Location reads 75/100 on livability (#147 in TX, #4,181 nationally) — a middle-class / working-renter tenant base. Strengths: cost of living A+, housing A+, health & safety A+; Watch: employment C-, crime D+, commute F.
- Tyler ISD (urban): math 39% / reading 38% proficiency, ranked #449 of 826 in TX (top 54%) — families likely to look elsewhere, expect single-tenant / working-renter base with shorter leases; 66% free/reduced lunch — lower-income household profile, screen leases tightly.
- Zoned schools: Peete El (math 22% / reading 17%, grade F, #3,583 of 4,322 statewide, top 86%, 414 students, 98% FRL); Three Lakes Middle (math 35% / reading 42%, grade F, #704 of 1,662 statewide, top 43%, 873 students, 64% FRL); Tyler Legacy H S (math 34% / reading 49%, grade F, #767 of 1,632 statewide, top 47%, 2,594 students, 58% FRL).
- Market conditions: Rents rising (+3.7%/yr); 327 active listings in the ZIP; 1 comparable units currently listed for rent nearby; 595 units permitted in Smith County in 2024 (45 in 5+ unit buildings).
- This rent runs 38% of the median local income ($66k/yr) — at the standard rent-burdened threshold; future hikes will face affordability resistance.
Forward outlook
- Local home prices are declining (-3.0%/yr); year-one equity from $1k of loan paydown is wiped out by about $4k of value loss. Plan a longer hold.
- Smith County population projected at +24% by 2050 — long-run rental-demand tailwind backs the buy-and-hold thesis.
- At projected returns (-3.0% appreciation + 3.7% rent growth), your $41k cash investment doubles in ~8 years — after that, you're playing with house money.
Negotiation context
- It's been on market 27 days — a 2% lower offer ($145k) is reasonable based on typical stale-listing flexibility.
Risks & watch-outs
- Watch-outs: built in 1940 — expect roof / HVAC / electrical / plumbing capex.
- Climate carrying-cost: major wind risk, 59% chance of damaging wind over 30y; extreme-heat days projected 7→26/yr by 2055 (HVAC capex compounding) — expect insurance premiums to compound above CPI over the hold.
Questions for the listing agent
- Built in 1940 — when were the roof, HVAC, electrical panel, plumbing, and water heater last replaced?
- Is there a deadline driving the sale (1031 exchange, divorce, estate, relocation)? That informs how much negotiation room exists.
- Schools are D-rated, which usually means shorter tenancies and higher turnover. Who's the typical renter profile here, and what's been the actual vacancy rate?
- Crime grade is D in this area — have there been break-ins, vandalism, or insurance claims at this property in the last 3 years? What carrier currently insures it and at what premium?
- What's the average days-on-market for RENTAL listings here right now (not sales)? A rising rental-DOM trend means longer vacancies and softer asking-rent achievability than the comps imply.
- What's the recent tenant-quality profile in this submarket — average credit score on applications, eviction rate, late-payment / NSF rate, and stable-employment percentage? A property-management company in the area should have these aggregated.
- How much new for-sale + rental construction is in the pipeline within 1–3 miles? Heavy new supply typically softens prices + rents 12–24 months out; constrained supply supports both.
Investment metrics
- 1% rule
- 1.41% ✓
- Cap rate
- 10.50%
- Cash-on-cash
- 15.02%
- DSCR
- 1.67
- GRM
- 5.9
CMA / ARV
No comps found within radius.
Projected returns pro-forma
-3.0% appreciation · 3.66% rent growth · sell at horizon
- IRR
- 6.5%
- Equity multiple
- 1.25×
- Total profit
- $10,507
- Equity at exit
- $21,993
- IRR
- 16.5%
- Equity multiple
- 2.40×
- Total profit
- $57,702
- Equity at exit
- $12,753
Cash invested: $41,300 (down + closing). Projections, not guarantees.
Landlord ↔ Tenant lean methodology
- Overall (STATE)
- 87 Strongly Landlord-Friendly
- State Texas
- 87 Strongly Landlord-Friendly · R+5
- County
- — inherits STATE
- City
- — inherits STATE
ZIP-level market 75701
- Rents YoY
- 3.7%
- Active inventory
- 327
- Price-to-rent
- 5.9×
Monthly cashflow live
- Estimated rent
- $2,075 medium interval (Pro) →
- Mortgage (P&I)
- −$774
- Tax from tax record
- −$288 /mo · $3,452/yr
- Insurance
- −$61
- HOA
- −$0
- Vacancy / Maint / Mgmt
- −$436
- Net cashflow
- $517
Break-even live
UW: 25.0% down · 7.5% · 30yr · 1.5% tax · 5.0% vac · 8.0% maint · 8.0% mgmt
Financing live
Cash to close
- Down payment
- $36,875
- Closing costs
- $4,425
- Reserves months
- —
- Total cash needed
- —
Loan-product check · same deal, 3 products live
Conventional
25% down · 7.5% · 30yr
- Down + closing
- —
- Monthly P&I
- —
- Monthly cashflow
- —
- DSCR
- —
- Eligible?
- —
Personal DTI + credit; lowest rate.
DSCR
20% down · 8.5% · 30yr
- Down + closing
- —
- Monthly P&I
- —
- Monthly cashflow
- —
- DSCR
- —
- Eligible?
- —
No personal income docs; deal must DSCR.
Hard money
10% down · 12.0% · 12mo
- Down + closing
- —
- Monthly P&I
- —
- Monthly cashflow
- —
- DSCR
- —
- Eligible?
- —
Short-term bridge; refi at stabilization.
Rent comps 1 comps
| Address | Beds | Baths | Sqft | Rent | $/sqft | DOM | Units | Dist |
|---|---|---|---|---|---|---|---|---|
| 1692 Alamo Xing Tyler, TX | 4.0 | 2.0 | 1610 | $2,300 | $1.43 | 13d | 1 | 1.40mi |
Listing history 17 events
-
2026-06-19days on market $147,500 Active 27 DOM
-
2026-06-18days on market $147,500 Active 26 DOM
-
2026-06-17days on market $147,500 Active 25 DOM
-
2026-06-16days on market $147,500 Active 24 DOM
-
2026-06-15days on market $147,500 Active 23 DOM
-
2026-06-14days on market $147,500 Active 21 DOM
-
2026-06-13days on market $147,500 Active 20 DOM
-
2026-06-10days on market $147,500 Active 18 DOM
-
2026-06-09days on market $147,500 Active 17 DOM
-
2026-06-08days on market $147,500 Active 16 DOM
-
2026-06-07days on market $147,500 Active 15 DOM
-
2026-06-05days on market $147,500 Active 12 DOM
-
2026-06-02days on market $147,500 Active 10 DOM
-
2026-06-01days on market $147,500 Active 9 DOM
-
2026-05-31days on market $147,500 Active 8 DOM
-
2026-05-30days on market $147,500 Active 7 DOM
-
2026-05-24$147,500 Active
ⓘ Source: listings_history table (triggers on properties + properties_extension) + one-shot
backfill from property_details.listing_events for pre-trigger history.
Tax reassessment forecast TX · Resets to sale price
- Current annual tax
- $3,452 · $288/mo
- Projected year-2 tax
- $3,452 · $288/mo
- Expected delta
- $0/yr ($0/mo · 0.0%)
ⓘ Screening estimate from a state-policy table — verify with the county assessor before closing.
Climate risk First Street
- Flood 1/10 Low FEMA zone X (unshaded) · 0% chance over 30 yrs
- Wildfire 3/10 Moderate
- Heat 6/10 Major 7 d/yr ≥109°F today · 26 d/yr by 30 yrs out
- Wind 6/10 Major 59% chance of damaging wind over 30 yrs
- Air quality 2/10 Low 0 unhealthy d/yr today · 1 by 30 yrs out
Nearby sold comps map
Loading sold comps map…
Walkable amenities ~0.75 mi
Loading nearby amenities…
Taxation est. · year 1
- Rental income
- $24,906
- − Mortgage interest
- −$8,262
- − Property taxes
- −$3,452
- − Insurance
- −$738
- − Repairs & maintenance
- −$1,992
- − Management
- −$1,992
- − Depreciation
- −$4,291
- Taxable income
- $4,178
- Est. tax owed @ 24.0%
- −$1,003
- After-tax cash flow
- $5,201/yr
For passive investors: Depreciation is non-cash, so a rental often shows a tax loss while cash-flowing — sheltering income. Rental losses are passive: they offset passive income freely, and up to $25,000/yr can offset ordinary (W-2) income if you actively participate and your MAGI is under $100k (phasing out to $0 by $150k); unused losses carry forward. On sale, claimed depreciation is recaptured at up to 25%, and gains may owe capital-gains tax (a 1031 exchange can defer both). Figures are a year-1 estimate at your 24.0% rate — not tax advice; consult a CPA.
Schools (NCES district)
- District
- Tyler ISD
- NCES district ID
- 4843470
- Math proficiency
- 39% ▼ -4.00%
- Reading proficiency
- 38% ▼ -1.00%
- Median HH income
- $44,090
- Composite
- 32.69/100
- National rank
- #5650
- State rank
- #449 of 826 in TX
Livability — Tyler
- Score
- 75/100
- State rank
- #147
- US rank
- #4181
Category grades
Schools grade is shown separately in the Schools card above.
Census & demographics
- Census place
- Tyler, TX
- County
- Smith County · 180,570 people
- City population
- 127,842
- Metro
- Tyler, TX
- Population (ZIP)
- 36,344
- Household income
- $66,401
- Rent vs Own
- Severe rent burden
- 1116.0
Population outlook (Smith County) Hauer SSP2
- Today (2025)
- 248,890 people
- By 2030
- 261,665 · +5.1%
- By 2040
- 286,114 · +15.0%
- By 2050
- 308,006 · +23.8%
- By 2075
- 354,171 · +42.3%
- By 2100
- 372,828 · +49.8%
Race, ethnicity, and origin ACS 2023
- Neighborhood character
- Diverse neighborhood (Simpson 0.64)
- Race & ethnicity
- White 53% Black 21% Hispanic / Latino 19% Two or more races 8% Asian 2%
- Hispanic origin (detail)
- Mexican 17%
- Common ancestry
- Slovak 2% Italian 1% Lithuanian 1%
- Foreign-born
- 8% · Canada
- Languages at home
- 84% English-only · Spanish 14% Other Indo-European 1%
Political lean MEDSL · Smith
- 2024 margin
- Solid R (+45.1) · D 27.0% · R 72.1%
- 2008→2024 swing
- -5.6pp toward R · 2008: -39.5pp · 2024: -45.1pp
- All cycles
- 2024: R+45.1 2020: R+39.4 2016: R+43.9 2012: R+46.9 2008: R+39.5
Not yet ingested
- Civics
- —
Market trends
- HPI YoY
- ▼ -299.78%
- Current HPI
- 207.238
- Rent YoY
- ▲ 3.66%
- Metro
- Tyler, TX
- State GDP YoY
- ▲ 3.95%
- F500 in state
- 110
Industry mix (Fortune 500 HQ in TX)
| Industry | F500 HQs | Revenue |
|---|---|---|
| Energy | 16 | $1,198B |
|
||
| Technology | 5 | $198B |
|
||
| Engineering / Construction | 4 | $72B |
|
||
| Energy Services | 3 | $60B |
|
||
| Utilities | 3 | $41B |
|
||
| Healthcare | 2 | $330B |
|
||
Price history
1 event — show timeline
- 2026-05-24 Listed $147,500 GTAR
Property tax history
+7.4%/yrLatest (2024): $3,452 · +14.1% YoY. Source: county tax records.
Cash-flow waterfall
monthlySold comps — $/sqft
last 12 mo · ≤1 miLoading sold comps…