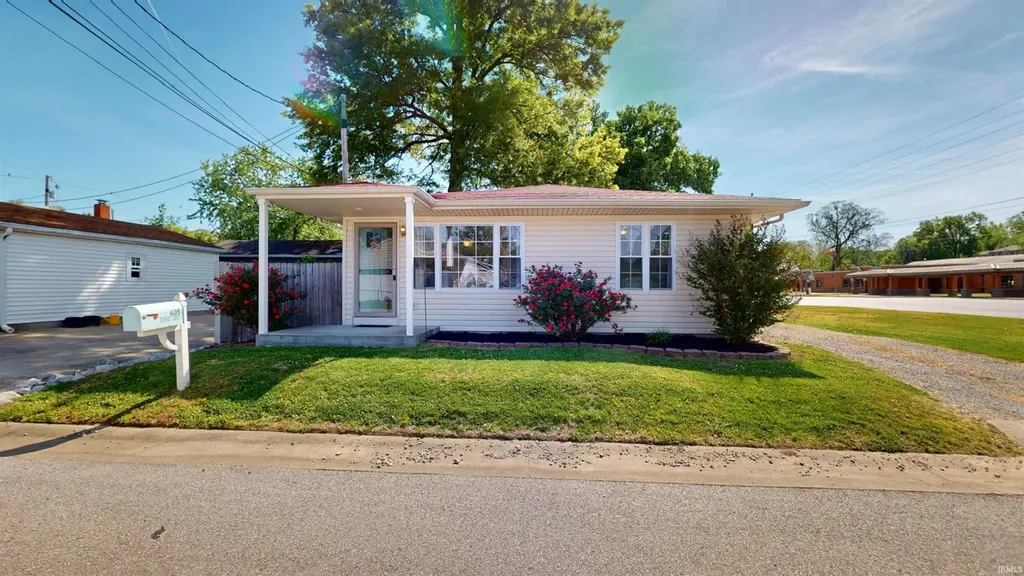
405 Filmore St · Newburgh, IN
Flood risk 1/10 · Minimal
- FEMA flood zone
- X (unshaded)
- Chance of flooding over 30 yrs
- 0.0%
- Est. flood insurance / yr
- $507 – $1,088
Fire risk 1/10 · Minimal
- Est. fire insurance / yr
- $717 – $1,331
Heat risk 6/10 · Moderate
- Hot days now (above 107°F)
- 7 days/yr
- Hot days in 30 yrs
- 20 days/yr
Wind risk 2/10 · Minimal
- Chance of severe wind over 30 yrs
- 3.0%
Air-quality risk 3/10 · Minor
- Unhealthy air days now
- 3 days/yr
- Unhealthy air days in 30 yrs
- 4 days/yr
Risk factors via First Street. Map © Google.
Why this score? — see what drove the D- grade
The composite is a weighted blend of 9 inputs, each scored 0–100. Each bar is that input's sub-score; the figure is the points it added to the 100-point composite (weight × sub-score).
- Cash flow +11.7/30.0
- Schools +4.9/10.0
- Rent growth +4.7/5.0
- Livability +4.0/5.0
- DSCR +3.4/10.0
- ARV discount +2.6/15.0
- Condition / age +2.5/5.0
- 1% rule +2.3/10.0
- Appreciation +0.0/10.0
$189,900
🖨 Deal sheet 📄 Offer letter ✓ Due diligence
Listing remarks MLS
Located in the heart of downtown Newburgh, don?t miss seeing this adorable 3 BR, 2 BA home that has been extensively renovated! Within the last 3 years, per seller, the home has received all new plumbing, new wiring including new breaker box, new drywall, new ductwork, new roof, all new windows, new flooring and other finishes. The darling, covered front porch is newly added and such an enjoyable aspect of the home! Open floor plan. The eat-in kitchen has new white cabinetry with some glass front cabinets, new counter tops and stainless steel appliances, recessed lighting. Master suite has its own full bath with a shower unit & pedestal sink. Fully fenced back yard. 1 car attached garage. Separate laundry room with an exit door to driveway. Water softener. Laminate floors throughout.
Key facts
- Covered front porch
- Open floor plan
- Attached garage
Tags
Neighborhood map
What this means for you Summary
Snapshot
- This is a 3-bed/2.0-bath single-family listed at $190k.
Deal economics
- At list price, monthly cash flow is $-55 ($-662/yr) — negative.
- To cash-flow at today's rent, offer at most $180k (5.1% below list).
- To meet the 1% rule (rent ≥ 1% of price), the offer needs to be $139k (27.0% below list).
- Recommended offer: $139k (27.0% below list) — sets the bar for 1% rule.
- Cap rate 5.9% vs local median 3.9% in Newburgh — top-decile yield for the area; either an underpriced asset or a hidden risk that comps aren't pricing in. Stress-test before assuming the spread holds.
Location & tenants
- Location reads 80/100 on livability (#21 in IN, #1,922 nationally) — a professional / high-income tenant draw. Strengths: crime A+, cost of living A+, housing A+; Watch: amenities F, commute F.
- Warrick County School Corporation (suburban): math 54% / reading 59% proficiency, ranked #24 of 301 in IN (top 8%) — acceptable for families but not a draw, mixed tenant base, ~2y average lease.
- Zoned schools: Newburgh Elementary School (math 70% / reading 63%, grade B+, #65 of 994 statewide, top 7%, 629 students, 32% FRL); Castle South Middle School (math 43% / reading 57%, grade C, #48 of 330 statewide, top 15%, 712 students, 34% FRL); Castle High School (math 56% / reading 80%, grade B, #22 of 369 statewide, top 6%, 1,961 students, 26% FRL).
- Market conditions: Rents rising fast (+8.7%/yr); 383 active listings in the ZIP; 7 comparable units currently listed for rent nearby; rentals at typical pace (median 21d on market — plan ~3-4 weeks tenant-placement turnaround); 43% of comp listings sitting > 30 days — soft ceiling on asking rent; solid renter incomes; 249 units permitted in Warrick County in 2024 (0 in 5+ unit buildings).
- This rent is only 18% of the median local income ($94k/yr) — well below the 30% rent-burden line; pricing power to push rent on renewal without tenant pushback.
Forward outlook
- Local home prices are declining (-3.0%/yr); year-one equity from $1k of loan paydown is wiped out by about $6k of value loss. Plan a longer hold.
- Warrick County population projected at +9% by 2050 — modest demand growth; plan on rents tracking national, not racing it.
Negotiation context
- Only 1 days on market — expect competitive offers; lowballing is unlikely to land.
- 3 sale attempts since 10y ago with the ask held roughly flat each time — persistent listings suggest the price (not the market) is what's stuck; bring a comps-based counter.
- Current owner paid $118k; list at $190k implies a 62% gain — meaningful room to come down on a strong offer.
Risks & watch-outs
- Watch-outs: built in 1954 — expect roof / HVAC / electrical / plumbing capex.
- Climate carrying-cost: extreme-heat days projected 7→20/yr by 2055 (HVAC capex compounding) — expect insurance premiums to compound above CPI over the hold.
Questions for the listing agent
- What do current leases actually rent for vs. the listed asking? Can we see a recent rent roll and the last 12 months of T-12 income?
- Built in 1954 — when were the roof, HVAC, electrical panel, plumbing, and water heater last replaced?
- Is there a deadline driving the sale (1031 exchange, divorce, estate, relocation)? That informs how much negotiation room exists.
- Schools are A-rated — typically a magnet for longer-tenancy family renters. What's the average tenant stay here, and is there a school-zone premium baked into asking?
- The area grade is low — what's the realistic commute time and amenity access for the typical tenant pool here? Any planned neighborhood developments (good or bad) we should know about?
- What's the average days-on-market for RENTAL listings here right now (not sales)? A rising rental-DOM trend means longer vacancies and softer asking-rent achievability than the comps imply.
- What's the recent tenant-quality profile in this submarket — average credit score on applications, eviction rate, late-payment / NSF rate, and stable-employment percentage? A property-management company in the area should have these aggregated.
- How much new for-sale + rental construction is in the pipeline within 1–3 miles? Heavy new supply typically softens prices + rents 12–24 months out; constrained supply supports both.
Investment metrics
- 1% rule
- 0.73% ✗
- Cap rate
- 5.94%
- Cash-on-cash
- -1.24%
- DSCR
- 0.94
- GRM
- 11.4
CMA / ARV
- ARV (on-the-fly)
- $171,360
- Comps found
- 12
Show comp detail 12 sales within ~0.75 mi
| Address | Dist | Beds/Ba | Sqft | Sold | Price | $/sf | Match |
|---|---|---|---|---|---|---|---|
| 405 Filmore St | 0.00mi | 3/2.0 | 1,008 (0%) | 1mo | $194,900 | $193 | 99 |
| 217 Monroe St | 0.13mi | 3/2.0 | 1,002 (-1%) | 2mo | $199,000 | $199 | 91 |
| 113 N Fourth St | 0.16mi | 2/2.0 (-1) | 1,012 (+0%) | 8mo | $172,500 | $170 | 80 |
| 405 Middle St | 0.15mi | 3/1.0 | 1,065 (+6%) | 4mo | $177,500 | $167 | 76 |
| 329 Middle St | 0.15mi | 2/1.0 (-1) | 1,024 (+2%) | 20mo | $165,000 | $161 | 65 |
| 414 Locust St | 0.24mi | 2/2.0 (-1) | 1,014 (+1%) | 23mo | $172,500 | $170 | 64 |
| 8 Yorkshire Dr | 0.55mi | 3/1.0 | 1,000 (-1%) | 18mo | $214,400 | $214 | 54 |
| 419 Section St | 0.36mi | 2/1.0 (-1) | 1,080 (+7%) | 20mo | $140,000 | $130 | 46 |
| 612 Prince Dr | 0.53mi | 3/1.5 | 1,153 (+14%) | 14mo | $214,500 | $186 | 38 |
| 725 Outer Gray St | 0.62mi | 2/1.0 (-1) | 1,070 (+6%) | 18mo | $110,000 | $103 | 36 |
| 5654 Maple Ln | 0.73mi | 2/1.0 (-1) | 986 (-2%) | 22mo | $170,900 | $173 | 35 |
| 5666 Maple Ln | 0.72mi | 2/1.0 (-1) | 1,081 (+7%) | 22mo | $145,000 | $134 | 27 |
Match score weights: distance 35% · size 25% · config 20% · recency 20%. Top-matched comps best support the ARV.
Projected returns pro-forma
-3.0% appreciation · 8.0% rent growth · sell at horizon
- IRR
- -13.6%
- Equity multiple
- 0.49×
- Total profit
- $-27,036
- Equity at exit
- $28,315
- IRR
- 1.1%
- Equity multiple
- 1.09×
- Total profit
- $4,959
- Equity at exit
- $16,419
Cash invested: $53,172 (down + closing). Projections, not guarantees.
Landlord ↔ Tenant lean methodology
- Overall (STATE)
- 90 Strongly Landlord-Friendly
- State Indiana
- 90 Strongly Landlord-Friendly · R+11
- County
- — inherits STATE
- City
- — inherits STATE
ZIP-level market 47630
- Rents YoY
- 8.7%
- Active inventory
- 383
- Price-to-rent
- 11.4×
Monthly cashflow live
- Estimated rent
- $1,386 high interval (Pro) →
- Mortgage (P&I)
- −$996
- Tax from tax record
- −$75 /mo · $903/yr
- Insurance
- −$79
- HOA
- −$0
- Vacancy / Maint / Mgmt
- −$291
- Net cashflow
- $-55
Break-even live
UW: 25.0% down · 7.5% · 30yr · 1.5% tax · 5.0% vac · 8.0% maint · 8.0% mgmt
Financing live
Cash to close
- Down payment
- $47,475
- Closing costs
- $5,697
- Reserves months
- —
- Total cash needed
- —
Loan-product check · same deal, 3 products live
Conventional
25% down · 7.5% · 30yr
- Down + closing
- —
- Monthly P&I
- —
- Monthly cashflow
- —
- DSCR
- —
- Eligible?
- —
Personal DTI + credit; lowest rate.
DSCR
20% down · 8.5% · 30yr
- Down + closing
- —
- Monthly P&I
- —
- Monthly cashflow
- —
- DSCR
- —
- Eligible?
- —
No personal income docs; deal must DSCR.
Hard money
10% down · 12.0% · 12mo
- Down + closing
- —
- Monthly P&I
- —
- Monthly cashflow
- —
- DSCR
- —
- Eligible?
- —
Short-term bridge; refi at stabilization.
Rent comps 7 comps
| Address | Beds | Baths | Sqft | Rent | $/sqft | DOM | Units | Dist |
|---|---|---|---|---|---|---|---|---|
| 624 Village Ln Newburgh, IN | 2.0 | 1.0 | 828 | $900 | $1.09 | 43d | 1 | 0.45mi |
| 5700 Kenwood Cir Newburgh, IN | 1.0–2.0 | 1.0 | 858 | $910 | $1.06 | 13d | 2 | 0.72mi |
| 9895 Cove Point Ct Newburgh, IN | 3.0 | 2.0 | 1307 | $1,950 | $1.49 | 21d | 1 | 1.32mi |
| 5879 Riverwalk Cir Newburgh, IN | 3.0 | 2.0 | 1128 | $1,600 | $1.42 | 21d | 1 | 1.38mi |
| 7300 Brentwood Dr Newburgh, IN | 2.0 | 1.0 | 890 | $865 | $0.97 | 13d | 1 | 1.42mi |
| 8584 Lincoln Ave Newburgh, IN | 3.0 | 2.0 | 1330 | $1,549 | $1.16 | 43d | 1 | 1.49mi |
| 8582 Lincoln Ave Newburgh, IN | 2.0 | 2.0 | 1068 | $1,344 | $1.26 | 43d | 1 | 1.49mi |
Listing history 6 events
-
2026-04-25status Pending
-
2026-04-23$189,900 Active
-
2019-11-27soldstatus $117,500 800-char remark
Show marketing remark (800 chars)
Located in the heart of downtown Newburgh, don?t miss seeing this adorable 3 BR, 2 BA home that has been extensively renovated! Within the last 3 years, per seller, the home has received all new plumbing, new wiring including new breaker box, new drywall, new ductwork, new roof, all new windows, new flooring and other finishes. The darling, covered front porch is newly added and such an enjoyable aspect of the home! Open floor plan. The eat-in kitchen has new white cabinetry with some glass front cabinets, new counter tops and stainless steel appliances, recessed lighting. Master suite has its own full bath with a shower unit & pedestal sink. Fully fenced back yard. 1 car attached garage. Separate laundry room with an exit door to driveway. Water softener. Laminate floors throughout.
-
2019-09-26$119,900 800-char remark
Show marketing remark (800 chars)
Located in the heart of downtown Newburgh, don?t miss seeing this adorable 3 BR, 2 BA home that has been extensively renovated! Within the last 3 years, per seller, the home has received all new plumbing, new wiring including new breaker box, new drywall, new ductwork, new roof, all new windows, new flooring and other finishes. The darling, covered front porch is newly added and such an enjoyable aspect of the home! Open floor plan. The eat-in kitchen has new white cabinetry with some glass front cabinets, new counter tops and stainless steel appliances, recessed lighting. Master suite has its own full bath with a shower unit & pedestal sink. Fully fenced back yard. 1 car attached garage. Separate laundry room with an exit door to driveway. Water softener. Laminate floors throughout.
-
2016-09-06soldstatus $32,500 390-char remark
Show marketing remark (390 chars)
This 2-3 bedroom home has an attached 1 car garage and a fenced backyard. This home sits next to Newburgh Elementary and not far from the river/walking paths and many restaurants. The living room is spacious and has several windows allowing for a lot of natural light to enter. The kitchen has a lot of cabinet space and a door leading to the garage. This is a Fannie Mae HomePath property.
-
2016-05-31$34,000 390-char remark
Show marketing remark (390 chars)
This 2-3 bedroom home has an attached 1 car garage and a fenced backyard. This home sits next to Newburgh Elementary and not far from the river/walking paths and many restaurants. The living room is spacious and has several windows allowing for a lot of natural light to enter. The kitchen has a lot of cabinet space and a door leading to the garage. This is a Fannie Mae HomePath property.
ⓘ Source: listings_history table (triggers on properties + properties_extension) + one-shot
backfill from property_details.listing_events for pre-trigger history.
Tax reassessment forecast IN · Partial reset (capped growth)
- Current annual tax
- $903 · $75/mo
- Projected year-2 tax
- $1,259 · $105/mo
- Expected delta
- +$355/yr (+$30/mo · 39.4%)
ⓘ Screening estimate from a state-policy table — verify with the county assessor before closing.
Climate risk First Street
- Flood 1/10 Low FEMA zone X (unshaded) · 0% chance over 30 yrs
- Wildfire 1/10 Low
- Heat 6/10 Major 7 d/yr ≥107°F today · 20 d/yr by 30 yrs out
- Wind 2/10 Low 3% chance of damaging wind over 30 yrs
- Air quality 3/10 Moderate 3 unhealthy d/yr today · 4 by 30 yrs out
Nearby sold comps map
Loading sold comps map…
Walkable amenities ~0.75 mi
Loading nearby amenities…
Taxation est. · year 1
- Rental income
- $16,635
- − Mortgage interest
- −$10,637
- − Property taxes
- −$903
- − Insurance
- −$950
- − Repairs & maintenance
- −$1,331
- − Management
- −$1,331
- − Depreciation
- −$5,524
- Taxable loss
- −$4,041
- Est. tax savings @ 24.0%
- +$970
- After-tax cash flow
- $308/yr
For passive investors: Depreciation is non-cash, so a rental often shows a tax loss while cash-flowing — sheltering income. Rental losses are passive: they offset passive income freely, and up to $25,000/yr can offset ordinary (W-2) income if you actively participate and your MAGI is under $100k (phasing out to $0 by $150k); unused losses carry forward. On sale, claimed depreciation is recaptured at up to 25%, and gains may owe capital-gains tax (a 1031 exchange can defer both). Figures are a year-1 estimate at your 24.0% rate — not tax advice; consult a CPA.
Schools (NCES district)
- District
- Warrick County School Corporation
- NCES district ID
- 1812390
- Math proficiency
- 54% ▼ -8.00%
- Reading proficiency
- 59% ▼ -6.00%
- Median HH income
- $62,801
- Composite
- 49.38/100
- National rank
- #2014
- State rank
- #24 of 301 in IN
Livability — Newburgh
- Score
- 80/100
- State rank
- #21
- US rank
- #1922
Category grades
Schools grade is shown separately in the Schools card above.
Census & demographics
- Census place
- Newburgh, IN
- County
- Warrick County · 39,818 people
- City population
- 39,818
- Metro
- Evansville, IN-KY
- Population (ZIP)
- 39,818
- Household income
- $94,162
- Rent vs Own
- Severe rent burden
- 770.0
Population outlook (Warrick County) Hauer SSP2
- Today (2025)
- 66,569 people
- By 2030
- 68,404 · +2.8%
- By 2040
- 71,131 · +6.9%
- By 2050
- 72,743 · +9.3%
- By 2075
- 76,088 · +14.3%
- By 2100
- 72,261 · +8.6%
Race, ethnicity, and origin ACS 2023
- Neighborhood character
- Predominantly White (88%)
- Race & ethnicity
- White 88% Two or more races 5% Black 3% Hispanic / Latino 3% Asian 3%
- Common ancestry
- Italian 3% Lithuanian 2% Romanian 2%
- Foreign-born
- 5% · Canada, China
- Languages at home
- 96% English-only · Spanish 2% Other Indo-European 1%
Political lean MEDSL · Warrick
- 2024 margin
- Solid R (+30.2) · D 34.1% · R 64.3% · Other 1.5%
- 2008→2024 swing
- -17.4pp toward R · 2008: -12.8pp · 2024: -30.2pp
- All cycles
- 2024: R+30.2 2020: R+27.8 2016: R+33.9 2012: R+26.6 2008: R+12.8
Not yet ingested
- Civics
- —
Market trends
- HPI YoY
- ▼ -187.44%
- Current HPI
- 185.7643
- Rent YoY
- ▲ 8.69%
- Metro
- Evansville, IN-KY
- State GDP YoY
- ▲ 2.90%
- F500 in state
- 18
Industry mix (Fortune 500 HQ in IN)
| Industry | F500 HQs | Revenue |
|---|---|---|
| Industrial Machinery | 2 | $37B |
|
||
| Healthcare | 1 | $177B |
|
||
| Pharmaceuticals | 1 | $45B |
|
||
| Metals / Steel | 1 | $18B |
|
||
| Agriculture | 1 | $17B |
|
||
| Packaging | 1 | $12B |
|
||
Price history
+458.5% since first listed6 events — show timeline
- 2026-04-25 Pending — IRMLS
- 2026-04-23 Listed $189,900 IRMLS
- 2019-11-27 Sold (MLS) $117,500 IRMLS
- 2019-09-26 Listed $119,900 IRMLS
- 2016-09-06 Sold (MLS) $32,500 IRMLS
- 2016-05-31 Listed $34,000 IRMLS
Property tax history
+12.5%/yrLatest (2024): $903 · +10.6% YoY. Source: county tax records.
Cash-flow waterfall
monthlySold comps — $/sqft
last 12 mo · ≤1 miLoading sold comps…