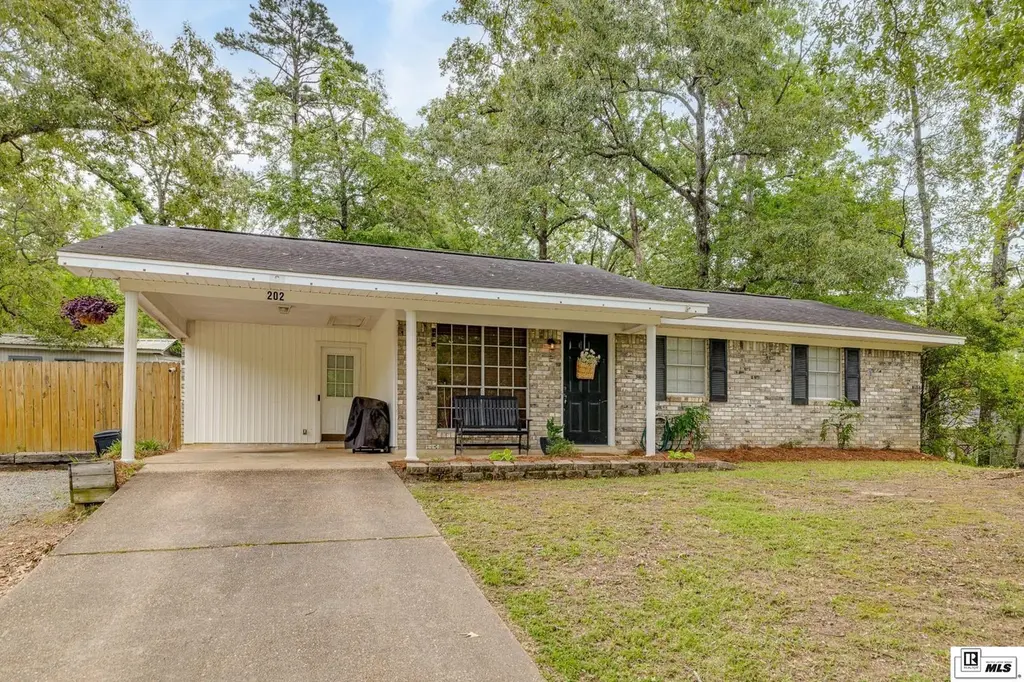
202 Forty Oaks Farm Rd · Claiborne, LA
Flood risk 1/10 · Minimal
- FEMA flood zone
- X (unshaded)
- Chance of flooding over 30 yrs
- 0.0%
- Est. flood insurance / yr
- $507 – $1,088
Fire risk 2/10 · Minimal
- Est. fire insurance / yr
- $1,269 – $2,357
Heat risk 7/10 · Major
- Hot days now (above 111°F)
- 7 days/yr
- Hot days in 30 yrs
- 19 days/yr
Wind risk 6/10 · Moderate
- Chance of severe wind over 30 yrs
- 74.0%
Air-quality risk 1/10 · Minimal
- Unhealthy air days now
- 0 days/yr
- Unhealthy air days in 30 yrs
- 0 days/yr
Risk factors via First Street. Map © Google.
Why this score? — see what drove the D grade
The composite is a weighted blend of 9 inputs, each scored 0–100. Each bar is that input's sub-score; the figure is the points it added to the 100-point composite (weight × sub-score).
- Cash flow +18.5/30.0
- DSCR +5.8/10.0
- Rent growth +4.7/5.0
- 1% rule +4.0/10.0
- Livability +3.4/5.0
- Schools +3.2/10.0
- Condition / age +2.5/5.0
- ARV discount +0.0/15.0
- Appreciation +0.0/10.0
$175,000
🖨 Deal sheet 📄 Offer letter ✓ Due diligence
Listing remarks MLS
Convenient West Monroe location in the George Welch area, this 3br, 1.5ba, home offers new flooring, paint, nice sized utility room and so much more. Outside you will find additional parking, a privacy fenced backyard, and a large entertaining area too. Call today to schedule for more information or to schedule your private showing.
Key facts
- Covered front porch
- Open patio
- Backyard workshop
Tags
Property features AI
Finance
- HOA & community: No association amenities
Exterior
- Parking: 1-car garage; Carport; Open parking
- Security: Smoke detectors; Carbon monoxide detectors
- Utilities: Public water; Public sewer; Natural gas available and connected
- Home design: Single-family residential site-built home; One level (entry level 1)
- Construction: Vinyl siding and brick veneer exterior; Asphalt roof; Slab foundation; Built with traditional construction materials
- Exterior features: Covered patio/porch; Wood fencing; Landscaped and cleared lot; Paved road access; Workshop (outbuilding)
Interior
- Kitchen: Dishwasher; Refrigerator; Electric range
- Bedrooms: 3 bedrooms on the main level
- Bathrooms: 1 full bathroom; 1 half bathroom; 2 bathrooms on the main level; 1 partial bathroom
- Heating & cooling: Central heating (natural gas); Central air conditioning; Ceiling fans
- Interior features: Ceiling fans; Smoke and carbon monoxide detectors
- Laundry & utility: Gas water heater
Neighborhood map
What this means for you Summary
Snapshot
- This is a 3-bed/2.0-bath single-family listed at $175k.
Deal economics
- At list price, monthly cash flow is $168 ($2k/yr) — positive.
- The deal already cash-flows at list — no discount required.
- To meet the 1% rule (rent ≥ 1% of price), the offer needs to be $158k (9.7% below list).
- Recommended offer: $158k (9.7% below list) — sets the bar for 1% rule.
- Cap rate 7.4% vs local median 4.0% in Claiborne — top-decile yield for the area; either an underpriced asset or a hidden risk that comps aren't pricing in. Stress-test before assuming the spread holds.
Location & tenants
- Location reads 67/100 on livability (#109 in LA) — a middle-class / working-renter tenant base. Strengths: cost of living A+, housing A+, employment A-; Watch: crime D+, health & safety D, amenities F.
- Ouachita Parish (suburban): math 31% / reading 45% proficiency, ranked #26 of 98 in LA (top 26%) — families likely to look elsewhere, expect single-tenant / working-renter base with shorter leases.
- Zoned schools: Good Hope Middle School (math 35% / reading 53%, grade D, #51 of 218 statewide, top 24%, 602 students, 53% FRL); West Monroe High School (math 32% / reading 48%, grade F, #77 of 265 statewide, top 29%, 2,189 students, 58% FRL) — zoned schools at 55% FRL track the district average.
- Market conditions: Rents rising fast (+8.9%/yr); 199 active listings in the ZIP; 7 comparable units currently listed for rent nearby; rentals lingering (median 44d on market — plan ~5-8 weeks vacancy on turnover, expect pricing pressure); 71% of comp listings sitting > 30 days — soft ceiling on asking rent; 345 units permitted in Ouachita Parish in 2024 (0 in 5+ unit buildings).
Forward outlook
- Local home prices are declining (-3.0%/yr); year-one equity from $1k of loan paydown is wiped out by about $5k of value loss. Plan a longer hold.
- At projected returns (-3.0% appreciation + 8.0% rent growth), your $49k cash investment doubles in ~10 years — after that, you're playing with house money.
Negotiation context
- Only 4 days on market — expect competitive offers; lowballing is unlikely to land.
- 3 sale attempts since 6y ago with the ask held roughly flat each time — persistent listings suggest the price (not the market) is what's stuck; bring a comps-based counter.
- Current owner paid $132k; 33% above their basis — modest negotiation headroom, anchor on the comps not their cost.
Risks & watch-outs
- Climate carrying-cost: major wind risk, 74% chance of damaging wind over 30y; extreme-heat days projected 7→19/yr by 2055 (HVAC capex compounding) — expect insurance premiums to compound above CPI over the hold.
Questions for the listing agent
- Built in 1969 — when were the roof, HVAC, electrical panel, plumbing, and water heater last replaced?
- Is there a deadline driving the sale (1031 exchange, divorce, estate, relocation)? That informs how much negotiation room exists.
- Schools are D-rated, which usually means shorter tenancies and higher turnover. Who's the typical renter profile here, and what's been the actual vacancy rate?
- Crime grade is D in this area — have there been break-ins, vandalism, or insurance claims at this property in the last 3 years? What carrier currently insures it and at what premium?
- The area grade is low — what's the realistic commute time and amenity access for the typical tenant pool here? Any planned neighborhood developments (good or bad) we should know about?
- What's the average days-on-market for RENTAL listings here right now (not sales)? A rising rental-DOM trend means longer vacancies and softer asking-rent achievability than the comps imply.
- What's the recent tenant-quality profile in this submarket — average credit score on applications, eviction rate, late-payment / NSF rate, and stable-employment percentage? A property-management company in the area should have these aggregated.
- How much new for-sale + rental construction is in the pipeline within 1–3 miles? Heavy new supply typically softens prices + rents 12–24 months out; constrained supply supports both.
Investment metrics
- 1% rule
- 0.90% ✗
- Cap rate
- 7.44%
- Cash-on-cash
- 4.11%
- DSCR
- 1.18
- GRM
- 9.2
CMA / ARV
- ARV (on-the-fly)
- $143,235
- Comps found
- 12
Show comp detail 12 sales within ~0.75 mi
| Address | Dist | Beds/Ba | Sqft | Sold | Price | $/sf | Match |
|---|---|---|---|---|---|---|---|
| 118 Wellington Pl | 0.46mi | 2/1.5 (-1) | 1,056 (-0%) | 2mo | $142,500 | $135 | 70 |
| 105 Lakewood Dr | 0.46mi | 3/2.0 | 1,047 (-1%) | 8mo | $177,000 | $169 | 70 |
| 117 N Ironwood Dr | 0.50mi | 3/2.0 | 1,096 (+3%) | 5mo | $147,500 | $135 | 67 |
| 429 S Ironwood Dr | 0.11mi | 3/1.5 | 1,216 (+15%) | 3mo | $115,400 | $95 | 66 |
| 205 E Ironwood Dr | 0.49mi | 3/2.0 | 1,121 (+6%) | 7mo | $174,000 | $155 | 62 |
| 201 Ashwood Dr | 0.35mi | 3/1.0 | 1,175 (+11%) | 2mo | $166,650 | $142 | 60 |
| 115 Wellington Pl | 0.46mi | 2/1.5 (-1) | 1,111 (+5%) | 5mo | $125,000 | $113 | 60 |
| 106 Wellington Pl | 0.48mi | 2/1.5 (-1) | 1,146 (+8%) | 8mo | $131,790 | $115 | 51 |
| 128 Davis Ln | 0.66mi | 3/1.5 | 1,162 (+10%) | 1mo | $143,500 | $123 | 50 |
| 309 Susan Dr | 0.68mi | 3/1.5 | 1,193 (+12%) | 3mo | $170,000 | $142 | 43 |
| 120 Wellington Pl | 0.45mi | 2/1.5 (-1) | 1,156 (+9%) | 18mo | $125,000 | $108 | 42 |
| 304 Susan Dr | 0.74mi | 3/1.5 | 1,178 (+11%) | 18mo | $172,000 | $146 | 30 |
Match score weights: distance 35% · size 25% · config 20% · recency 20%. Top-matched comps best support the ARV.
Projected returns pro-forma
-3.0% appreciation · 8.0% rent growth · sell at horizon
- IRR
- -4.9%
- Equity multiple
- 0.81×
- Total profit
- $-9,368
- Equity at exit
- $26,093
- IRR
- 9.5%
- Equity multiple
- 1.89×
- Total profit
- $43,392
- Equity at exit
- $15,131
Cash invested: $49,000 (down + closing). Projections, not guarantees.
Landlord ↔ Tenant lean methodology
- Overall (STATE)
- 90 Strongly Landlord-Friendly
- State Louisiana
- 90 Strongly Landlord-Friendly · R+12
- County
- — inherits STATE
- City
- — inherits STATE
ZIP-level market 71291
- Home prices YoY
- -30.2%
- Rents YoY
- 8.9%
- Active inventory
- 199
- Price-to-rent
- 9.2×
Monthly cashflow live
- Estimated rent
- $1,580 high interval (Pro) →
- Mortgage (P&I)
- −$918
- Tax from tax record
- −$90 /mo · $1,075/yr
- Insurance
- −$73
- HOA
- −$0
- Vacancy / Maint / Mgmt
- −$332
- Net cashflow
- $168
Break-even live
UW: 25.0% down · 7.5% · 30yr · 1.5% tax · 5.0% vac · 8.0% maint · 8.0% mgmt
Financing live
Cash to close
- Down payment
- $43,750
- Closing costs
- $5,250
- Reserves months
- —
- Total cash needed
- —
Loan-product check · same deal, 3 products live
Conventional
25% down · 7.5% · 30yr
- Down + closing
- —
- Monthly P&I
- —
- Monthly cashflow
- —
- DSCR
- —
- Eligible?
- —
Personal DTI + credit; lowest rate.
DSCR
20% down · 8.5% · 30yr
- Down + closing
- —
- Monthly P&I
- —
- Monthly cashflow
- —
- DSCR
- —
- Eligible?
- —
No personal income docs; deal must DSCR.
Hard money
10% down · 12.0% · 12mo
- Down + closing
- —
- Monthly P&I
- —
- Monthly cashflow
- —
- DSCR
- —
- Eligible?
- —
Short-term bridge; refi at stabilization.
Rent comps 7 comps
| Address | Beds | Baths | Sqft | Rent | $/sqft | DOM | Units | Dist |
|---|---|---|---|---|---|---|---|---|
| 2555 Arkansas Rd Unit 16 West Monroe, LA | 3.0 | 1.5 | 1180 | $1,750 | $1.48 | 44d | 1 | 0.29mi |
| 114 Westchase Dr West Monroe, LA | 2.0 | 1.5 | 1266 | $1,550 | $1.22 | 21d | 1 | 0.47mi |
| 816 Wallace Dean Rd West Monroe, LA | 3.0 | 1.5 | 1045 | $1,550 | $1.48 | 44d | 1 | 0.66mi |
| 714 Wallace Dean Rd West Monroe, LA | 3.0 | 1.5 | 1321 | $1,325 | $1.00 | 44d | 1 | 0.91mi |
| 298 Defreese Rd West Monroe, LA | 3.0 | 1.0 | 1100 | $1,500 | $1.36 | 44d | 1 | 1.13mi |
| 122 Flagstone Dr Unit 1 West Monroe, LA | 3.0 | 2.0 | 1030 | $1,295 | $1.26 | 44d | 1 | 1.29mi |
| 112 Fairlane Dr Unit 8 West Monroe, LA | 2.0 | 2.0 | 1050 | $1,600 | $1.52 | 21d | 1 | 1.46mi |
Listing history 8 events
-
2026-05-20status Pending
-
2026-05-19status Active
-
2026-05-11status Pending
-
2026-05-08$175,000 Active
-
2021-02-01soldstatus $132,000
-
2021-01-29soldstatus 334-char remark
Show marketing remark (334 chars)
Convenient West Monroe location in the George Welch area, this 3br, 1.5ba, home offers new flooring, paint, nice sized utility room and so much more. Outside you will find additional parking, a privacy fenced backyard, and a large entertaining area too. Call today to schedule for more information or to schedule your private showing.
-
2020-12-14$130,000 334-char remark
Show marketing remark (334 chars)
Convenient West Monroe location in the George Welch area, this 3br, 1.5ba, home offers new flooring, paint, nice sized utility room and so much more. Outside you will find additional parking, a privacy fenced backyard, and a large entertaining area too. Call today to schedule for more information or to schedule your private showing.
-
2011-06-01soldstatus
ⓘ Source: listings_history table (triggers on properties + properties_extension) + one-shot
backfill from property_details.listing_events for pre-trigger history.
Tax reassessment forecast LA · Resets to sale price
- Current annual tax
- $1,075 · $90/mo
- Projected year-2 tax
- $1,075 · $90/mo
- Expected delta
- $0/yr ($0/mo · 0.0%)
ⓘ Screening estimate from a state-policy table — verify with the county assessor before closing.
Climate risk First Street
- Flood 1/10 Low FEMA zone X (unshaded) · 0% chance over 30 yrs
- Wildfire 2/10 Low
- Heat 7/10 Severe 7 d/yr ≥111°F today · 19 d/yr by 30 yrs out
- Wind 6/10 Major 74% chance of damaging wind over 30 yrs
- Air quality 1/10 Low 0 unhealthy d/yr today · 0 by 30 yrs out
Nearby sold comps map
Loading sold comps map…
Walkable amenities ~0.75 mi
Loading nearby amenities…
Taxation est. · year 1
- Rental income
- $18,959
- − Mortgage interest
- −$9,803
- − Property taxes
- −$1,075
- − Insurance
- −$875
- − Repairs & maintenance
- −$1,517
- − Management
- −$1,517
- − Depreciation
- −$5,091
- Taxable loss
- −$918
- Est. tax savings @ 24.0%
- +$220
- After-tax cash flow
- $2,235/yr
For passive investors: Depreciation is non-cash, so a rental often shows a tax loss while cash-flowing — sheltering income. Rental losses are passive: they offset passive income freely, and up to $25,000/yr can offset ordinary (W-2) income if you actively participate and your MAGI is under $100k (phasing out to $0 by $150k); unused losses carry forward. On sale, claimed depreciation is recaptured at up to 25%, and gains may owe capital-gains tax (a 1031 exchange can defer both). Figures are a year-1 estimate at your 24.0% rate — not tax advice; consult a CPA.
Schools (NCES district)
- District
- Ouachita Parish
- NCES district ID
- 2201200
- Math proficiency
- 31% ▼ -38.00%
- Reading proficiency
- 45% ▼ -31.00%
- Median HH income
- $43,316
- Composite
- 32.14/100
- National rank
- #5791
- State rank
- #26 of 98 in LA
Livability — Claiborne
- Score
- 67/100
- State rank
- #109
- US rank
- #10626
Category grades
Schools grade is shown separately in the Schools card above.
Census & demographics
- Census place
- Claiborne, LA
- County
- Ouachita Parish · 118,340 people
- Metro
- Monroe, LA
- Population (ZIP)
- 35,269
- Household income
- $71,639
- Rent vs Own
- Severe rent burden
- 847.0
Population outlook (Ouachita County) Hauer SSP2
- Today (2025)
- 163,370 people
- By 2030
- 165,520 · +1.3%
- By 2040
- 167,652 · +2.6%
- By 2050
- 166,699 · +2.0%
- By 2075
- 156,348 · -4.3%
- By 2100
- 134,102 · -17.9%
Race, ethnicity, and origin ACS 2023
- Neighborhood character
- Predominantly White (78%)
- Race & ethnicity
- White 78% Black 13% Hispanic / Latino 6% Two or more races 3% Asian 1%
- Hispanic origin (detail)
- Mexican 3%
- Common ancestry
- Lithuanian 3% Italian 2% Slovak 1%
- Foreign-born
- 4% · Canada
- Languages at home
- 94% English-only · Spanish 4% Other Indo-European 1%
Political lean MEDSL · Ouachita
- 2024 margin
- Strong R (+27.9) · D 35.5% · R 63.3% · Other 1.2%
- 2008→2024 swing
- -2.7pp toward R · 2008: -25.2pp · 2024: -27.9pp
- All cycles
- 2024: R+27.9 2020: R+23.6 2016: R+25.4 2012: R+20.9 2008: R+25.2
Not yet ingested
- Civics
- —
Market trends
- HPI YoY
- ▼ -95.15%
- Current HPI
- 220.1737
- Rent YoY
- ▲ 8.93%
- Metro
- Monroe, LA
- State GDP YoY
- ▲ 3.29%
- F500 in state
- 10
Industry mix (Fortune 500 HQ in LA)
| Industry | F500 HQs | Revenue |
|---|---|---|
| Telecommunications | 2 | $23B |
|
||
| Utilities | 1 | $12B |
|
||
| Wholesale / Distribution | 1 | $5B |
|
||
| Advertising | 1 | $2B |
|
||
Price history
+34.6% since first listed8 events — show timeline
- 2026-05-20 Pending — NELABOR
- 2026-05-19 Relisted — NELABOR
- 2026-05-11 Pending — NELABOR
- 2026-05-08 Listed $175,000 NELABOR
- 2021-02-01 Sold (Public Records) $132,000 Public Records
- 2021-01-29 Sold (MLS) — NELABOR
- 2020-12-14 Listed $130,000 NELABOR
- 2011-06-01 Sold (Public Records) — Public Records
Property tax history
+1.6%/yrLatest (2025): $1,075 · -1.2% YoY. Source: county tax records.
Cash-flow waterfall
monthlySold comps — $/sqft
last 12 mo · ≤1 miLoading sold comps…