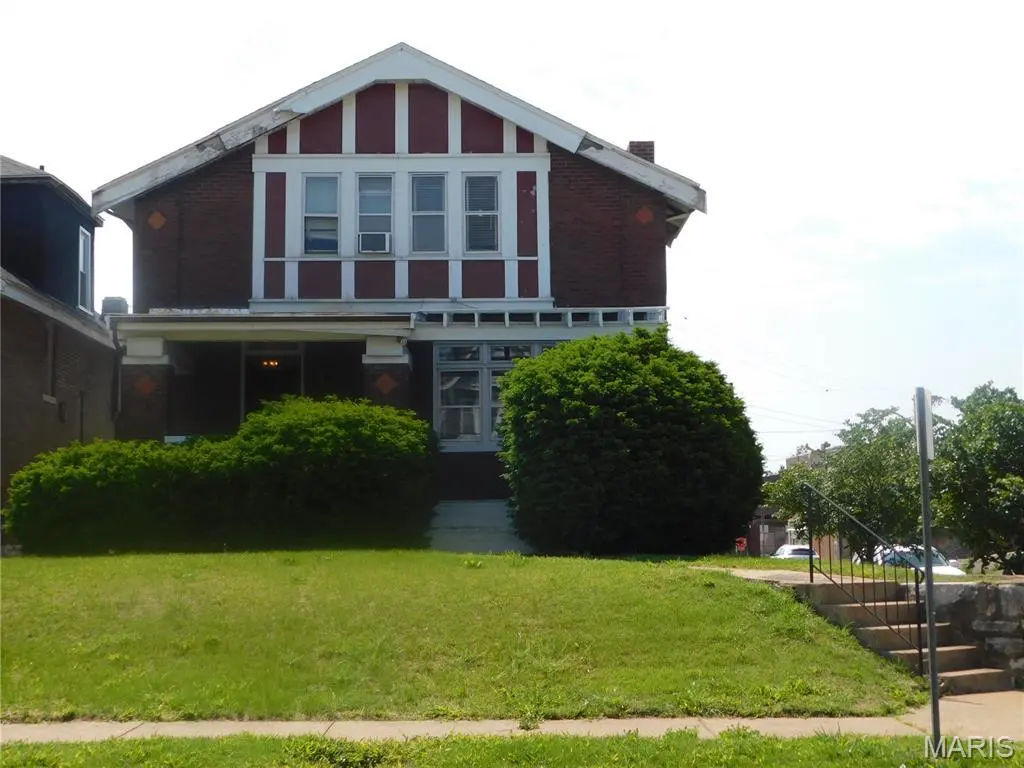
4502 Harris Ave · St. Louis, MO
Flood risk 1/10 · Minimal
- FEMA flood zone
- X (unshaded)
- Chance of flooding over 30 yrs
- 0.0%
- Est. flood insurance / yr
- $473 – $860
Fire risk 1/10 · Minimal
- Est. fire insurance / yr
- $1,054 – $1,958
Heat risk 5/10 · Moderate
- Hot days now (above 108°F)
- 7 days/yr
- Hot days in 30 yrs
- 21 days/yr
Wind risk 2/10 · Minimal
- Chance of severe wind over 30 yrs
- 1.0%
Air-quality risk 4/10 · Minor
- Unhealthy air days now
- 5 days/yr
- Unhealthy air days in 30 yrs
- 6 days/yr
Risk factors via First Street. Map © Google.
Why this score? — see what drove the B- grade
The composite is a weighted blend of 9 inputs, each scored 0–100. Each bar is that input's sub-score; the figure is the points it added to the 100-point composite (weight × sub-score).
- Cash flow +30.0/30.0
- 1% rule +10.0/10.0
- DSCR +10.0/10.0
- ARV discount +5.8/15.0
- Appreciation +3.3/10.0
- Rent growth +2.5/5.0
- Livability +2.5/5.0
- Condition / age +2.5/5.0
- Schools +1.2/10.0
$70,000
🖨 Deal sheet 📄 Offer letter ✓ Due diligence
Listing remarks
Come check out this Outstanding Opportunity to purchase this 3-bedroom brick home that is an excellent cholce for homeowners or investors seeking a standout restoration project offering value and space in North St. Louis. The home features beautiful built-ins, beamed ceilings, historic millwork, generous room sizes throughout, preserving much of the home's historic character. The main level highlights its timeless charm, strong architectural details, stained glass windows and solid construction provide an excellent foundation for renovation and added value. This home was damage by the recent tornado. Roof was replaced 4 months before the tornado. The furnace is 15 years old, the hot water h
Key facts
- 6,246 sq ft lot
- Built 1912
- Listed 26 days
Property features AI
Finance
- HOA & community: No association fees
Exterior
- Parking: On-street parking
- Utilities: Public water; Public sewer; Electricity connected; Natural gas connected; Cable available
- Home design: Single-family residence; Private ownership; Two levels; Entry on main level
- Construction: Brick and stone exterior; Shingle roof; Basement (full)
- Exterior features: Covered front porch; Back yard; Corner lot
Interior
- Kitchen: Kitchen (main level)
- Bedrooms: 3 bedrooms (all on upper level)
- Flooring: Wood floors
- Bathrooms: 1 full bath; 2 half baths
- Heating & cooling: Forced air heating; Central air conditioning; Ceiling fan(s)
- Interior features: Beamed ceilings; Built-in features; Ceiling fans; Walk-in closet(s); Full basement
- Laundry & utility: Laundry in basement; Gas water heater
Neighborhood map
What this means for you Summary
Snapshot
- This is a 3-bed/2.0-bath single-family listed at $70k.
Deal economics
- At list price, monthly cash flow is $426 ($5k/yr) — positive.
- The deal already cash-flows at list — no discount required.
- Meets the 1% rule at list price ($1k rent vs $70k).
- Recommended offer: $69k (1.5% below list) — sets the bar for market timing.
- Cap rate 13.6% vs local median 5.0% in St. Louis — top-decile yield for the area; either an underpriced asset or a hidden risk that comps aren't pricing in. Stress-test before assuming the spread holds.
Location & tenants
- Location reads: area grade B — affects rentability + tenant quality, not the cash-flow math above.
- St. Louis City (urban): math 10% / reading 18% proficiency, ranked #312 of 324 in MO (top 96%) — low school quality limits family demand, transient renter base, plan for 1-2y turnover; 80% free/reduced lunch — lower-income household profile, screen leases tightly.
- Zoned schools: Hickey Elem. (math 2% / reading 8%, grade F, #1,072 of 1,115 statewide, top 98%, 273 students, 99% FRL); Vashon High (math 2% / reading 2%, grade F, #520 of 521 statewide, top 100%, 568 students, 100% FRL) — zoned schools average 99% FRL vs 80% district-wide (19 pts higher); higher-poverty schools than district average — tighter screening recommended.
- Market conditions: 97 active listings in the ZIP; 7 comparable units currently listed for rent nearby; rentals lingering (median 44d on market — plan ~5-8 weeks vacancy on turnover, expect pricing pressure); 71% of comp listings sitting > 30 days — soft ceiling on asking rent; lower-income renter base — watch delinquency; 294 units permitted in St. Louis city in 2024 (227 in 5+ unit buildings).
- This rent runs 42% of the median local income ($31k/yr) — at the standard rent-burdened threshold; future hikes will face affordability resistance.
Forward outlook
- Local home prices are declining (-3.0%/yr); year-one equity from $484 of loan paydown is wiped out by about $2k of value loss. Plan a longer hold.
- St. Louis County population projected to shrink 6% by 2050 — rents likely to lag national; underwrite the cash flow, not the appreciation.
- At projected returns (-3.0% appreciation + 3.0% rent growth), your $20k cash investment doubles in ~5 years — after that, you're playing with house money.
Negotiation context
- It's been on market 27 days — a 2% lower offer ($69k) is reasonable based on typical stale-listing flexibility.
Risks & watch-outs
- Watch-outs: built in 1912 — expect roof / HVAC / electrical / plumbing capex.
- Climate carrying-cost: extreme-heat days projected 7→21/yr by 2055 (HVAC capex compounding) — expect insurance premiums to compound above CPI over the hold.
Questions for the listing agent
- Built in 1912 — when were the roof, HVAC, electrical panel, plumbing, and water heater last replaced?
- Is there a deadline driving the sale (1031 exchange, divorce, estate, relocation)? That informs how much negotiation room exists.
- What's the average days-on-market for RENTAL listings here right now (not sales)? A rising rental-DOM trend means longer vacancies and softer asking-rent achievability than the comps imply.
- What's the recent tenant-quality profile in this submarket — average credit score on applications, eviction rate, late-payment / NSF rate, and stable-employment percentage? A property-management company in the area should have these aggregated.
- How much new for-sale + rental construction is in the pipeline within 1–3 miles? Heavy new supply typically softens prices + rents 12–24 months out; constrained supply supports both.
Investment metrics
- 1% rule
- 1.54% ✓
- Cap rate
- 13.59%
- Cash-on-cash
- 26.06%
- DSCR
- 2.16
- GRM
- 5.4
CMA / ARV
- ARV (on-the-fly)
- $67,520
- Comps found
- 12
Show comp detail 12 sales within ~0.75 mi
| Address | Dist | Beds/Ba | Sqft | Sold | Price | $/sf | Match |
|---|---|---|---|---|---|---|---|
| 4454 Holly Ave | 0.22mi | 3/1.0 | 1,716 (+2%) | 4mo | $79,900 | $47 | 80 |
| 4261 Red Bud Ave | 0.17mi | 4/1.0 (+1) | 1,734 (+3%) | 2mo | $89,900 | $52 | 76 |
| 4545 Alice Ave Ave | 0.20mi | 4/1.5 (+1) | 1,681 (-0%) | 10mo | $38,000 | $23 | 75 |
| 4419 Holly Ave | 0.27mi | 4/1.5 (+1) | 1,700 (+1%) | 7mo | $65,000 | $38 | 74 |
| 4166 Farlin Ave | 0.44mi | 3/1.5 | 1,684 (-0%) | 6mo | $15,000 | $9 | 72 |
| 4536 Harris Ave | 0.07mi | 3/2.0 | 1,479 (-12%) | 22mo | $180,000 | $122 | 58 |
| 4526 Alice Ave | 0.21mi | 3/1.0 | 1,472 (-13%) | 11mo | $85,000 | $58 | 56 |
| 4111 E Lee Ave | 0.31mi | 3/1.0 | 1,550 (-8%) | 15mo | $70,000 | $45 | 55 |
| 4228 Red Bud Ave | 0.20mi | 3/1.5 | 1,452 (-14%) | 20mo | $39,900 | $27 | 49 |
| 4253 Holly Ave | 0.31mi | 4/1.0 (+1) | 1,468 (-13%) | 7mo | $32,800 | $22 | 49 |
| 2131 E De Soto Ave | 0.51mi | 3/1.0 | 1,496 (-11%) | 12mo | $59,900 | $40 | 43 |
| 4319 Prairie Ave | 0.55mi | 2/2.0 (-1) | 1,900 (+13%) | 15mo | $40,000 | $21 | 36 |
Match score weights: distance 35% · size 25% · config 20% · recency 20%. Top-matched comps best support the ARV.
Projected returns pro-forma
-3.0% appreciation · 3.0% rent growth · sell at horizon
- IRR
- 19.8%
- Equity multiple
- 1.80×
- Total profit
- $15,753
- Equity at exit
- $10,437
- IRR
- 28.0%
- Equity multiple
- 3.48×
- Total profit
- $48,556
- Equity at exit
- $6,052
Cash invested: $19,600 (down + closing). Projections, not guarantees.
Landlord ↔ Tenant lean methodology
- Overall (STATE)
- 81 Strongly Landlord-Friendly
- State Missouri
- 81 Strongly Landlord-Friendly · R+10
- County
- — inherits STATE
- City
- — inherits STATE
ZIP-level market 63115
- Home prices YoY
- -2.6%
- Active inventory
- 97
- Price-to-rent
- 5.4×
Monthly cashflow live
- Estimated rent
- $1,079 high interval (Pro) →
- Mortgage (P&I)
- −$367
- Tax from tax record
- −$31 /mo · $369/yr
- Insurance
- −$29
- HOA
- −$0
- Vacancy / Maint / Mgmt
- −$227
- Net cashflow
- $426
Break-even live
UW: 25.0% down · 7.5% · 30yr · 1.5% tax · 5.0% vac · 8.0% maint · 8.0% mgmt
Financing live
Cash to close
- Down payment
- $17,500
- Closing costs
- $2,100
- Reserves months
- —
- Total cash needed
- —
Loan-product check · same deal, 3 products live
Conventional
25% down · 7.5% · 30yr
- Down + closing
- —
- Monthly P&I
- —
- Monthly cashflow
- —
- DSCR
- —
- Eligible?
- —
Personal DTI + credit; lowest rate.
DSCR
20% down · 8.5% · 30yr
- Down + closing
- —
- Monthly P&I
- —
- Monthly cashflow
- —
- DSCR
- —
- Eligible?
- —
No personal income docs; deal must DSCR.
Hard money
10% down · 12.0% · 12mo
- Down + closing
- —
- Monthly P&I
- —
- Monthly cashflow
- —
- DSCR
- —
- Eligible?
- —
Short-term bridge; refi at stabilization.
Rent comps 7 comps
| Address | Beds | Baths | Sqft | Rent | $/sqft | DOM | Units | Dist |
|---|---|---|---|---|---|---|---|---|
| 4223 Red Bud Ave Unit 1F St. Louis, MO | 2.0 | 1.0 | 1167 | $895 | $0.77 | 43d | 1 | 0.21mi |
| 4202 Gano Ave Saint Louis, MO | 3.0 | 1.0 | 1650 | $1,168 | $0.71 | 23d | 1 | 0.67mi |
| 2046 Obear Ave Unit A St. Louis, MO | 3.0 | 1.5 | 1456 | $1,070 | $0.73 | 43d | 1 | 0.79mi |
| 4642 Farlin Ave Unit 1F St. Louis, MO | 2.0 | 1.0 | 1056 | $800 | $0.76 | 43d | 1 | 0.90mi |
| 4040 Shreve Ave Saint Louis, MO | 3.0 | 1.0 | 1201 | $1,250 | $1.04 | 43d | 1 | 1.04mi |
| 2207 Angelica St Unit 1 St. Louis, MO | 2.0 | 1.0 | 1734 | $1,350 | $0.78 | 43d | 1 | 1.12mi |
| 4247 Maffitt Ave St. Louis, MO | 3.0 | 1.5 | 1700 | $1,000 | $0.59 | 4d | 1 | 1.14mi |
Listing history 16 events
-
2026-06-18days on market $70,000 Active 27 DOM
-
2026-06-17days on market $70,000 Active 26 DOM
-
2026-06-16days on market $70,000 Active 25 DOM
-
2026-06-15days on market $70,000 Active 24 DOM
-
2026-06-13days on market $70,000 Active 22 DOM
-
2026-06-09days on market $70,000 Active 18 DOM
-
2026-06-08days on market $70,000 Active 17 DOM
-
2026-06-07days on market $70,000 Active 16 DOM
-
2026-06-05days on market $70,000 Active 13 DOM
-
2026-06-03days on market $70,000 Active 12 DOM
-
2026-06-02days on market $70,000 Active 11 DOM
-
2026-06-01days on market $70,000 Active 10 DOM
-
2026-05-31days on market $70,000 Active 9 DOM
-
2026-05-23$70,000 Active
-
2026-05-22historical $70,000
-
2000-04-26soldstatus $66,900
ⓘ Source: listings_history table (triggers on properties + properties_extension) + one-shot
backfill from property_details.listing_events for pre-trigger history.
Tax reassessment forecast MO · Resets to sale price
- Current annual tax
- $369 · $31/mo
- Projected year-2 tax
- $679 · $57/mo
- Expected delta
- +$310/yr (+$26/mo · 83.8%)
ⓘ Screening estimate from a state-policy table — verify with the county assessor before closing.
Climate risk First Street
- Flood 1/10 Low FEMA zone X (unshaded) · 0% chance over 30 yrs
- Wildfire 1/10 Low
- Heat 5/10 Major 7 d/yr ≥108°F today · 21 d/yr by 30 yrs out
- Wind 2/10 Low 100% chance of damaging wind over 30 yrs
- Air quality 4/10 Moderate 5 unhealthy d/yr today · 6 by 30 yrs out
Nearby sold comps map
Loading sold comps map…
Walkable amenities ~0.75 mi
Loading nearby amenities…
Taxation est. · year 1
- Rental income
- $12,953
- − Mortgage interest
- −$3,921
- − Property taxes
- −$369
- − Insurance
- −$350
- − Repairs & maintenance
- −$1,036
- − Management
- −$1,036
- − Depreciation
- −$2,036
- Taxable income
- $4,204
- Est. tax owed @ 24.0%
- −$1,009
- After-tax cash flow
- $4,100/yr
For passive investors: Depreciation is non-cash, so a rental often shows a tax loss while cash-flowing — sheltering income. Rental losses are passive: they offset passive income freely, and up to $25,000/yr can offset ordinary (W-2) income if you actively participate and your MAGI is under $100k (phasing out to $0 by $150k); unused losses carry forward. On sale, claimed depreciation is recaptured at up to 25%, and gains may owe capital-gains tax (a 1031 exchange can defer both). Figures are a year-1 estimate at your 24.0% rate — not tax advice; consult a CPA.
Schools (NCES district)
- District
- St. Louis City
- NCES district ID
- 2929280
- Math proficiency
- 10% ▼ -6.00%
- Reading proficiency
- 18% ▼ -3.00%
- Median HH income
- $35,685
- Composite
- 11.54/100
- National rank
- #9699
- State rank
- #312 of 324 in MO
Livability — St. Louis
No livability data for this city. (Only ~50 U.S. cities are tracked.)
Census & demographics
- Census place
- St. Louis, MO
- County
- Saint Louis City · 254,015 people
- City population
- 283,259
- Metro
- St. Louis, MO-IL
- Population (ZIP)
- 14,488
- Household income
- $30,622
- Rent vs Own
- Severe rent burden
- 1655.0
Population outlook (St. Louis County) Hauer SSP2
- Today (2025)
- 315,737 people
- By 2030
- 313,865 · -0.6%
- By 2040
- 305,439 · -3.3%
- By 2050
- 296,529 · -6.1%
- By 2075
- 271,028 · -14.2%
- By 2100
- 255,359 · -19.1%
Race, ethnicity, and origin ACS 2023
- Neighborhood character
- Predominantly Black (95%)
- Race & ethnicity
- Black 95% White 2% Two or more races 2%
- Foreign-born
- 0%
Political lean MEDSL · St. Louis
- 2024 margin
- Solid D (+64.7) · D 81.4% · R 16.7% · Other 2.0%
- 2008→2024 swing
- -3.5pp toward R · 2008: 68.2pp · 2024: 64.7pp
- All cycles
- 2024: D+64.7 2020: D+66.2 2016: D+63.7 2012: D+66.6 2008: D+68.2
Not yet ingested
- Civics
- —
Market trends
- HPI YoY
- ▼ -3.42%
- Current HPI
- 127.3403
- Rent YoY
- —
- Metro
- St. Louis, MO-IL
- State GDP YoY
- ▲ 1.84%
- F500 in state
- 20
Industry mix (Fortune 500 HQ in MO)
| Industry | F500 HQs | Revenue |
|---|---|---|
| Healthcare | 1 | $163B |
|
||
| Insurance | 1 | $21B |
|
||
| Industrial Technology | 1 | $17B |
|
||
| Retail | 1 | $16B |
|
||
| Industrial Distribution | 1 | $10B |
|
||
| Utilities | 1 | $9B |
|
||
Price history
+4.6% since first listed3 events — show timeline
- 2026-05-23 Listed $70,000 MARIS as Distributed by MLS Grid
- 2026-05-22 Coming Soon $70,000 MARIS as Distributed by MLS Grid
- 2000-04-26 Sold (Public Records) $66,900 Public Records
Property tax history
-0.9%/yrLatest (2023): $369 · -2.0% YoY. Source: county tax records.
Cash-flow waterfall
monthlySold comps — $/sqft
last 12 mo · ≤1 miLoading sold comps…