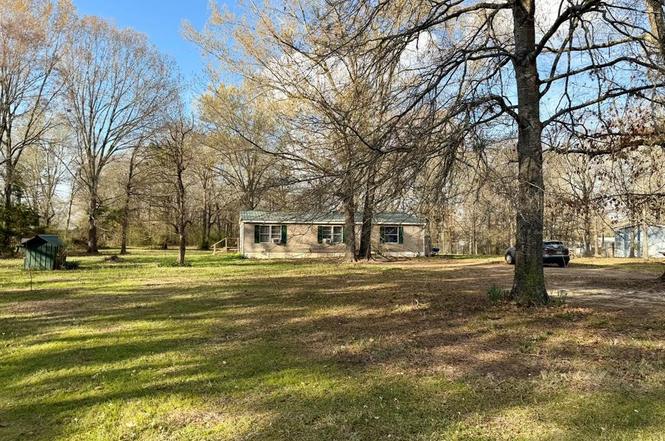
721 Richardson Rd · Stonewall, LA
Flood risk 1/10 · Minimal
- FEMA flood zone
- X (unshaded)
- Chance of flooding over 30 yrs
- 0.0%
- Est. flood insurance / yr
- $507 – $1,088
Fire risk 4/10 · Minor
- Est. fire insurance / yr
- $1,269 – $2,357
Heat risk 7/10 · Major
- Hot days now (above 110°F)
- 7 days/yr
- Hot days in 30 yrs
- 22 days/yr
Wind risk 6/10 · Moderate
- Chance of severe wind over 30 yrs
- 73.0%
Air-quality risk 2/10 · Minimal
- Unhealthy air days now
- 1 days/yr
- Unhealthy air days in 30 yrs
- 1 days/yr
Risk factors via First Street. Map © Google.
Why this score? — see what drove the B+ grade
The composite is a weighted blend of 9 inputs, each scored 0–100. Each bar is that input's sub-score; the figure is the points it added to the 100-point composite (weight × sub-score).
- Cash flow +30.0/30.0
- ARV discount +15.0/15.0
- DSCR +10.0/10.0
- 1% rule +9.1/10.0
- Livability +3.7/5.0
- Schools +3.5/10.0
- Rent growth +2.5/5.0
- Condition / age +2.5/5.0
- Appreciation +0.0/10.0
$72,000
🖨 Deal sheet 📄 Offer letter ✓ Due diligence
Listing remarks
Opportunity awaits! This 3 bedroom, 2 bathroom home sits on 1.11 acres in the desirable North DeSoto School District. While the home does need some TLC, it offers great bones and endless potential to transform it into something special. With plenty of space to work with and a fantastic location, this property is ready for someone to bring their vision to life.
Key facts
- Fantastic location
- Endless potential
- 1.11 acres
Tags
Property features AI
Finance
- HOA & community: No association
Exterior
- Parking: Driveway; Open parking
- Security: Smoke detector(s)
- Utilities: Septic
- Home design: Manufactured home; Attached property; One story; Built in 1999
- Construction: Metal roof; Pillar/post/pier foundation
- Exterior features: Deck; Lot approximately 1.11 acres
Interior
- Kitchen: Dishwasher; Electric range; Microwave
- Bedrooms: 3 bedrooms (all on level 1)
- Flooring: Laminate flooring
- Bathrooms: 2 full bathrooms
- Heating & cooling: Central heat; Central air conditioning
- Interior features: Eat-in kitchen; Kitchen island; Window coverings; One living area; One dining area; Room count: 3; Levels: One
- Laundry & utility: Utility room
Neighborhood map
What this means for you Summary
Snapshot
- This is a 3-bed/2.0-bath manufactured listed at $72k.
Deal economics
- At list price, monthly cash flow is $369 ($4k/yr) — positive.
- The deal already cash-flows at list — no discount required.
- Meets the 1% rule at list price ($1k rent vs $72k).
- Recommended offer: $66k (9.0% below list) — sets the bar for market timing.
- Cap rate 12.4% vs local median 1.2% in Stonewall — top-decile yield for the area; either an underpriced asset or a hidden risk that comps aren't pricing in. Stress-test before assuming the spread holds.
Location & tenants
- Location reads 73/100 on livability (#37 in LA) — a middle-class / working-renter tenant base. Strengths: crime A+, cost of living A+, housing A+; Watch: amenities F, commute F, health & safety F.
- Desoto Parish (rural): math 35% / reading 48% proficiency, ranked #21 of 98 in LA (top 21%) — families likely to look elsewhere, expect single-tenant / working-renter base with shorter leases.
- Market conditions: 95 active listings in the ZIP; 113 units permitted in De Soto Parish in 2024 (0 in 5+ unit buildings).
Forward outlook
- Local home prices are declining (-3.0%/yr); year-one equity from $498 of loan paydown is wiped out by about $2k of value loss. Plan a longer hold.
- De Soto County population projected at +8% by 2050 — modest demand growth; plan on rents tracking national, not racing it.
- At projected returns (-3.0% appreciation + 3.0% rent growth), your $20k cash investment doubles in ~6 years — after that, you're playing with house money.
Negotiation context
- It's been on market 99 days — a 9% lower offer ($66k) is reasonable based on typical stale-listing flexibility.
- Current owner paid $48k; list at $72k implies a 50% gain — meaningful room to come down on a strong offer.
Risks & watch-outs
- Climate carrying-cost: major wind risk, 73% chance of damaging wind over 30y; extreme-heat days projected 7→22/yr by 2055 (HVAC capex compounding) — expect insurance premiums to compound above CPI over the hold.
Questions for the listing agent
- It's been on market 99 days. Have you received any prior offers? Is the seller open to a 9% concession, seller financing, or rate buy-down credit?
- Why hasn't it sold? Are there any deal-killer items the seller is aware of (foundation, flood, title, zoning, code violations)?
- Is there a deadline driving the sale (1031 exchange, divorce, estate, relocation)? That informs how much negotiation room exists.
- Schools are A-rated — typically a magnet for longer-tenancy family renters. What's the average tenant stay here, and is there a school-zone premium baked into asking?
- What's the average days-on-market for RENTAL listings here right now (not sales)? A rising rental-DOM trend means longer vacancies and softer asking-rent achievability than the comps imply.
- What's the recent tenant-quality profile in this submarket — average credit score on applications, eviction rate, late-payment / NSF rate, and stable-employment percentage? A property-management company in the area should have these aggregated.
- How much new for-sale + rental construction is in the pipeline within 1–3 miles? Heavy new supply typically softens prices + rents 12–24 months out; constrained supply supports both.
Investment metrics
- 1% rule
- 1.41% ✓
- Cap rate
- 12.44%
- Cash-on-cash
- 21.96%
- DSCR
- 1.98
- GRM
- 5.9
CMA / ARV
- ARV (on-the-fly)
- $133,056
- Comps found
- 2
Show comp detail 2 sales within ~0.75 mi
| Address | Dist | Beds/Ba | Sqft | Sold | Price | $/sf | Match |
|---|---|---|---|---|---|---|---|
| 134 Kim Cir | 0.69mi | 3/2.0 | 1,216 (-10%) | 1mo | $109,000 | $90 | 51 |
| 144 Tina Cir | 0.66mi | 3/2.0 | 1,462 (+9%) | 7mo | $145,000 | $99 | 49 |
Match score weights: distance 35% · size 25% · config 20% · recency 20%. Top-matched comps best support the ARV.
Projected returns pro-forma
-3.0% appreciation · 3.0% rent growth · sell at horizon
- IRR
- 14.6%
- Equity multiple
- 1.59×
- Total profit
- $11,805
- Equity at exit
- $10,735
- IRR
- 23.3%
- Equity multiple
- 3.01×
- Total profit
- $40,441
- Equity at exit
- $6,225
Cash invested: $20,160 (down + closing). Projections, not guarantees.
Landlord ↔ Tenant lean methodology
- Overall (STATE)
- 90 Strongly Landlord-Friendly
- State Louisiana
- 90 Strongly Landlord-Friendly · R+12
- County
- — inherits STATE
- City
- — inherits STATE
ZIP-level market 71078
- Home prices YoY
- -15.9%
- Active inventory
- 95
- Price-to-rent
- 5.9×
Monthly cashflow live
- Estimated rent
- $1,019 medium interval (Pro) →
- Mortgage (P&I)
- −$378
- Tax from tax record
- −$28 /mo · $339/yr
- Insurance
- −$30
- HOA
- −$0
- Vacancy / Maint / Mgmt
- −$214
- Net cashflow
- $369
Break-even live
Sensitivity live
| Price | -10% $410 | -5% $389 | +0% $369 | +5% $349 | +10% $328 |
|---|---|---|---|---|---|
| Rent | -10% $288 | -5% $329 | +0% $369 | +5% $409 | +10% $449 |
| Rate | -1.0pp $405 | -0.5pp $387 | base $369 | +0.5pp $350 | +1.0pp $331 |
UW: 25.0% down · 7.5% · 30yr · 1.5% tax · 5.0% vac · 8.0% maint · 8.0% mgmt
Financing live
Cash to close
- Down payment
- $18,000
- Closing costs
- $2,160
- Reserves months
- —
- Total cash needed
- —
Loan-product check · same deal, 3 products live
Conventional
25% down · 7.5% · 30yr
- Down + closing
- —
- Monthly P&I
- —
- Monthly cashflow
- —
- DSCR
- —
- Eligible?
- —
Personal DTI + credit; lowest rate.
DSCR
20% down · 8.5% · 30yr
- Down + closing
- —
- Monthly P&I
- —
- Monthly cashflow
- —
- DSCR
- —
- Eligible?
- —
No personal income docs; deal must DSCR.
Hard money
10% down · 12.0% · 12mo
- Down + closing
- —
- Monthly P&I
- —
- Monthly cashflow
- —
- DSCR
- —
- Eligible?
- —
Short-term bridge; refi at stabilization.
Listing history 17 events
-
2026-06-18days on market $72,000 Active 99 DOM
-
2026-06-17days on market $72,000 Active 98 DOM
-
2026-06-16days on market $72,000 Active 97 DOM
-
2026-06-15days on market $72,000 Active 96 DOM
-
2026-06-14days on market $72,000 Active 94 DOM
-
2026-06-13pricedays on market $72,000 Active 93 DOM
-
2026-06-10days on market $79,900 Active 91 DOM
-
2026-06-09days on market $79,900 Active 90 DOM
-
2026-06-08days on market $79,900 Active 89 DOM
-
2026-06-07days on market $79,900 Active 88 DOM
-
2026-06-02days on market $79,900 Active 83 DOM
-
2026-06-01days on market $79,900 Active 82 DOM
-
2026-05-31days on market $79,900 Active 81 DOM
-
2026-05-30days on market $79,900 Active 80 DOM
-
2026-03-26price $79,900
-
2026-03-09$89,900 Active
-
2009-06-23soldstatus $48,000
ⓘ Source: listings_history table (triggers on properties + properties_extension) + one-shot
backfill from property_details.listing_events for pre-trigger history.
Tax reassessment forecast LA · Resets to sale price
- Current annual tax
- $339 · $28/mo
- Projected year-2 tax
- $396 · $33/mo
- Expected delta
- +$57/yr (+$5/mo · 17.0%)
ⓘ Screening estimate from a state-policy table — verify with the county assessor before closing.
Climate risk First Street
- Flood 1/10 Low FEMA zone X (unshaded) · 0% chance over 30 yrs
- Wildfire 4/10 Moderate
- Heat 7/10 Severe 7 d/yr ≥110°F today · 22 d/yr by 30 yrs out
- Wind 6/10 Major 73% chance of damaging wind over 30 yrs
- Air quality 2/10 Low 1 unhealthy d/yr today · 1 by 30 yrs out
Nearby sold comps map
Loading sold comps map…
Walkable amenities ~0.75 mi
Loading nearby amenities…
Taxation est. · year 1
- Rental income
- $12,223
- − Mortgage interest
- −$4,033
- − Property taxes
- −$339
- − Insurance
- −$360
- − Repairs & maintenance
- −$978
- − Management
- −$978
- − Depreciation
- −$2,095
- Taxable income
- $3,441
- Est. tax owed @ 24.0%
- −$826
- After-tax cash flow
- $3,601/yr
For passive investors: Depreciation is non-cash, so a rental often shows a tax loss while cash-flowing — sheltering income. Rental losses are passive: they offset passive income freely, and up to $25,000/yr can offset ordinary (W-2) income if you actively participate and your MAGI is under $100k (phasing out to $0 by $150k); unused losses carry forward. On sale, claimed depreciation is recaptured at up to 25%, and gains may owe capital-gains tax (a 1031 exchange can defer both). Figures are a year-1 estimate at your 24.0% rate — not tax advice; consult a CPA.
Schools (NCES district)
- District
- Desoto Parish
- NCES district ID
- 2200510
- Math proficiency
- 35% ▼ -37.00%
- Reading proficiency
- 48% ▼ -31.00%
- Median HH income
- $40,201
- Composite
- 34.75/100
- National rank
- #5130
- State rank
- #21 of 98 in LA
Livability — Stonewall
- Score
- 73/100
- State rank
- #37
- US rank
- #5606
Category grades
Schools grade is shown separately in the Schools card above.
Census & demographics
- City population
- 7,713
- Population (ZIP)
- 7,713
Population outlook (De Soto County) Hauer SSP2
- Today (2025)
- 28,142 people
- By 2030
- 28,546 · +1.4%
- By 2040
- 29,357 · +4.3%
- By 2050
- 30,239 · +7.5%
- By 2075
- 33,412 · +18.7%
- By 2100
- 35,428 · +25.9%
Race, ethnicity, and origin ACS 2023
- Neighborhood character
- Predominantly White (89%)
- Race & ethnicity
- White 89% Hispanic / Latino 5% Black 4% Two or more races 4% Native American 1%
- Common ancestry
- Lithuanian 3% Portuguese 3% Slovak 1%
- Foreign-born
- 0%
- Languages at home
- 98% English-only · Spanish 1%
Political lean MEDSL · De Soto
- 2024 margin
- Solid R (+35.5) · D 31.8% · R 67.3%
- 2008→2024 swing
- -22.1pp toward R · 2008: -13.4pp · 2024: -35.5pp
- All cycles
- 2024: R+35.5 2020: R+24.8 2016: R+21.5 2012: R+13.8 2008: R+13.4
Not yet ingested
- Civics
- —
Market trends
- HPI YoY
- ▼ -35.17%
- Current HPI
- 186.3398
- Rent YoY
- —
- Metro
- —
- State GDP YoY
- ▲ 3.29%
- F500 in state
- 10
Industry mix (Fortune 500 HQ in LA)
| Industry | F500 HQs | Revenue |
|---|---|---|
| Telecommunications | 2 | $23B |
|
||
| Utilities | 1 | $12B |
|
||
| Wholesale / Distribution | 1 | $5B |
|
||
| Advertising | 1 | $2B |
|
||
Price history
+66.5% since first listed3 events — show timeline
- 2026-03-26 Price Changed $79,900 NTREIS
- 2026-03-09 Listed $89,900 NTREIS
- 2009-06-23 Sold (Public Records) $48,000 Public Records
Property tax history
+3.0%/yrLatest (2025): $339 · +0.0% YoY. Source: county tax records.
Cash-flow waterfall
monthlySold comps — $/sqft
last 12 mo · ≤1 miLoading sold comps…