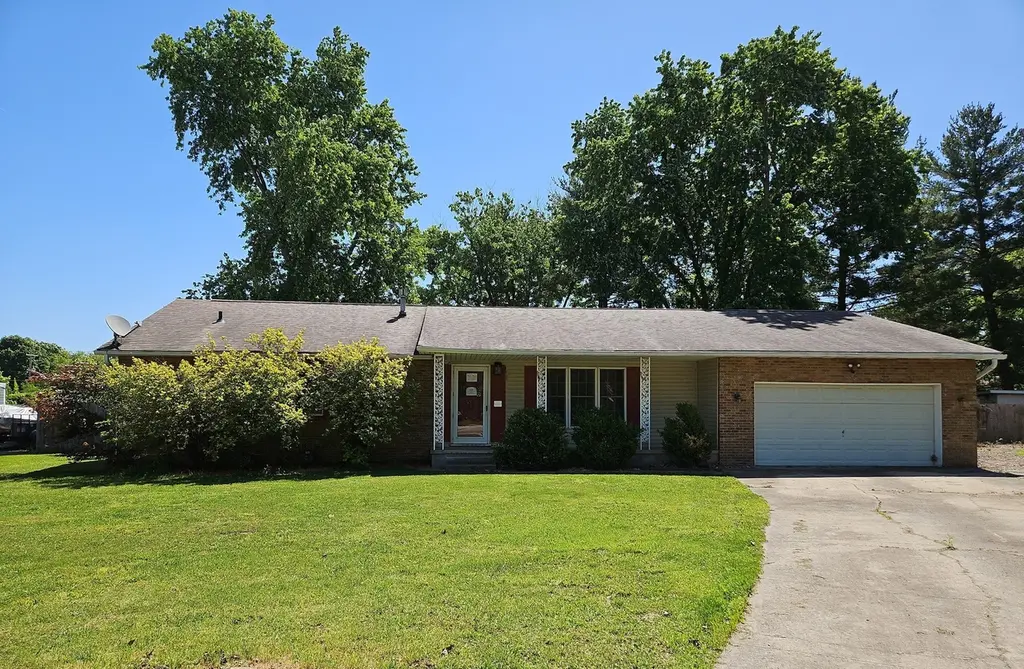
142 Fielder Dr · Salem, IL
Flood risk 1/10 · Minimal
- FEMA flood zone
- X (unshaded)
- Chance of flooding over 30 yrs
- 0.0%
- Est. flood insurance / yr
- $473 – $860
Fire risk 1/10 · Minimal
- Est. fire insurance / yr
- $804 – $1,492
Heat risk 4/10 · Minor
- Hot days now (above 106°F)
- 7 days/yr
- Hot days in 30 yrs
- 20 days/yr
Wind risk 2/10 · Minimal
- Chance of severe wind over 30 yrs
- 2.0%
Air-quality risk 2/10 · Minimal
- Unhealthy air days now
- 1 days/yr
- Unhealthy air days in 30 yrs
- 2 days/yr
Risk factors via First Street. Map © Google.
Why this score? — see what drove the B- grade
The composite is a weighted blend of 9 inputs, each scored 0–100. Each bar is that input's sub-score; the figure is the points it added to the 100-point composite (weight × sub-score).
- Cash flow +30.0/30.0
- 1% rule +10.0/10.0
- DSCR +10.0/10.0
- ARV discount +7.5/15.0
- Livability +3.4/5.0
- Schools +2.6/10.0
- Rent growth +2.5/5.0
- Condition / age +2.5/5.0
- Appreciation +0.0/10.0
$71,000
🖨 Deal sheet 📄 Offer letter ✓ Due diligence
Listing remarks
3 bedroom, 2 bath ranch styled home located on a cul-de-sac in Selmaville Grade School district. Seller's name is The Secretary of The United States Department of Veterans Affairs. Seller does not pay customary closing costs: including title policy, escrow fees, survey or transfer fees. Proof of funds required on cash transactions: Lender pre-approval letter for all financed offers (dated within 30 days) This property MAY qualify for Seller financing. (Vendee). If property was built prior to 1978, Lead Based Paint Potentially Exists. This home failed a pressure test at winterization and no water will be turned on for a buyers inspection or appraisal.
Key facts
- 2 garage spots
- Built 1975
- Listed 13 days
Property features AI
Finance
- Other: Subdivision: Great Oaks; Directions: Rt. 37 south to Kell Street. Turn right. First left onto Fielder.
- HOA & community: No master association fee required
Exterior
- Parking: Attached garage with garage door opener; Gravel parking; Two garage spaces (two total parking spaces)
- Utilities: Public water; Public sewer
- Home design: Detached single-family home; One-story layout; Fee simple ownership; Built approximately 51–60 years ago; Built before 1978; School bus service available
- Construction: Frame construction
- Exterior features: Patio; Fenced yard; Lot dimensions approximately 45 x 110 x 165 x 149
Interior
- Kitchen: Kitchen with tile flooring (22 x 11)
- Bedrooms: Three bedrooms (all on main level); Master bedroom on main level with full bath
- Flooring: Tile flooring in kitchen and laundry
- Bathrooms: Two full bathrooms
- Heating & cooling: Natural gas heat with forced air; Central air conditioning
- Interior features: Five total rooms; Crawl space basement
- Laundry & utility: Main-level laundry room with tile flooring (9 x 11)
Neighborhood map
What this means for you Summary
Snapshot
- This is a 3-bed/2.0-bath single-family listed at $71k.
Deal economics
- At list price, monthly cash flow is $350 ($4k/yr) — positive.
- The deal already cash-flows at list — no discount required.
- Meets the 1% rule at list price ($1k rent vs $71k).
- Cap rate 12.2% vs local median 5.6% in Salem — top-decile yield for the area; either an underpriced asset or a hidden risk that comps aren't pricing in. Stress-test before assuming the spread holds.
Location & tenants
- Location reads 68/100 on livability (#467 in IL) — a middle-class / working-renter tenant base. Strengths: cost of living A+, housing A+, health & safety A+; Watch: amenities F, commute F, employment D-.
- Salem Chsd 600 (town): math 25% / reading 30% proficiency, ranked #571 of 919 in IL (top 62%) — low school quality limits family demand, transient renter base, plan for 1-2y turnover.
- Zoned schools: Salem Community High School (math 22% / reading 17%, grade F, #397 of 693 statewide, top 61%, 732 students, 0% FRL).
- Market conditions: 48 active listings in the ZIP; 2 units permitted in Marion County in 2024 (0 in 5+ unit buildings).
Forward outlook
- Local home prices are declining (-3.0%/yr); year-one equity from $491 of loan paydown is wiped out by about $2k of value loss. Plan a longer hold.
- Marion County population projected at -20% by 2050 — secular population decline; favor cash flow + early exit over multi-decade hold.
- At projected returns (-3.0% appreciation + 3.0% rent growth), your $20k cash investment doubles in ~6 years — after that, you're playing with house money.
Negotiation context
- Only 13 days on market — expect competitive offers; lowballing is unlikely to land.
- 7 sale attempts since 20y ago with the ask held roughly flat each time — persistent listings suggest the price (not the market) is what's stuck; bring a comps-based counter.
Risks & watch-outs
- Watch-outs: property tax is 3.8% of price.
Questions for the listing agent
- Built in 1975 — when were the roof, HVAC, electrical panel, plumbing, and water heater last replaced?
- Property tax is high relative to price — has the assessment been appealed recently, and will the sale trigger a re-assessment?
- Is there a deadline driving the sale (1031 exchange, divorce, estate, relocation)? That informs how much negotiation room exists.
- Schools are D-rated, which usually means shorter tenancies and higher turnover. Who's the typical renter profile here, and what's been the actual vacancy rate?
- What's the average days-on-market for RENTAL listings here right now (not sales)? A rising rental-DOM trend means longer vacancies and softer asking-rent achievability than the comps imply.
- What's the recent tenant-quality profile in this submarket — average credit score on applications, eviction rate, late-payment / NSF rate, and stable-employment percentage? A property-management company in the area should have these aggregated.
- How much new for-sale + rental construction is in the pipeline within 1–3 miles? Heavy new supply typically softens prices + rents 12–24 months out; constrained supply supports both.
Investment metrics
- 1% rule
- 1.74% ✓
- Cap rate
- 12.20%
- Cash-on-cash
- 21.11%
- DSCR
- 1.94
- GRM
- 4.8
CMA / ARV
- ARV (on-the-fly)
- $190,872
- Comps found
- 4
Show comp detail 4 sales within ~0.75 mi
| Address | Dist | Beds/Ba | Sqft | Sold | Price | $/sf | Match |
|---|---|---|---|---|---|---|---|
| 119 Fielder Dr | 0.12mi | 3/2.0 | 1,432 (-1%) | 8mo | $188,000 | $131 | 87 |
| 136 Donoho Dr | 0.08mi | 4/2.0 (+1) | 1,440 (-0%) | 17mo | $168,000 | $117 | 76 |
| 112 Donoho Dr | 0.16mi | 4/2.5 (+1) | 1,632 (+13%) | 1mo | $215,000 | $132 | 63 |
| 124 Donoho Dr | 0.11mi | 3/1.5 | 1,232 (-15%) | 15mo | $172,000 | $140 | 55 |
Match score weights: distance 35% · size 25% · config 20% · recency 20%. Top-matched comps best support the ARV.
Projected returns pro-forma
-3.0% appreciation · 3.0% rent growth · sell at horizon
- IRR
- 13.7%
- Equity multiple
- 1.55×
- Total profit
- $10,873
- Equity at exit
- $10,586
- IRR
- 22.6%
- Equity multiple
- 2.94×
- Total profit
- $38,564
- Equity at exit
- $6,139
Cash invested: $19,880 (down + closing). Projections, not guarantees.
Landlord ↔ Tenant lean methodology
- Overall (STATE)
- 43 Moderately Tenant-Leaning
- State Illinois
- 43 Moderately Tenant-Leaning · D+7
- County
- — inherits STATE
- City
- — inherits STATE
ZIP-level market 62881
- Home prices YoY
- -28.0%
- Active inventory
- 48
- Price-to-rent
- 4.8×
Monthly cashflow live
- Estimated rent
- $1,234 medium interval (Pro) →
- Mortgage (P&I)
- −$372
- Tax from tax record
- −$223 /mo · $2,682/yr
- Insurance
- −$30
- HOA
- −$0
- Vacancy / Maint / Mgmt
- −$259
- Net cashflow
- $350
Break-even live
UW: 25.0% down · 7.5% · 30yr · 1.5% tax · 5.0% vac · 8.0% maint · 8.0% mgmt
Financing live
Cash to close
- Down payment
- $17,750
- Closing costs
- $2,130
- Reserves months
- —
- Total cash needed
- —
Loan-product check · same deal, 3 products live
Conventional
25% down · 7.5% · 30yr
- Down + closing
- —
- Monthly P&I
- —
- Monthly cashflow
- —
- DSCR
- —
- Eligible?
- —
Personal DTI + credit; lowest rate.
DSCR
20% down · 8.5% · 30yr
- Down + closing
- —
- Monthly P&I
- —
- Monthly cashflow
- —
- DSCR
- —
- Eligible?
- —
No personal income docs; deal must DSCR.
Hard money
10% down · 12.0% · 12mo
- Down + closing
- —
- Monthly P&I
- —
- Monthly cashflow
- —
- DSCR
- —
- Eligible?
- —
Short-term bridge; refi at stabilization.
Listing history 16 events
-
2026-05-15$71,000 Active
-
2021-08-06historical
-
2021-08-06historical
-
2016-04-14soldstatus $85,000
-
2016-04-14soldstatus $85,000
-
2015-04-25$89,900
-
2015-04-25$89,900
-
2008-08-20soldstatus $87,000
-
2008-08-20soldstatus $87,000
-
2008-04-22$89,500
-
2008-04-22$89,500
-
2007-03-30soldstatus $84,000
-
2007-03-30soldstatus $84,000
-
2006-08-17$89,900
-
2006-08-17$89,900
-
2006-08-16historical
ⓘ Source: listings_history table (triggers on properties + properties_extension) + one-shot
backfill from property_details.listing_events for pre-trigger history.
Tax reassessment forecast IL · Partial reset (capped growth)
- Current annual tax
- $2,682 · $223/mo
- Projected year-2 tax
- $2,682 · $223/mo
- Expected delta
- $0/yr ($0/mo · 0.0%)
ⓘ Screening estimate from a state-policy table — verify with the county assessor before closing.
Climate risk First Street
- Flood 1/10 Low FEMA zone X (unshaded) · 0% chance over 30 yrs
- Wildfire 1/10 Low
- Heat 4/10 Moderate 7 d/yr ≥106°F today · 20 d/yr by 30 yrs out
- Wind 2/10 Low 2% chance of damaging wind over 30 yrs
- Air quality 2/10 Low 1 unhealthy d/yr today · 2 by 30 yrs out
Nearby sold comps map
Loading sold comps map…
Walkable amenities ~0.75 mi
Loading nearby amenities…
Taxation est. · year 1
- Rental income
- $14,813
- − Mortgage interest
- −$3,977
- − Property taxes
- −$2,682
- − Insurance
- −$355
- − Repairs & maintenance
- −$1,185
- − Management
- −$1,185
- − Depreciation
- −$2,065
- Taxable income
- $3,363
- Est. tax owed @ 24.0%
- −$807
- After-tax cash flow
- $3,390/yr
For passive investors: Depreciation is non-cash, so a rental often shows a tax loss while cash-flowing — sheltering income. Rental losses are passive: they offset passive income freely, and up to $25,000/yr can offset ordinary (W-2) income if you actively participate and your MAGI is under $100k (phasing out to $0 by $150k); unused losses carry forward. On sale, claimed depreciation is recaptured at up to 25%, and gains may owe capital-gains tax (a 1031 exchange can defer both). Figures are a year-1 estimate at your 24.0% rate — not tax advice; consult a CPA.
Schools (NCES district)
- District
- Salem Chsd 600
- NCES district ID
- 1735190
- Math proficiency
- 25% ▲ 10.00%
- Reading proficiency
- 30% ▲ 5.00%
- Median HH income
- $39,305
- Composite
- 26.04/100
- National rank
- #12738
- State rank
- #571 of 919 in IL
Livability — Salem
- Score
- 68/100
- State rank
- #467
- US rank
- #9634
Category grades
Schools grade is shown separately in the Schools card above.
Census & demographics
- Census place
- Salem, IL
- City population
- 11,218
- Population (ZIP)
- 11,218
Population outlook (Marion County) Hauer SSP2
- Today (2025)
- 36,071 people
- By 2030
- 34,598 · -4.1%
- By 2040
- 31,754 · -12.0%
- By 2050
- 28,912 · -19.8%
- By 2075
- 22,527 · -37.5%
- By 2100
- 16,455 · -54.4%
Race, ethnicity, and origin ACS 2023
- Neighborhood character
- Predominantly White (93%)
- Race & ethnicity
- White 93% Black 3% Two or more races 2%
- Common ancestry
- Romanian 2% Italian 2% Iranian 2%
- Foreign-born
- 1%
- Languages at home
- 99% English-only · Spanish 1%
Political lean MEDSL · Marion
- 2024 margin
- Solid R (+49.5) · D 24.6% · R 74.1% · Other 1.4%
- 2008→2024 swing
- -47.5pp toward R · 2008: -2.0pp · 2024: -49.5pp
- All cycles
- 2024: R+49.5 2020: R+46.6 2016: R+44.9 2012: R+19.2 2008: R+2.0
Not yet ingested
- Civics
- —
Market trends
- HPI YoY
- ▼ -63.16%
- Current HPI
- 162.55
- Rent YoY
- —
- Metro
- —
- State GDP YoY
- ▲ 1.59%
- F500 in state
- 60
Industry mix (Fortune 500 HQ in IL)
| Industry | F500 HQs | Revenue |
|---|---|---|
| Insurance | 4 | $201B |
|
||
| Consumer Goods | 4 | $87B |
|
||
| Industrial Machinery | 3 | $64B |
|
||
| Healthcare | 2 | $55B |
|
||
| Retail / Pharmacy | 1 | $148B |
|
||
| Agriculture / Food | 1 | $86B |
|
||
Price history
-21.0% since first listed16 events — show timeline
- 2026-05-15 Listed $71,000 MRED as Distributed by MLS Grid
- 2021-08-06 Listing Removed — RMLSA as Distributed by MLS Grid
- 2021-08-06 Listing Removed — RMLSA as Distributed by MLS Grid
- 2016-04-14 Sold (MLS) $85,000 MRED as Distributed by MLS Grid
- 2016-04-14 Sold (MLS) $85,000 RMLSA as Distributed by MLS Grid
- 2015-04-25 Listed $89,900 MRED as Distributed by MLS Grid
- 2015-04-25 Listed $89,900 RMLSA as Distributed by MLS Grid
- 2008-08-20 Sold (MLS) $87,000 RMLSA as Distributed by MLS Grid
- 2008-08-20 Sold (MLS) $87,000 MRED as Distributed by MLS Grid
- 2008-04-22 Listed $89,500 RMLSA as Distributed by MLS Grid
- 2008-04-22 Listed $89,500 MRED as Distributed by MLS Grid
- 2007-03-30 Sold (MLS) $84,000 MRED as Distributed by MLS Grid
- 2007-03-30 Sold (MLS) $84,000 RMLSA as Distributed by MLS Grid
- 2006-08-17 Listed $89,900 MRED as Distributed by MLS Grid
- 2006-08-17 Listed $89,900 RMLSA as Distributed by MLS Grid
- 2006-08-16 Listing Removed — MRED as Distributed by MLS Grid
Property tax history
+2.0%/yrLatest (2024): $2,682 · -0.4% YoY. Source: county tax records.
Cash-flow waterfall
monthlySold comps — $/sqft
last 12 mo · ≤1 miLoading sold comps…