2746 Columbia Ln #7 · Heber-Overgaard, AZ
Flood risk 1/10 · Minimal
- FEMA flood zone
- X (unshaded)
- Chance of flooding over 30 yrs
- 0.0%
- Est. flood insurance / yr
- $507 – $1,088
Fire risk 7/10 · Major
- Est. fire insurance / yr
- $610 – $1,132
Heat risk 2/10 · Minimal
- Hot days now (above 87°F)
- 7 days/yr
- Hot days in 30 yrs
- 18 days/yr
Wind risk 1/10 · Minimal
- Chance of severe wind over 30 yrs
- —
Air-quality risk 1/10 · Minimal
- Unhealthy air days now
- 0 days/yr
- Unhealthy air days in 30 yrs
- 0 days/yr
Risk factors via First Street. Map © Google.
Why this score? — see what drove the D grade
The composite is a weighted blend of 9 inputs, each scored 0–100. Each bar is that input's sub-score; the figure is the points it added to the 100-point composite (weight × sub-score).
- Cash flow +16.4/30.0
- DSCR +5.1/10.0
- Condition / age +4.8/5.0
- 1% rule +4.5/10.0
- Schools +4.0/10.0
- ARV discount +2.9/15.0
- Rent growth +2.5/5.0
- Livability +2.5/5.0
- Appreciation +0.0/10.0
$140,000
🖨 Deal sheet (PDF) 📄 Offer letter ✓ Due diligence
Listing remarks MLS
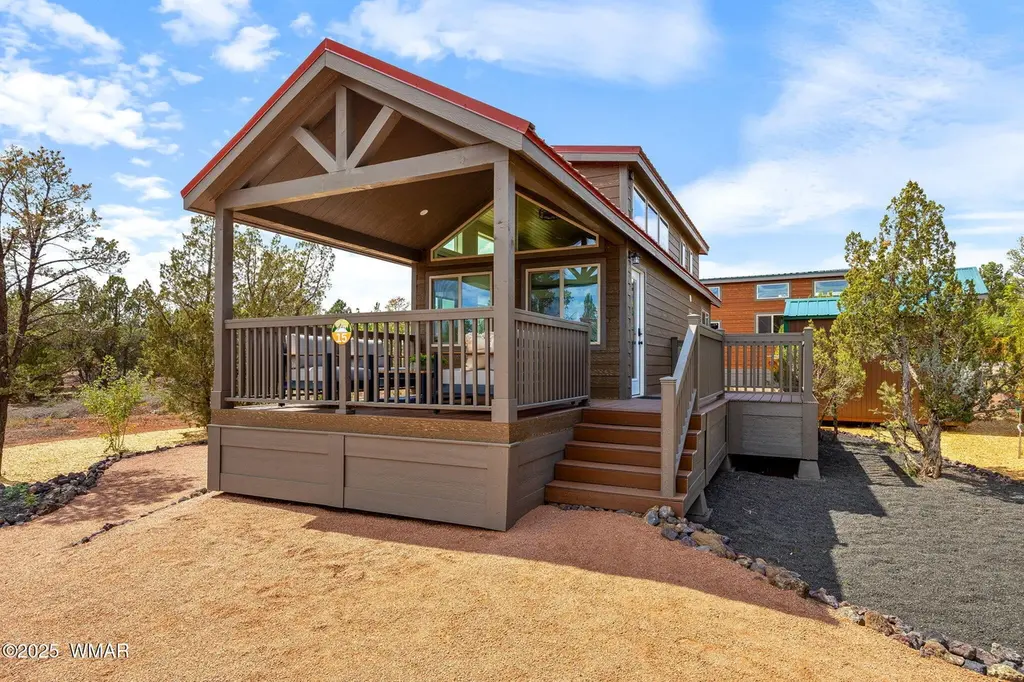
Discover the perfect family getaway or potential rental income with this delightful cabin located in the Rocky Rim Resort community. These 1-bedroom Park Model homes are approximately 400 sf and include a covered porch and additional loft space. Along with the cabin, the space includes two parking spaces, outdoor patio area, landscaping, and use of all community amenities. Enjoy the community splash pad, ramadas, playground and grass family play area. The surrounding area is home to spectacular hiking, fishing, hunting, kayaking, ATV trails, and wildlife. Home is not yet built. Photos are of the model, space #15, and are representative of the floorplan. Don't miss your opportunity to own a piece of serenity in Rocky Rim Resort. ** There is no full time living**
Key facts
- Covered porch
- Ramadas
- Community splash pad
Tags
Neighborhood map
What this means for you Summary
Snapshot
- This is a 1-bed/1.0-bath single-family listed at $140k. Condition is rated excellent.
Deal economics
- At list price, monthly cash flow is $79 ($950/yr) — positive.
- The deal already cash-flows at list — no discount required.
- To meet the 1% rule (rent ≥ 1% of price), the offer needs to be $132k (5.4% below list).
- Recommended offer: $132k (6.0% below list) — sets the bar for market timing.
- Cap rate 7.0% vs local median 3.2% in Heber-Overgaard — top-decile yield for the area; either an underpriced asset or a hidden risk that comps aren't pricing in. Stress-test before assuming the spread holds.
Location & tenants
- Location reads: area grade D — affects rentability + tenant quality, not the cash-flow math above.
- Heber-Overgaard Unified District (4392) (rural): math 52% / reading 45% proficiency, ranked #51 of 249 in AZ (top 20%) — families likely to look elsewhere, expect single-tenant / working-renter base with shorter leases.
- Zoned schools: Mountain Meadows Primary (math 70% / reading 50%, grade B-, #148 of 1,109 statewide, top 15%, 143 students, 43% FRL); Mogollon Jr High School (math 42% / reading 32%, grade F, #57 of 218 statewide, top 27%, 77 students, 0% FRL); Mogollon High School (math 30% / reading 30%, grade F, #116 of 381 statewide, top 31%, 167 students, 32% FRL) — zoned schools average 25% FRL vs 50% district-wide (25 pts lower); this property's tenant base skews higher-income than the district average.
- Market conditions: 258 active listings in the ZIP; 485 units permitted in Navajo County in 2024 (11 in 5+ unit buildings).
Forward outlook
- Local home prices are declining (-3.0%/yr); year-one equity from $968 of loan paydown is wiped out by about $4k of value loss. Plan a longer hold.
- Navajo County population projected at -16% by 2050 — secular population decline; favor cash flow + early exit over multi-decade hold.
Negotiation context
- It's been on market 83 days — a 6% lower offer ($132k) is reasonable based on typical stale-listing flexibility.
Risks & watch-outs
- Climate carrying-cost: major wildfire risk — expect insurance premiums to compound above CPI over the hold.
Questions for the listing agent
- It's been on market 83 days. Have you received any prior offers? Is the seller open to a 6% concession, seller financing, or rate buy-down credit?
- Why hasn't it sold? Are there any deal-killer items the seller is aware of (foundation, flood, title, zoning, code violations)?
- Is there a deadline driving the sale (1031 exchange, divorce, estate, relocation)? That informs how much negotiation room exists.
- The area grade is low — what's the realistic commute time and amenity access for the typical tenant pool here? Any planned neighborhood developments (good or bad) we should know about?
- What's the average days-on-market for RENTAL listings here right now (not sales)? A rising rental-DOM trend means longer vacancies and softer asking-rent achievability than the comps imply.
- What's the recent tenant-quality profile in this submarket — average credit score on applications, eviction rate, late-payment / NSF rate, and stable-employment percentage? A property-management company in the area should have these aggregated.
- How much new for-sale + rental construction is in the pipeline within 1–3 miles? Heavy new supply typically softens prices + rents 12–24 months out; constrained supply supports both.
Investment metrics
- 1% rule
- 0.95% ✗
- Cap rate
- 6.97%
- Cash-on-cash
- 2.42%
- DSCR
- 1.11
- GRM
- 8.8
CMA / ARV
- ARV (median comp)
- $126,983
- List price
- $140,000
- Delta
- 10.25%
- Verdict
- OVERPRICED
- Comps
- 8 within 2.0 mi
Show comp detail 1 sale within ~0.75 mi
| Address | Dist | Beds/Ba | Sqft | Sold | Price | $/sf | Match |
|---|---|---|---|---|---|---|---|
| 2746 Columbia Ln #13 | 0.00mi | 1/1.0 | 400 (0%) | 10mo | $135,000 | $338 | 92 |
Match score weights: distance 35% · size 25% · config 20% · recency 20%. Top-matched comps best support the ARV.
Projected returns pro-forma
-3.0% appreciation · 3.0% rent growth · sell at horizon
- IRR
- -12.4%
- Equity multiple
- 0.55×
- Total profit
- $-17,622
- Equity at exit
- $20,874
- IRR
- -3.3%
- Equity multiple
- 0.78×
- Total profit
- $-8,769
- Equity at exit
- $12,105
Cash invested: $39,200 (down + closing). Projections, not guarantees.
Landlord ↔ Tenant lean methodology
- Overall (STATE)
- 87 Strongly Landlord-Friendly
- State Arizona
- 87 Strongly Landlord-Friendly · R+3
- County
- — inherits STATE
- City
- — inherits STATE
ZIP-level market 85933
- Home prices YoY
- -18.9%
- Active inventory
- 258
- Price-to-rent
- 8.8×
Monthly cashflow live
- Estimated rent
- $1,325 medium interval (Pro) →
- Mortgage (P&I)
- −$734
- Tax est. 1.5%
- −$175 /mo · $2,100/yr
- Insurance
- −$58
- HOA
- −$0
- Vacancy / Maint / Mgmt
- −$278
- Net cashflow
- $79
Break-even live
Sensitivity live
| Price | -10% $176 | -5% $128 | +0% $79 | +5% $31 | +10% $-18 |
|---|---|---|---|---|---|
| Rent | -10% $-25 | -5% $27 | +0% $79 | +5% $132 | +10% $184 |
| Rate | -1.0pp $150 | -0.5pp $115 | base $79 | +0.5pp $43 | +1.0pp $6 |
UW: 25.0% down · 7.5% · 30yr · 1.5% tax · 5.0% vac · 8.0% maint · 8.0% mgmt
Financing live
Cash to close
- Down payment
- $35,000
- Closing costs
- $4,200
- Reserves months
- —
- Total cash needed
- —
Loan-product check · same deal, 3 products live
Conventional
25% down · 7.5% · 30yr
- Down + closing
- —
- Monthly P&I
- —
- Monthly cashflow
- —
- DSCR
- —
- Eligible?
- —
Personal DTI + credit; lowest rate.
DSCR
20% down · 8.5% · 30yr
- Down + closing
- —
- Monthly P&I
- —
- Monthly cashflow
- —
- DSCR
- —
- Eligible?
- —
No personal income docs; deal must DSCR.
Hard money
10% down · 12.0% · 12mo
- Down + closing
- —
- Monthly P&I
- —
- Monthly cashflow
- —
- DSCR
- —
- Eligible?
- —
Short-term bridge; refi at stabilization.
Listing history 18 events
-
2026-06-21days on market $140,000 Active 83 DOM
-
2026-06-19days on market $140,000 Active 81 DOM
-
2026-06-18days on market $140,000 Active 80 DOM
-
2026-06-17days on market $140,000 Active 79 DOM
-
2026-06-16days on market $140,000 Active 78 DOM
-
2026-06-15days on market $140,000 Active 77 DOM
-
2026-06-14days on market $140,000 Active 75 DOM
-
2026-06-12days on market $140,000 Active 74 DOM
-
2026-06-09days on market $140,000 Active 71 DOM
-
2026-06-08days on market $140,000 Active 70 DOM
-
2026-06-07days on market $140,000 Active 69 DOM
-
2026-06-07days on market $140,000 Active 68 DOM
-
2026-06-04days on market $140,000 Active 65 DOM
-
2026-06-02days on market $140,000 Active 64 DOM
-
2026-06-01days on market $140,000 Active 63 DOM
-
2026-05-31days on market $140,000 Active 62 DOM
-
2026-05-31days on market $140,000 Active 61 DOM
-
2026-03-31$140,000 Active 772-char remark
Show marketing remark (772 chars)
Discover the perfect family getaway or potential rental income with this delightful cabin located in the Rocky Rim Resort community. These 1-bedroom Park Model homes are approximately 400 sf and include a covered porch and additional loft space. Along with the cabin, the space includes two parking spaces, outdoor patio area, landscaping, and use of all community amenities. Enjoy the community splash pad, ramadas, playground and grass family play area. The surrounding area is home to spectacular hiking, fishing, hunting, kayaking, ATV trails, and wildlife. Home is not yet built. Photos are of the model, space #15, and are representative of the floorplan. Don't miss your opportunity to own a piece of serenity in Rocky Rim Resort. ** There is no full time living**
ⓘ Source: listings_history table (triggers on properties + properties_extension) + one-shot
backfill from property_details.listing_events for pre-trigger history.
Climate risk First Street
- Flood 1/10 Low FEMA zone X (unshaded) · 0% chance over 30 yrs
- Wildfire 7/10 Severe
- Heat 2/10 Low 7 d/yr ≥87°F today · 18 d/yr by 30 yrs out
- Wind 1/10 Low
- Air quality 1/10 Low 0 unhealthy d/yr today · 0 by 30 yrs out
Nearby sold comps map
Loading sold comps map…
Walkable amenities ~0.75 mi
Loading nearby amenities…
Taxation est. · year 1
- Rental income
- $15,899
- − Mortgage interest
- −$7,842
- − Property taxes
- −$2,100
- − Insurance
- −$700
- − Repairs & maintenance
- −$1,272
- − Management
- −$1,272
- − Depreciation
- −$4,073
- Taxable loss
- −$1,360
- Est. tax savings @ 24.0%
- +$326
- After-tax cash flow
- $1,277/yr
For passive investors: Depreciation is non-cash, so a rental often shows a tax loss while cash-flowing — sheltering income. Rental losses are passive: they offset passive income freely, and up to $25,000/yr can offset ordinary (W-2) income if you actively participate and your MAGI is under $100k (phasing out to $0 by $150k); unused losses carry forward. On sale, claimed depreciation is recaptured at up to 25%, and gains may owe capital-gains tax (a 1031 exchange can defer both). Figures are a year-1 estimate at your 24.0% rate — not tax advice; consult a CPA.
Condition & rehab AI · 13 photos
This move-in-ready cabin is in excellent condition with no visible repairs needed. It offers a great opportunity for a family getaway or rental income.
Value-add opportunities
- Both Landscaping and curb appeal — Enhances the home's aesthetic and appeal
- Both Add a smart home system — Improves convenience and energy efficiency
- Both Install a smart thermostat — Saves energy and improves comfort
Renovation cost estimate screening
Value-add ROI direction
- Both Landscaping and curb appeal — Enhances the home's aesthetic and appeal ↑
- Both Add a smart home system — Improves convenience and energy efficiency ↑
- Both Install a smart thermostat — Saves energy and improves comfort ↑
ⓘ Cost ranges are severity-bucket heuristics (US national rule-of-thumb). Get contractor quotes + a written scope before underwriting a rehab budget.
Schools (NCES district)
- District
- Heber-Overgaard Unified District (4392)
- NCES district ID
- 0400026
- Math proficiency
- 52% ▼ -5.00%
- Reading proficiency
- 45% ▼ -1.00%
- Median HH income
- $37,916
- Composite
- 40.42/100
- National rank
- #3727
- State rank
- #51 of 249 in AZ
Livability — Heber-Overgaard
No livability data for this city. (Only ~50 U.S. cities are tracked.)
Census & demographics
- Population (ZIP)
- 3,989
Population outlook (Navajo County) Hauer SSP2
- Today (2025)
- 105,760 people
- By 2030
- 103,301 · -2.3%
- By 2040
- 97,070 · -8.2%
- By 2050
- 88,850 · -16.0%
- By 2075
- 65,180 · -38.4%
- By 2100
- 37,281 · -64.7%
Race, ethnicity, and origin ACS 2023
- Neighborhood character
- Predominantly White (89%)
- Race & ethnicity
- White 89% Hispanic / Latino 5% Two or more races 4% Native American 3% Asian 2%
- Common ancestry
- Lithuanian 10% Italian 7% Portuguese 3%
- Foreign-born
- 4% · Canada, China
- Languages at home
- 93% English-only · Spanish 2% Other Indo-European 1% Russian/Polish/Slavic 1%
Political lean MEDSL · Navajo
- 2024 margin
- R (+17.2) · D 40.9% · R 58.1%
- 2008→2024 swing
- -5.5pp toward R · 2008: -11.7pp · 2024: -17.2pp
- All cycles
- 2024: R+17.2 2020: R+8.2 2016: R+7.9 2012: R+8.4 2008: R+11.7
Not yet ingested
- Civics
- —
Market trends
- HPI YoY
- ▼ -83.51%
- Current HPI
- 358.021
- Rent YoY
- —
- Metro
- —
- State GDP YoY
- ▲ 4.54%
- F500 in state
- 20
Industry mix (Fortune 500 HQ in AZ)
| Industry | F500 HQs | Revenue |
|---|---|---|
| Technology | 2 | $13B |
|
||
| Mining / Metals | 1 | $23B |
|
||
| Environmental Services | 1 | $16B |
|
||
| Metals / Steel | 1 | $14B |
|
||
| Technology Distribution | 1 | $9B |
|
||
| Homebuilding | 1 | $8B |
|
||
Price history
1 event — show timeline
- 2026-03-31 Listed $140,000 WMMLS
Cash-flow waterfall
monthlySold comps — $/sqft
last 12 mo · ≤1 miLoading sold comps…