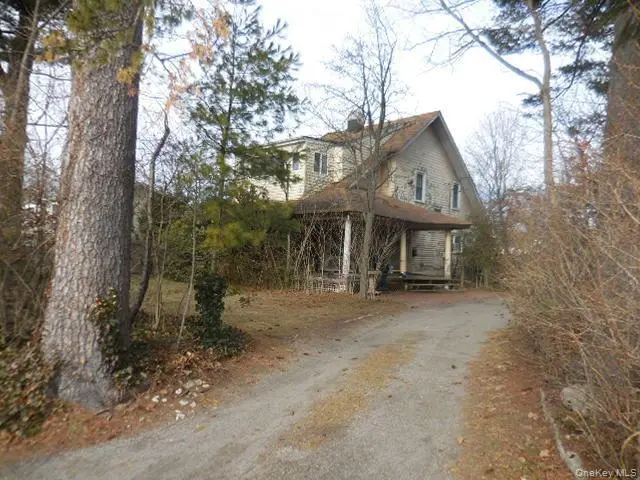
20 Washington Ave · Brentwood, NY
Flood risk 1/10 · Minimal
- FEMA flood zone
- X (unshaded)
- Chance of flooding over 30 yrs
- 0.0%
- Est. flood insurance / yr
- $473 – $860
Fire risk 1/10 · Minimal
- Est. fire insurance / yr
- $691 – $1,283
Heat risk 5/10 · Moderate
- Hot days now (above 95°F)
- 7 days/yr
- Hot days in 30 yrs
- 16 days/yr
Wind risk 6/10 · Moderate
- Chance of severe wind over 30 yrs
- 75.0%
Air-quality risk 4/10 · Minor
- Unhealthy air days now
- 3 days/yr
- Unhealthy air days in 30 yrs
- 5 days/yr
Risk factors via First Street. Map © Google.
Why this score? — see what drove the B grade
The composite is a weighted blend of 9 inputs, each scored 0–100. Each bar is that input's sub-score; the figure is the points it added to the 100-point composite (weight × sub-score).
- Cash flow +28.2/30.0
- ARV discount +15.0/15.0
- DSCR +10.0/10.0
- 1% rule +8.6/10.0
- Livability +3.8/5.0
- Schools +3.2/10.0
- Rent growth +2.5/5.0
- Condition / age +2.5/5.0
- Appreciation +0.0/10.0
$425,000
🖨 Deal sheet 📄 Offer letter ✓ Due diligence
Listing remarks MLS
Corner Lot
Key facts
- Corner lot
- 0.28 acre lot
- Built 1930
Tags
Neighborhood map
What this means for you Summary
Snapshot
- This is a 4-bed/2.0-bath single-family listed at $425k.
Deal economics
- At list price, monthly cash flow is $1k ($16k/yr) — positive.
- The deal already cash-flows at list — no discount required.
- Meets the 1% rule at list price ($6k rent vs $425k).
- Recommended offer: $400k (6.0% below list) — sets the bar for market timing.
- Cap rate 10.1% vs local median 3.8% in Brentwood — top-decile yield for the area; either an underpriced asset or a hidden risk that comps aren't pricing in. Stress-test before assuming the spread holds.
Location & tenants
- Location reads 75/100 on livability (#242 in NY, #3,816 nationally) — a middle-class / working-renter tenant base. Strengths: commute A+, employment A+, housing A+; Watch: crime D, schools F, amenities F.
- Brentwood Union Free School District (suburban): math 35% / reading 35% proficiency, ranked #542 of 590 in NY (top 92%) — families likely to look elsewhere, expect single-tenant / working-renter base with shorter leases; 66% free/reduced lunch — lower-income household profile, screen leases tightly.
- Market conditions: 124 active listings in the ZIP; 1 comparable units currently listed for rent nearby; 1,366 units permitted in Suffolk County in 2024 (216 in 5+ unit buildings).
Forward outlook
- Local home prices are declining (-3.0%/yr); year-one equity from $3k of loan paydown is wiped out by about $13k of value loss. Plan a longer hold.
- Suffolk County population projected to shrink 5% by 2050 — rents likely to lag national; underwrite the cash flow, not the appreciation.
- At projected returns (-3.0% appreciation + 3.0% rent growth), your $119k cash investment doubles in ~9 years — after that, you're playing with house money.
Negotiation context
- It's been on market 71 days — a 6% lower offer ($400k) is reasonable based on typical stale-listing flexibility.
- Current owner paid $130k; list at $425k implies a 228% gain — meaningful room to come down on a strong offer.
Risks & watch-outs
- Watch-outs: built in 1930 — expect roof / HVAC / electrical / plumbing capex.
- Climate carrying-cost: major wind risk, 75% chance of damaging wind over 30y; extreme-heat days projected 7→16/yr by 2055 (HVAC capex compounding) — expect insurance premiums to compound above CPI over the hold.
Questions for the listing agent
- It's been on market 71 days. Have you received any prior offers? Is the seller open to a 6% concession, seller financing, or rate buy-down credit?
- Built in 1930 — when were the roof, HVAC, electrical panel, plumbing, and water heater last replaced?
- Why hasn't it sold? Are there any deal-killer items the seller is aware of (foundation, flood, title, zoning, code violations)?
- Is there a deadline driving the sale (1031 exchange, divorce, estate, relocation)? That informs how much negotiation room exists.
- Schools are F-rated, which usually means shorter tenancies and higher turnover. Who's the typical renter profile here, and what's been the actual vacancy rate?
- Crime grade is D in this area — have there been break-ins, vandalism, or insurance claims at this property in the last 3 years? What carrier currently insures it and at what premium?
- What's the average days-on-market for RENTAL listings here right now (not sales)? A rising rental-DOM trend means longer vacancies and softer asking-rent achievability than the comps imply.
- What's the recent tenant-quality profile in this submarket — average credit score on applications, eviction rate, late-payment / NSF rate, and stable-employment percentage? A property-management company in the area should have these aggregated.
- How much new for-sale + rental construction is in the pipeline within 1–3 miles? Heavy new supply typically softens prices + rents 12–24 months out; constrained supply supports both.
Investment metrics
- 1% rule
- 1.36% ✓
- Cap rate
- 10.09%
- Cash-on-cash
- 13.57%
- DSCR
- 1.60
- GRM
- 6.1
CMA / ARV
- ARV (median comp)
- $713,260
- List price
- $425,000
- Delta
- -40.41%
- Verdict
- UNDERPRICED
- Comps
- 20 within 1.0 mi
Show comp detail 9 sales within ~0.75 mi
| Address | Dist | Beds/Ba | Sqft | Sold | Price | $/sf | Match |
|---|---|---|---|---|---|---|---|
| 11 Taft St | 0.04mi | 3/3.0 (-1) | 2,224 (+2%) | 6mo | $650,000 | $292 | 81 |
| 40 Monroe Ave | 0.22mi | 5/3.5 (+1) | 2,192 (0%) | 9mo | $690,000 | $315 | 71 |
| 15 Pennsylvania Ave | 0.22mi | 5/2.0 (+1) | 2,002 (-9%) | 8mo | $700,000 | $350 | 64 |
| 18 Roosevelt | 0.07mi | 5/2.0 (+1) | 2,000 (-9%) | 16mo | $690,000 | $345 | 64 |
| 32 Grant Ave | 0.53mi | 3/2.0 (-1) | 2,257 (+3%) | 7mo | $640,000 | $284 | 59 |
| 48 Brentwood Pkwy | 0.32mi | 3/2.5 (-1) | 2,400 (+10%) | 12mo | $575,000 | $240 | 52 |
| 1758 Brentwood Rd | 0.53mi | 4/1.0 | 2,024 (-8%) | 8mo | $500,000 | $247 | 52 |
| 144 Wheeler Ave | 0.73mi | 3/2.0 (-1) | 2,036 (-7%) | 6mo | $600,000 | $295 | 44 |
| 236 Sherman St | 0.63mi | 5/2.5 (+1) | 2,000 (-9%) | 10mo | $690,000 | $345 | 41 |
Match score weights: distance 35% · size 25% · config 20% · recency 20%. Top-matched comps best support the ARV.
Projected returns pro-forma
-3.0% appreciation · 3.0% rent growth · sell at horizon
- IRR
- 3.7%
- Equity multiple
- 1.14×
- Total profit
- $17,130
- Equity at exit
- $63,369
- IRR
- 13.3%
- Equity multiple
- 2.06×
- Total profit
- $126,405
- Equity at exit
- $36,746
Cash invested: $119,000 (down + closing). Projections, not guarantees.
Landlord ↔ Tenant lean methodology
- Overall (STATE)
- 15 Strongly Tenant-Friendly
- State New York
- 15 Strongly Tenant-Friendly · D+10
- County
- — inherits STATE
- City
- — inherits STATE
ZIP-level market 11717
- Active inventory
- 124
- Price-to-rent
- 6.1×
Monthly cashflow live
- Estimated rent
- $5,800 medium interval (Pro) →
- Mortgage (P&I)
- −$2,229
- Tax from tax record
- −$830 /mo · $9,962/yr
- Insurance
- −$177
- HOA
- −$0
- Vacancy / Maint / Mgmt
- −$1,218
- Net cashflow
- $1,346
Break-even live
UW: 25.0% down · 7.5% · 30yr · 1.5% tax · 5.0% vac · 8.0% maint · 8.0% mgmt
Financing live
Cash to close
- Down payment
- $106,250
- Closing costs
- $12,750
- Reserves months
- —
- Total cash needed
- —
Loan-product check · same deal, 3 products live
Conventional
25% down · 7.5% · 30yr
- Down + closing
- —
- Monthly P&I
- —
- Monthly cashflow
- —
- DSCR
- —
- Eligible?
- —
Personal DTI + credit; lowest rate.
DSCR
20% down · 8.5% · 30yr
- Down + closing
- —
- Monthly P&I
- —
- Monthly cashflow
- —
- DSCR
- —
- Eligible?
- —
No personal income docs; deal must DSCR.
Hard money
10% down · 12.0% · 12mo
- Down + closing
- —
- Monthly P&I
- —
- Monthly cashflow
- —
- DSCR
- —
- Eligible?
- —
Short-term bridge; refi at stabilization.
Rent comps 1 comps
| Address | Beds | Baths | Sqft | Rent | $/sqft | DOM | Units | Dist |
|---|---|---|---|---|---|---|---|---|
| 32 Grant Ave Brentwood, NY | 5.0 | 3.0 | 2274 | $5,800 | $2.55 | 22d | 1 | 0.51mi |
Listing history 4 events
-
2026-04-17price $425,000 10-char remark
Show marketing remark (10 chars)
Corner Lot
-
2026-03-13$451,250 Active 10-char remark
Show marketing remark (10 chars)
Corner Lot
-
1998-09-08soldstatus $129,500
-
1986-09-30soldstatus $110,000
ⓘ Source: listings_history table (triggers on properties + properties_extension) + one-shot
backfill from property_details.listing_events for pre-trigger history.
Tax reassessment forecast NY · Partial reset (capped growth)
- Current annual tax
- $9,962 · $830/mo
- Projected year-2 tax
- $9,962 · $830/mo
- Expected delta
- $0/yr ($0/mo · 0.0%)
ⓘ Screening estimate from a state-policy table — verify with the county assessor before closing.
Climate risk First Street
- Flood 1/10 Low FEMA zone X (unshaded) · 0% chance over 30 yrs
- Wildfire 1/10 Low
- Heat 5/10 Major 7 d/yr ≥95°F today · 16 d/yr by 30 yrs out
- Wind 6/10 Major 75% chance of damaging wind over 30 yrs
- Air quality 4/10 Moderate 3 unhealthy d/yr today · 5 by 30 yrs out
Nearby sold comps map
Loading sold comps map…
Walkable amenities ~0.75 mi
Loading nearby amenities…
Taxation est. · year 1
- Rental income
- $69,600
- − Mortgage interest
- −$23,807
- − Property taxes
- −$9,962
- − Insurance
- −$2,125
- − Repairs & maintenance
- −$5,568
- − Management
- −$5,568
- − Depreciation
- −$12,364
- Taxable income
- $10,207
- Est. tax owed @ 24.0%
- −$2,450
- After-tax cash flow
- $13,702/yr
For passive investors: Depreciation is non-cash, so a rental often shows a tax loss while cash-flowing — sheltering income. Rental losses are passive: they offset passive income freely, and up to $25,000/yr can offset ordinary (W-2) income if you actively participate and your MAGI is under $100k (phasing out to $0 by $150k); unused losses carry forward. On sale, claimed depreciation is recaptured at up to 25%, and gains may owe capital-gains tax (a 1031 exchange can defer both). Figures are a year-1 estimate at your 24.0% rate — not tax advice; consult a CPA.
Schools (NCES district)
- District
- Brentwood Union Free School District
- NCES district ID
- 3605280
- Math proficiency
- 35% ▼ -8.00%
- Reading proficiency
- 35% ▼ -3.00%
- Median HH income
- $71,840
- Composite
- 32.44/100
- National rank
- #5722
- State rank
- #542 of 590 in NY
Livability — Brentwood
- Score
- 75/100
- State rank
- #242
- US rank
- #3816
Category grades
Schools grade is shown separately in the Schools card above.
Census & demographics
- Census place
- Brentwood, NY
Population outlook (Suffolk County) Hauer SSP2
- Today (2025)
- 1,505,262 people
- By 2030
- 1,498,318 · -0.5%
- By 2040
- 1,471,101 · -2.3%
- By 2050
- 1,424,848 · -5.3%
- By 2075
- 1,337,157 · -11.2%
- By 2100
- 1,217,720 · -19.1%
Not yet ingested
- Political lean
- —
- Race & ethnicity
- —
- Common origin
- —
- Civics
- —
Market trends
- HPI YoY
- ▼ -380.71%
- Current HPI
- 391.2532
- Rent YoY
- —
- Metro
- —
- State GDP YoY
- ▲ 2.60%
- F500 in state
- 92
Industry mix (Fortune 500 HQ in NY)
| Industry | F500 HQs | Revenue |
|---|---|---|
| Financial Services | 10 | $950B |
|
||
| Consumer Goods | 9 | $162B |
|
||
| Insurance | 4 | $225B |
|
||
| Telecommunications | 2 | $144B |
|
||
| Pharmaceuticals | 2 | $112B |
|
||
| Media / Entertainment | 2 | $69B |
|
||
Price history
+286.4% since first listed4 events — show timeline
- 2026-04-17 Price Changed $425,000 OneKey® MLS as Distributed by MLS Grid
- 2026-03-13 Listed $451,250 OneKey® MLS as Distributed by MLS Grid
- 1998-09-08 Sold (Public Records) $129,500 Public Records
- 1986-09-30 Sold (Public Records) $110,000 Public Records
Property tax history
+2.9%/yrLatest (2025): $9,962 · +0.0% YoY. Source: county tax records.
Cash-flow waterfall
monthlySold comps — $/sqft
last 12 mo · ≤1 miLoading sold comps…