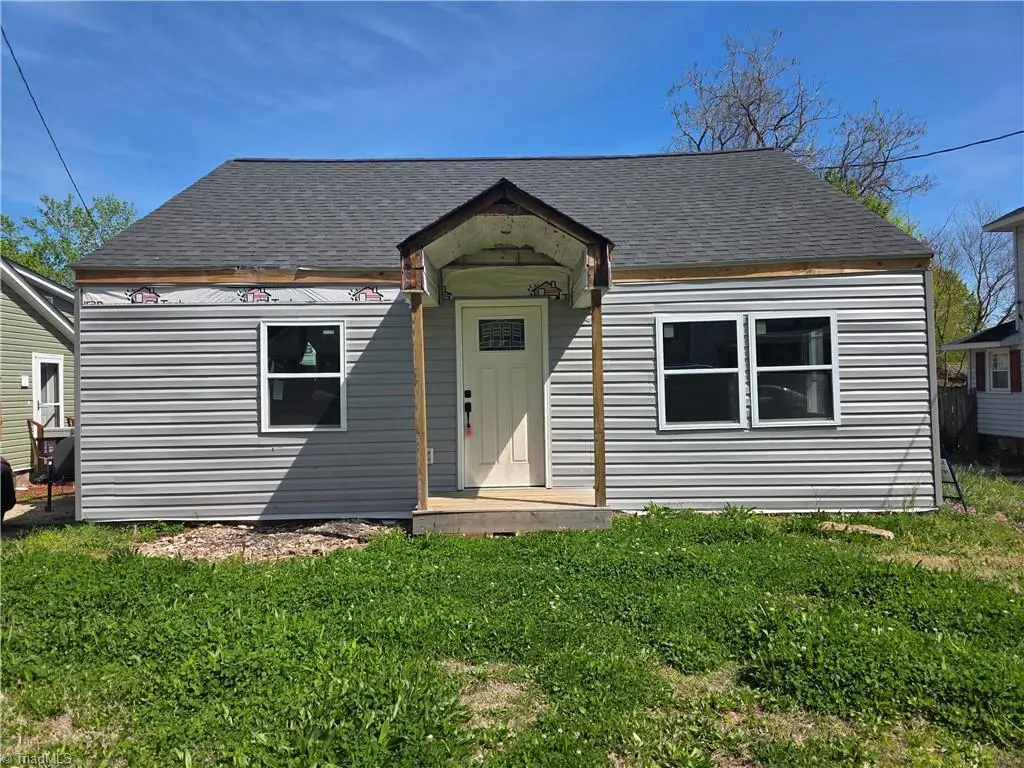
209 6th Ave · Mayodan, NC
Flood risk 1/10 · Minimal
- FEMA flood zone
- X (unshaded)
- Chance of flooding over 30 yrs
- 0.0%
- Est. flood insurance / yr
- $507 – $1,088
Fire risk 3/10 · Minor
- Est. fire insurance / yr
- $906 – $1,684
Heat risk 6/10 · Moderate
- Hot days now (above 103°F)
- 7 days/yr
- Hot days in 30 yrs
- 18 days/yr
Wind risk 4/10 · Minor
- Chance of severe wind over 30 yrs
- 9.0%
Air-quality risk 2/10 · Minimal
- Unhealthy air days now
- 2 days/yr
- Unhealthy air days in 30 yrs
- 2 days/yr
Risk factors via First Street. Map © Google.
Why this score? — see what drove the C- grade
The composite is a weighted blend of 9 inputs, each scored 0–100. Each bar is that input's sub-score; the figure is the points it added to the 100-point composite (weight × sub-score).
- Cash flow +16.3/30.0
- ARV discount +15.0/15.0
- DSCR +5.0/10.0
- 1% rule +4.3/10.0
- Schools +3.3/10.0
- Livability +3.0/5.0
- Rent growth +2.5/5.0
- Condition / age +2.5/5.0
- Appreciation +0.0/10.0
$94,000
🖨 Deal sheet (PDF) 📄 Offer letter ✓ Due diligence
Listing remarks
Great Opportunity this 3 Bed 1 bath home has had some renovations started for you! Calling Investors or Handy buyers. 2 beds on main, nice size living, spacious kitchen, large laundry. flex space, and a room on upper level too! Walk to Downtown or enjoy Elliot Duncan Park just a block or so away! Additional 200 Square footage for 3rd bedroom on upper level has ceiling heights under 7 ft. so not added to square footage
Key facts
- Walk to downtown
- Elliot duncan park
- 8,276 sq ft lot
Tags
Property features AI
Finance
- Other: Building area reported as 896 total; Lot dimensions to be determined by buyer survey
- HOA & community: No homeowners association
Exterior
- Parking: Driveway and on-street parking (no garage)
- Utilities: Public water; Public sewer; Publicly maintained road access; Electric water heater
- Home design: Single-story house (one level); Stick/site-built residential structure; Built in 1945; Existing structure
- Construction: Asbestos and vinyl siding exterior; Crawl space foundation; No fireplaces
- Exterior features: City lot; No fence
Interior
- Kitchen: Kitchen on the main level; Electric water heater
- Bedrooms: Includes rooms on the main level and an additional bonus room on another level
- Bathrooms: One full bathroom
- Heating & cooling: Central air conditioning; Forced air heating powered by natural gas
- Interior features: Primary bedroom is on the main level
- Laundry & utility: Main-level laundry room
Neighborhood map
What this means for you Summary
Snapshot
- This is a 3-bed/1.0-bath single-family listed at $94k.
Deal economics
- At list price, monthly cash flow is $51 ($613/yr) — positive.
- The deal already cash-flows at list — no discount required.
- To meet the 1% rule (rent ≥ 1% of price), the offer needs to be $88k (6.9% below list).
- Recommended offer: $88k (6.9% below list) — sets the bar for 1% rule.
- Cap rate 6.9% vs local median 3.7% in Mayodan — top-decile yield for the area; either an underpriced asset or a hidden risk that comps aren't pricing in. Stress-test before assuming the spread holds.
Location & tenants
- Location reads 60/100 on livability (#523 in NC) — a middle-class / working-renter tenant base. Strengths: cost of living A+, housing B; Watch: crime C-, amenities F, commute F.
- Rockingham County Schools (rural): math 38% / reading 40% proficiency, ranked #120 of 178 in NC (top 67%) — families likely to look elsewhere, expect single-tenant / working-renter base with shorter leases.
- Zoned schools: John W Dillard Academy (math 37% / reading 37%, grade F, #771 of 1,410 statewide, top 57%, 284 students, 66% FRL); Western Rockingham Middle (math 39% / reading 40%, grade F, #232 of 475 statewide, top 50%, 556 students, 63% FRL); Dalton Mcmichael High (math 42% / reading 47%, grade F, #352 of 535 statewide, top 68%, 723 students, 59% FRL).
- Market conditions: 26 active listings in the ZIP; 1 comparable units currently listed for rent nearby; 344 units permitted in Rockingham County in 2024 (0 in 5+ unit buildings).
Forward outlook
- Local home prices are declining (-3.0%/yr); year-one equity from $650 of loan paydown is wiped out by about $3k of value loss. Plan a longer hold.
- Rockingham County population projected at -22% by 2050 — secular population decline; favor cash flow + early exit over multi-decade hold.
Negotiation context
- It's been on market 70 days — a 6% lower offer ($88k) is reasonable based on typical stale-listing flexibility.
- 2 sale attempts; this cycle's ask has dropped $6k (6%) from the opening price — seller is motivated, your offer sets the floor, not the list.
- Current owner paid $79k; 19% above their basis — modest negotiation headroom, anchor on the comps not their cost.
Risks & watch-outs
- Watch-outs: built in 1945 — expect roof / HVAC / electrical / plumbing capex.
- Climate carrying-cost: extreme-heat days projected 7→18/yr by 2055 (HVAC capex compounding) — expect insurance premiums to compound above CPI over the hold.
Questions for the listing agent
- It's been on market 70 days. Have you received any prior offers? Is the seller open to a 7% concession, seller financing, or rate buy-down credit?
- Built in 1945 — when were the roof, HVAC, electrical panel, plumbing, and water heater last replaced?
- Why hasn't it sold? Are there any deal-killer items the seller is aware of (foundation, flood, title, zoning, code violations)?
- Is there a deadline driving the sale (1031 exchange, divorce, estate, relocation)? That informs how much negotiation room exists.
- Schools are F-rated, which usually means shorter tenancies and higher turnover. Who's the typical renter profile here, and what's been the actual vacancy rate?
- What's the average days-on-market for RENTAL listings here right now (not sales)? A rising rental-DOM trend means longer vacancies and softer asking-rent achievability than the comps imply.
- What's the recent tenant-quality profile in this submarket — average credit score on applications, eviction rate, late-payment / NSF rate, and stable-employment percentage? A property-management company in the area should have these aggregated.
- How much new for-sale + rental construction is in the pipeline within 1–3 miles? Heavy new supply typically softens prices + rents 12–24 months out; constrained supply supports both.
Investment metrics
- 1% rule
- 0.93% ✗
- Cap rate
- 6.95%
- Cash-on-cash
- 2.33%
- DSCR
- 1.10
- GRM
- 9.0
CMA / ARV
- ARV (on-the-fly)
- $159,852
- Comps found
- 12
Show comp detail 12 sales within ~0.75 mi
| Address | Dist | Beds/Ba | Sqft | Sold | Price | $/sf | Match |
|---|---|---|---|---|---|---|---|
| 211 5th Ave | 0.27mi | 3/2.0 | 907 (-2%) | 4mo | $170,000 | $187 | 77 |
| 401 N 4th Ave | 0.20mi | 2/1.0 (-1) | 863 (-7%) | 6mo | $100,000 | $116 | 70 |
| 900 W Monroe St | 0.27mi | 2/1.0 (-1) | 850 (-8%) | 0mo | $98,000 | $115 | 69 |
| 427 N 2nd Ave | 0.46mi | 2/1.0 (-1) | 912 (-1%) | 4mo | $187,000 | $205 | 68 |
| 301 5th Ave | 0.09mi | 3/2.0 | 1,024 (+11%) | 10mo | $192,000 | $188 | 65 |
| 608 W Washington St | 0.33mi | 2/1.0 (-1) | 984 (+6%) | 8mo | $153,000 | $155 | 62 |
| 304 W Washington Ext | 0.49mi | 2/1.0 (-1) | 954 (+3%) | 8mo | $167,000 | $175 | 60 |
| 307 S 5th Ave | 0.34mi | 2/1.0 (-1) | 986 (+7%) | 15mo | $79,000 | $80 | 56 |
| 713 Roach St | 0.35mi | 2/1.0 (-1) | 1,040 (+13%) | 2mo | $180,000 | $173 | 56 |
| 101 Ayersville Rd | 0.36mi | 2/1.0 (-1) | 806 (-13%) | 2mo | $63,500 | $79 | 55 |
| 209 S 4th Ave | 0.30mi | 3/2.0 | 1,024 (+11%) | 12mo | $210,000 | $205 | 54 |
| 321 N 1st Ave | 0.38mi | 2/2.0 (-1) | 1,031 (+12%) | 14mo | $167,000 | $162 | 42 |
Match score weights: distance 35% · size 25% · config 20% · recency 20%. Top-matched comps best support the ARV.
Projected returns pro-forma
-3.0% appreciation · 3.0% rent growth · sell at horizon
- IRR
- -12.6%
- Equity multiple
- 0.55×
- Total profit
- $-11,969
- Equity at exit
- $14,016
- IRR
- -3.5%
- Equity multiple
- 0.76×
- Total profit
- $-6,201
- Equity at exit
- $8,127
Cash invested: $26,320 (down + closing). Projections, not guarantees.
Landlord ↔ Tenant lean methodology
- Overall (STATE)
- 85 Strongly Landlord-Friendly
- State North Carolina
- 85 Strongly Landlord-Friendly · R+3
- County
- — inherits STATE
- City
- — inherits STATE
ZIP-level market 27027
- Home prices YoY
- -6.3%
- Active inventory
- 26
- Price-to-rent
- 9.0×
Monthly cashflow live
- Estimated rent
- $875 medium interval (Pro) →
- Mortgage (P&I)
- −$493
- Tax from tax record
- −$108 /mo · $1,296/yr
- Insurance
- −$39
- HOA
- −$0
- Vacancy / Maint / Mgmt
- −$184
- Net cashflow
- $51
Break-even live
Sensitivity live
| Price | -10% $104 | -5% $78 | +0% $51 | +5% $25 | +10% $-2 |
|---|---|---|---|---|---|
| Rent | -10% $-18 | -5% $17 | +0% $51 | +5% $86 | +10% $120 |
| Rate | -1.0pp $98 | -0.5pp $75 | base $51 | +0.5pp $27 | +1.0pp $2 |
UW: 25.0% down · 7.5% · 30yr · 1.5% tax · 5.0% vac · 8.0% maint · 8.0% mgmt
Financing live
Cash to close
- Down payment
- $23,500
- Closing costs
- $2,820
- Reserves months
- —
- Total cash needed
- —
Loan-product check · same deal, 3 products live
Conventional
25% down · 7.5% · 30yr
- Down + closing
- —
- Monthly P&I
- —
- Monthly cashflow
- —
- DSCR
- —
- Eligible?
- —
Personal DTI + credit; lowest rate.
DSCR
20% down · 8.5% · 30yr
- Down + closing
- —
- Monthly P&I
- —
- Monthly cashflow
- —
- DSCR
- —
- Eligible?
- —
No personal income docs; deal must DSCR.
Hard money
10% down · 12.0% · 12mo
- Down + closing
- —
- Monthly P&I
- —
- Monthly cashflow
- —
- DSCR
- —
- Eligible?
- —
Short-term bridge; refi at stabilization.
Rent comps 1 comps
| Address | Beds | Baths | Sqft | Rent | $/sqft | DOM | Units | Dist |
|---|---|---|---|---|---|---|---|---|
| 410 S Ayersville Rd Mayodan, NC | 2.0 | 1.0 | 625 | $875 | $1.40 | 25d | 1 | 0.34mi |
Listing history 22 events
-
2026-06-22days on market $94,000 Active 70 DOM
-
2026-06-18days on market $94,000 Active 67 DOM
-
2026-06-17days on market $94,000 Active 66 DOM
-
2026-06-16days on market $94,000 Active 65 DOM
-
2026-06-15days on market $94,000 Active 64 DOM
-
2026-06-14days on market $94,000 Active 62 DOM
-
2026-06-13days on market $94,000 Active 61 DOM
-
2026-06-10days on market $94,000 Active 59 DOM
-
2026-06-09days on market $94,000 Active 58 DOM
-
2026-06-08days on market $94,000 Active 57 DOM
-
2026-06-07days on market $94,000 Active 56 DOM
-
2026-06-03days on market $94,000 Active 52 DOM
-
2026-06-02days on market $94,000 Active 51 DOM
-
2026-06-01days on market $94,000 Active 50 DOM
-
2026-05-31days on market $94,000 Active 49 DOM
-
2026-05-31days on market $94,000 Active 48 DOM
-
2026-05-21price $94,000
-
2026-04-14status Active
-
2026-04-12historical
-
2026-04-10$100,000 Active
-
2023-05-25soldstatus $78,797
-
2000-04-20soldstatus $47,000
ⓘ Source: listings_history table (triggers on properties + properties_extension) + one-shot
backfill from property_details.listing_events for pre-trigger history.
Tax reassessment forecast NC · Resets to sale price
- Current annual tax
- $1,296 · $108/mo
- Projected year-2 tax
- $1,296 · $108/mo
- Expected delta
- $0/yr ($0/mo · 0.0%)
ⓘ Screening estimate from a state-policy table — verify with the county assessor before closing.
Climate risk First Street
- Flood 1/10 Low FEMA zone X (unshaded) · 0% chance over 30 yrs
- Wildfire 3/10 Moderate
- Heat 6/10 Major 7 d/yr ≥103°F today · 18 d/yr by 30 yrs out
- Wind 4/10 Moderate 9% chance of damaging wind over 30 yrs
- Air quality 2/10 Low 2 unhealthy d/yr today · 2 by 30 yrs out
Nearby sold comps map
Loading sold comps map…
Walkable amenities ~0.75 mi
Loading nearby amenities…
Taxation est. · year 1
- Rental income
- $10,500
- − Mortgage interest
- −$5,265
- − Property taxes
- −$1,296
- − Insurance
- −$470
- − Repairs & maintenance
- −$840
- − Management
- −$840
- − Depreciation
- −$2,735
- Taxable loss
- −$946
- Est. tax savings @ 24.0%
- +$227
- After-tax cash flow
- $840/yr
For passive investors: Depreciation is non-cash, so a rental often shows a tax loss while cash-flowing — sheltering income. Rental losses are passive: they offset passive income freely, and up to $25,000/yr can offset ordinary (W-2) income if you actively participate and your MAGI is under $100k (phasing out to $0 by $150k); unused losses carry forward. On sale, claimed depreciation is recaptured at up to 25%, and gains may owe capital-gains tax (a 1031 exchange can defer both). Figures are a year-1 estimate at your 24.0% rate — not tax advice; consult a CPA.
Schools (NCES district)
- District
- Rockingham County Schools
- NCES district ID
- 3703990
- Math proficiency
- 38% ▼ -2.00%
- Reading proficiency
- 40% ▲ 1.00%
- Median HH income
- $38,914
- Composite
- 32.6/100
- National rank
- #5673
- State rank
- #120 of 178 in NC
Livability — Mayodan
- Score
- 60/100
- State rank
- #523
- US rank
- #19383
Category grades
Schools grade is shown separately in the Schools card above.
Census & demographics
- Census place
- Mayodan, NC
- Population (ZIP)
- 3,950
Population outlook (Rockingham County) Hauer SSP2
- Today (2025)
- 87,103 people
- By 2030
- 83,763 · -3.8%
- By 2040
- 76,082 · -12.7%
- By 2050
- 68,106 · -21.8%
- By 2075
- 52,531 · -39.7%
- By 2100
- 39,871 · -54.2%
Race, ethnicity, and origin ACS 2023
- Neighborhood character
- Predominantly White (89%)
- Race & ethnicity
- White 89% Two or more races 7% Hispanic / Latino 3% Black 3%
- Common ancestry
- Italian 2% Serbian 1% Romanian 1%
- Foreign-born
- 1% · Canada
- Languages at home
- 99% English-only · Spanish 1%
Political lean MEDSL · Rockingham
- 2024 margin
- Solid R (+35.9) · D 31.7% · R 67.6%
- 2008→2024 swing
- -19.9pp toward R · 2008: -16.0pp · 2024: -35.9pp
- All cycles
- 2024: R+35.9 2020: R+32.0 2016: R+30.0 2012: R+21.3 2008: R+16.0
Not yet ingested
- Civics
- —
Market trends
- HPI YoY
- ▼ -16.45%
- Current HPI
- 242.6839
- Rent YoY
- —
- Metro
- —
- State GDP YoY
- ▲ 3.28%
- F500 in state
- 26
Industry mix (Fortune 500 HQ in NC)
| Industry | F500 HQs | Revenue |
|---|---|---|
| Financial Services | 2 | $213B |
|
||
| Retail | 2 | $95B |
|
||
| Industrial Conglomerate | 1 | $38B |
|
||
| Metals / Steel | 1 | $35B |
|
||
| Utilities | 1 | $30B |
|
||
| Industrial Machinery | 1 | $19B |
|
||
Price history
+100.0% since first listed6 events — show timeline
- 2026-05-21 Price Changed $94,000 Triad MLS
- 2026-04-14 Relisted — Triad MLS
- 2026-04-12 Delisted — Triad MLS
- 2026-04-10 Listed $100,000 Triad MLS
- 2023-05-25 Sold (Public Records) $78,797 Public Records
- 2000-04-20 Sold (Public Records) $47,000 Public Records
Property tax history
+5.3%/yrLatest (2025): $1,296 · +8.4% YoY. Source: county tax records.
Cash-flow waterfall
monthlySold comps — $/sqft
last 12 mo · ≤1 miLoading sold comps…