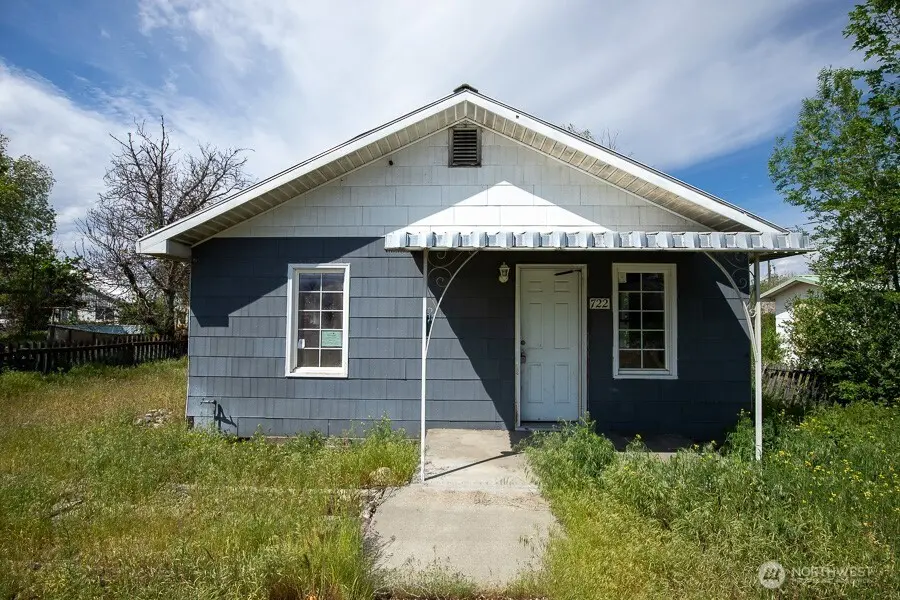
722 Jackson St · Omak, WA
Flood risk 6/10 · Moderate
- FEMA flood zone
- X
- Chance of flooding over 30 yrs
- 0.97%
- Est. flood insurance / yr
- $507 – $1,088
Fire risk 9/10 · Severe
- Est. fire insurance / yr
- $604 – $1,122
Heat risk 5/10 · Moderate
- Hot days now (above 98°F)
- 7 days/yr
- Hot days in 30 yrs
- 15 days/yr
Wind risk 1/10 · Minimal
- Chance of severe wind over 30 yrs
- —
Air-quality risk 10/10 · Severe
- Unhealthy air days now
- 23 days/yr
- Unhealthy air days in 30 yrs
- 27 days/yr
Risk factors via First Street. Map © Google.
Why this score? — see what drove the B- grade
The composite is a weighted blend of 9 inputs, each scored 0–100. Each bar is that input's sub-score; the figure is the points it added to the 100-point composite (weight × sub-score).
- Cash flow +30.0/30.0
- 1% rule +10.0/10.0
- DSCR +10.0/10.0
- ARV discount +7.5/15.0
- Schools +3.6/10.0
- Livability +3.2/5.0
- Rent growth +2.5/5.0
- Condition / age +2.5/5.0
- Appreciation +0.0/10.0
$69,000
🖨 Deal sheet 📄 Offer letter ✓ Due diligence
Listing remarks
PRICE REDUCTION. This house is ready for the remodel to be completed. Cute cottage style home. Spacious lot with intricate landscaping. Alley access with large gate. Kitchen cabinets are nice, and newer. Dining room off kitchen gets beautiful natural light, looks over the backyard, and has a large arched entrance. The bathroom is newer with doors to both bedrooms, a large walk-shower and modern pedestal sink. Windows are vinyl replacement windows except for row of windows at the mud/laundry room. Cellar is accessed through a hatch in the door. Steep ladder steps. Water heater and electrical panel are in the cellar. The house and property are on their way to becoming a delightful retreat. Lo
Key facts
- 7,000 sq ft lot
- Built 1937
Property features AI
Finance
- Other: Property condition listed as fixer; Zoning: RM; Lot features include alley access, curbs, and paved streets; Lot is approximately 0.1607 acres; Site is level
- Financial info: Listing is for cash purchase
Exterior
- Parking: No designated parking
- Security: Partially fenced yard
- Utilities: Public water (City of Omak); Sewer available (City of Omak); Electric power (Okanogan County PUD)
- Home design: Single-family residence, one story; Built on lot; East-facing
- Construction: Wood construction; Composition roof; Poured concrete foundation; Built as a house (structure type)
- Exterior features: Partial fencing; Wood exterior
Interior
- Kitchen: Refrigerator; Stove/Range
- Bedrooms: 2 bedrooms (both on the main level)
- Flooring: Softwood flooring; Vinyl flooring
- Bathrooms: 1 three-quarter bathroom (main level) with 1 shower
- Heating & cooling: Baseboard heating; Wall furnace; No central cooling
- Interior features: Fireplace (wood burning); Water heater (electric, located in cellar)
- Laundry & utility: Water heater in cellar
Neighborhood map
What this means for you Summary
Snapshot
- This is a 2-bed/1.0-bath single-family listed at $69k.
Deal economics
- At list price, monthly cash flow is $414 ($5k/yr) — positive.
- The deal already cash-flows at list — no discount required.
- Meets the 1% rule at list price ($1k rent vs $69k).
- Cap rate 13.5% vs local median 2.4% in Omak — top-decile yield for the area; either an underpriced asset or a hidden risk that comps aren't pricing in. Stress-test before assuming the spread holds.
Location & tenants
- Location reads 63/100 on livability (#386 in WA) — a middle-class / working-renter tenant base. Strengths: cost of living A+; Watch: crime C-, health & safety C-, employment D.
- Omak School District (town): math 29% / reading 49% proficiency, ranked #227 of 291 in WA (top 78%) — families likely to look elsewhere, expect single-tenant / working-renter base with shorter leases.
- Zoned schools: Omak High School (480 students, 76% FRL) — zoned schools average 76% FRL vs 37% district-wide (40 pts higher); higher-poverty schools than district average — tighter screening recommended.
- Market conditions: 105 active listings in the ZIP; 234 units permitted in Okanogan County in 2024 (0 in 5+ unit buildings).
Forward outlook
- Local home prices are declining (-3.0%/yr); year-one equity from $477 of loan paydown is wiped out by about $2k of value loss. Plan a longer hold.
- Okanogan County population projected at -12% by 2050 — secular population decline; favor cash flow + early exit over multi-decade hold.
- At projected returns (-3.0% appreciation + 3.0% rent growth), your $19k cash investment doubles in ~5 years — after that, you're playing with house money.
Negotiation context
- Only 1 days on market — expect competitive offers; lowballing is unlikely to land.
- 2 sale attempts since 4y ago with the ask held roughly flat each time — persistent listings suggest the price (not the market) is what's stuck; bring a comps-based counter.
Risks & watch-outs
- Watch-outs: built in 1937 — expect roof / HVAC / electrical / plumbing capex.
- Climate carrying-cost: major flood risk; severe wildfire risk; extreme-heat days projected 7→15/yr by 2055 (HVAC capex compounding) — expect insurance premiums to compound above CPI over the hold.
Questions for the listing agent
- Built in 1937 — when were the roof, HVAC, electrical panel, plumbing, and water heater last replaced?
- Is there a deadline driving the sale (1031 exchange, divorce, estate, relocation)? That informs how much negotiation room exists.
- What's the average days-on-market for RENTAL listings here right now (not sales)? A rising rental-DOM trend means longer vacancies and softer asking-rent achievability than the comps imply.
- What's the recent tenant-quality profile in this submarket — average credit score on applications, eviction rate, late-payment / NSF rate, and stable-employment percentage? A property-management company in the area should have these aggregated.
- How much new for-sale + rental construction is in the pipeline within 1–3 miles? Heavy new supply typically softens prices + rents 12–24 months out; constrained supply supports both.
Investment metrics
- 1% rule
- 1.60% ✓
- Cap rate
- 13.49%
- Cash-on-cash
- 25.71%
- DSCR
- 2.14
- GRM
- 5.2
CMA / ARV
- ARV (on-the-fly)
- $165,168
- Comps found
- 1
Show comp detail 1 sale within ~0.75 mi
| Address | Dist | Beds/Ba | Sqft | Sold | Price | $/sf | Match |
|---|---|---|---|---|---|---|---|
| 324 Railroad Ave | 0.49mi | 2/1.0 | 936 (+5%) | 4mo | $174,000 | $186 | 65 |
Match score weights: distance 35% · size 25% · config 20% · recency 20%. Top-matched comps best support the ARV.
Projected returns pro-forma
-3.0% appreciation · 3.0% rent growth · sell at horizon
- IRR
- 19.4%
- Equity multiple
- 1.79×
- Total profit
- $15,191
- Equity at exit
- $10,288
- IRR
- 27.7%
- Equity multiple
- 3.44×
- Total profit
- $47,198
- Equity at exit
- $5,966
Cash invested: $19,320 (down + closing). Projections, not guarantees.
Landlord ↔ Tenant lean methodology
- Overall (STATE)
- 28 Tenant-Leaning
- State Washington
- 28 Tenant-Leaning · D+8
- County
- — inherits STATE
- City
- — inherits STATE
ZIP-level market 98841
- Active inventory
- 105
- Price-to-rent
- 5.2×
Monthly cashflow live
- Estimated rent
- $1,102 medium interval (Pro) →
- Mortgage (P&I)
- −$362
- Tax from tax record
- −$66 /mo · $789/yr
- Insurance
- −$29
- HOA
- −$0
- Vacancy / Maint / Mgmt
- −$231
- Net cashflow
- $414
Break-even live
UW: 25.0% down · 7.5% · 30yr · 1.5% tax · 5.0% vac · 8.0% maint · 8.0% mgmt
Financing live
Cash to close
- Down payment
- $17,250
- Closing costs
- $2,070
- Reserves months
- —
- Total cash needed
- —
Loan-product check · same deal, 3 products live
Conventional
25% down · 7.5% · 30yr
- Down + closing
- —
- Monthly P&I
- —
- Monthly cashflow
- —
- DSCR
- —
- Eligible?
- —
Personal DTI + credit; lowest rate.
DSCR
20% down · 8.5% · 30yr
- Down + closing
- —
- Monthly P&I
- —
- Monthly cashflow
- —
- DSCR
- —
- Eligible?
- —
No personal income docs; deal must DSCR.
Hard money
10% down · 12.0% · 12mo
- Down + closing
- —
- Monthly P&I
- —
- Monthly cashflow
- —
- DSCR
- —
- Eligible?
- —
Short-term bridge; refi at stabilization.
Listing history 7 events
-
2026-05-07status Pending
-
2026-05-07$69,000 Active
-
2022-04-19soldstatus $117,000 Closed
-
2022-03-09status Pending
-
2022-02-25$109,000 Active
-
2018-04-02soldstatus $56,000
-
2005-12-09soldstatus $49,500
ⓘ Source: listings_history table (triggers on properties + properties_extension) + one-shot
backfill from property_details.listing_events for pre-trigger history.
Tax reassessment forecast WA · Resets to sale price
- Current annual tax
- $789 · $66/mo
- Projected year-2 tax
- $789 · $66/mo
- Expected delta
- $0/yr ($0/mo · 0.0%)
ⓘ Screening estimate from a state-policy table — verify with the county assessor before closing.
Climate risk First Street
- Flood 6/10 Major FEMA zone X · 97% chance over 30 yrs
- Wildfire 9/10 Extreme
- Heat 5/10 Major 7 d/yr ≥98°F today · 15 d/yr by 30 yrs out
- Wind 1/10 Low
- Air quality 10/10 Extreme 23 unhealthy d/yr today · 27 by 30 yrs out
Nearby sold comps map
Loading sold comps map…
Walkable amenities ~0.75 mi
Loading nearby amenities…
Taxation est. · year 1
- Rental income
- $13,220
- − Mortgage interest
- −$3,865
- − Property taxes
- −$789
- − Insurance
- −$345
- − Repairs & maintenance
- −$1,058
- − Management
- −$1,058
- − Depreciation
- −$2,007
- Taxable income
- $4,099
- Est. tax owed @ 24.0%
- −$984
- After-tax cash flow
- $3,984/yr
For passive investors: Depreciation is non-cash, so a rental often shows a tax loss while cash-flowing — sheltering income. Rental losses are passive: they offset passive income freely, and up to $25,000/yr can offset ordinary (W-2) income if you actively participate and your MAGI is under $100k (phasing out to $0 by $150k); unused losses carry forward. On sale, claimed depreciation is recaptured at up to 25%, and gains may owe capital-gains tax (a 1031 exchange can defer both). Figures are a year-1 estimate at your 24.0% rate — not tax advice; consult a CPA.
Schools (NCES district)
- District
- Omak School District
- NCES district ID
- 5306220
- Math proficiency
- 29% ▬ 0.00%
- Reading proficiency
- 49% ▲ 1.00%
- Median HH income
- $44,421
- Composite
- 35.56/100
- National rank
- #9729
- State rank
- #227 of 291 in WA
Livability — Omak
- Score
- 63/100
- State rank
- #386
- US rank
- #15185
Category grades
Schools grade is shown separately in the Schools card above.
Census & demographics
- Census place
- Omak, WA
- Population (ZIP)
- 9,376
Population outlook (Okanogan County) Hauer SSP2
- Today (2025)
- 40,288 people
- By 2030
- 39,265 · -2.5%
- By 2040
- 37,110 · -7.9%
- By 2050
- 35,389 · -12.2%
- By 2075
- 31,609 · -21.5%
- By 2100
- 26,647 · -33.9%
Race, ethnicity, and origin ACS 2023
- Neighborhood character
- Predominantly White (65%)
- Race & ethnicity
- White 65% Hispanic / Latino 16% Two or more races 16% Native American 14%
- Hispanic origin (detail)
- Mexican 14% Puerto Rican 1%
- Common ancestry
- Portuguese 4% Slovak 3% Lithuanian 2%
- Foreign-born
- 6% · Canada
- Languages at home
- 91% English-only · Spanish 8%
Political lean MEDSL · Okanogan
- 2024 margin
- R (+15.0) · D 41.1% · R 56.0% · Other 2.9%
- 2008→2024 swing
- -8.0pp toward R · 2008: -7.0pp · 2024: -15.0pp
- All cycles
- 2024: R+15.0 2020: R+13.8 2016: R+21.3 2012: R+14.8 2008: R+7.0
Not yet ingested
- Civics
- —
Market trends
- HPI YoY
- ▼ -144.79%
- Current HPI
- 190.8789
- Rent YoY
- —
- Metro
- —
- State GDP YoY
- ▲ 4.65%
- F500 in state
- 22
Industry mix (Fortune 500 HQ in WA)
| Industry | F500 HQs | Revenue |
|---|---|---|
| Retail | 2 | $269B |
|
||
| Technology / Retail | 1 | $638B |
|
||
| Technology | 1 | $245B |
|
||
| Telecommunications | 1 | $38B |
|
||
| Food / Beverage | 1 | $36B |
|
||
| Automotive / Trucks | 1 | $34B |
|
||
Price history
+39.4% since first listed7 events — show timeline
- 2026-05-07 Pending — NWMLS as Distributed by MLS Grid
- 2026-05-07 Listed $69,000 NWMLS as Distributed by MLS Grid
- 2022-04-19 Sold (MLS) $117,000 NWMLS as Distributed by MLS Grid
- 2022-03-09 Pending — NWMLS as Distributed by MLS Grid
- 2022-02-25 Listed $109,000 NWMLS as Distributed by MLS Grid
- 2018-04-02 Sold (Public Records) $56,000 Public Records
- 2005-12-09 Sold (Public Records) $49,500 Public Records
Property tax history
+2.9%/yrLatest (2026): $789 · -3.2% YoY. Source: county tax records.
Cash-flow waterfall
monthlySold comps — $/sqft
last 12 mo · ≤1 miLoading sold comps…