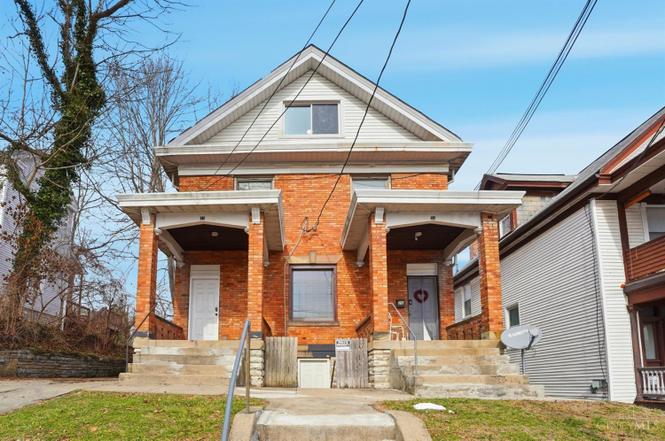
 Duplex
26 Juergens Ave · Cincinnati, OH
Flood risk 1/10 · Minimal
- FEMA flood zone
- X (unshaded)
- Chance of flooding over 30 yrs
- 0.0%
- Est. flood insurance / yr
- $473 – $860
Fire risk 1/10 · Minimal
- Est. fire insurance / yr
- $713 – $1,323
Heat risk 5/10 · Moderate
- Hot days now (above 103°F)
- 7 days/yr
- Hot days in 30 yrs
- 19 days/yr
Wind risk 2/10 · Minimal
- Chance of severe wind over 30 yrs
- 1.0%
Air-quality risk 3/10 · Minor
- Unhealthy air days now
- 2 days/yr
- Unhealthy air days in 30 yrs
- 3 days/yr
Risk factors via First Street. Map © Google.
Why this score? — see what drove the C- grade
The composite is a weighted blend of 9 inputs, each scored 0–100. Each bar is that input's sub-score; the figure is the points it added to the 100-point composite (weight × sub-score).
- Cash flow +21.8/30.0
- DSCR +7.0/10.0
- 1% rule +6.2/10.0
- ARV discount +4.3/15.0
- Livability +4.0/5.0
- Rent growth +2.6/5.0
- Schools +2.5/10.0
- Condition / age +2.5/5.0
- Appreciation +0.0/10.0
$329,900
🖨 Deal sheet 📄 Offer letter ✓ Due diligence
Multi-family units
County records classify this as Multi-Family (2-4 Unit). Listing-text estimate: 2 units. confirmed
Listing remarks MLS
Great investment opportunity with this nice brick 2 family! One side is partially furnished 5 bedroom, 2 tiled bath & other side is a 2 bedroom, 1 tiled bath! Beautiful dark laminate floors throughout! Every bedroom in the 5 bed has it's own a/c window unit & locks for tenant privacy! 2 bed has 3 a/c units. Very close to XU & UC. The entire building is per code & has fire proof insulation! Parking in driveway/street! New glass block windows being installed! Nothing to do but enjoy the income!
Key facts
- Spacious backyard
- Large family rooms
- Versatile duplex
Tags
Property features AI
Finance
- Financial info: Property contains 2 units (one 2-bedroom unit, one 5-bedroom unit); Unit 1 listed rent: $975; Unit 26 occupied; Unit 28 vacant
Exterior
- Parking: 3 garage spaces; 3 open parking spaces; On-street parking; Driveway
- Utilities: Public water; Public sewer; Natural gas
- Home design: Duplex; Three or more levels; Multi-family zoning
- Construction: Stone foundation; Built with brick exterior; Slate roof
- Exterior features: Front porch; Vinyl, wood, and insulated windows; Slate roof; Brick construction
Interior
- Bedrooms: Unit 1: 2 bedrooms; Unit 2: 5 bedrooms
- Bathrooms: Unit 1: 1 full bathroom; Unit 2: 2 full bathrooms
- Heating & cooling: Forced air heating (gas); Window unit cooling; Heat paid by tenant
- Interior features: Full basement; Individual laundry
- Laundry & utility: Individual laundry; Separate furnace for units; Separate air conditioning for units; Separate gas and electric meters
Neighborhood map
What this means for you Summary
Snapshot
- This is a 2 × 4-bed/1.5-bath units multifamily listed at $330k.
Deal economics
- At list price, monthly cash flow is $516 ($6k/yr) — positive. Per door: $258/mo.
- The deal already cash-flows at list — no discount required.
- Meets the 1% rule at list price ($4k rent vs $330k).
- Recommended offer: $290k (12.0% below list) — sets the bar for market timing.
- Cap rate 8.2% vs local median 3.9% in Cincinnati — top-decile yield for the area; either an underpriced asset or a hidden risk that comps aren't pricing in. Stress-test before assuming the spread holds.
Location & tenants
- Location reads 80/100 on livability (#130 in OH, #1,856 nationally) — a professional / high-income tenant draw. Strengths: amenities A+, commute A+, cost of living A+; Watch: employment D, crime F.
- Cincinnati Public Schools (urban): math 25% / reading 36% proficiency, ranked #581 of 656 in OH (top 89%) — families likely to look elsewhere, expect single-tenant / working-renter base with shorter leases; 70% free/reduced lunch — lower-income household profile, screen leases tightly.
- Market conditions: Rents flat; 36 active listings in the ZIP; 5 comparable units currently listed for rent nearby; rentals at typical pace (median 20d on market — plan ~3-4 weeks tenant-placement turnaround); 801 units permitted in Hamilton County in 2024 (190 in 5+ unit buildings).
- At $3,690/mo this rent would consume 83% of the median local household income ($53k/yr) (locally 1186% of renters already pay >50% of income on rent) — very limited rent-growth headroom before tenants either downsize or default.
Forward outlook
- Local home prices are declining (-3.0%/yr); year-one equity from $2k of loan paydown is wiped out by about $10k of value loss. Plan a longer hold.
Negotiation context
- It's been on market 121 days — a 12% lower offer ($290k) is reasonable based on typical stale-listing flexibility.
- 8 sale attempts since 27y ago; this cycle's ask has dropped $30k (8%) from the opening price — seller is motivated, your offer sets the floor, not the list.
Risks & watch-outs
- Watch-outs: built in 1914 — expect roof / HVAC / electrical / plumbing capex.
- Climate carrying-cost: extreme-heat days projected 7→19/yr by 2055 (HVAC capex compounding) — expect insurance premiums to compound above CPI over the hold.
Questions for the listing agent
- It's been on market 121 days. Have you received any prior offers? Is the seller open to a 12% concession, seller financing, or rate buy-down credit?
- Can we see the unit-by-unit rent roll, current vacancy, and any below-market leases? What's the average tenancy length?
- What capital expenditures (roof, boiler, parking lot, exteriors) have been made in the last 5 years, and what's planned in the next 2?
- Built in 1914 — when were the roof, HVAC, electrical panel, plumbing, and water heater last replaced?
- Why hasn't it sold? Are there any deal-killer items the seller is aware of (foundation, flood, title, zoning, code violations)?
- Is there a deadline driving the sale (1031 exchange, divorce, estate, relocation)? That informs how much negotiation room exists.
- Schools are B-rated — typically a magnet for longer-tenancy family renters. What's the average tenant stay here, and is there a school-zone premium baked into asking?
- Crime grade is F in this area — have there been break-ins, vandalism, or insurance claims at this property in the last 3 years? What carrier currently insures it and at what premium?
- What's the average days-on-market for RENTAL listings here right now (not sales)? A rising rental-DOM trend means longer vacancies and softer asking-rent achievability than the comps imply.
- What's the recent tenant-quality profile in this submarket — average credit score on applications, eviction rate, late-payment / NSF rate, and stable-employment percentage? A property-management company in the area should have these aggregated.
- How much new apartment / multifamily construction is in the pipeline within 1–3 miles? Heavy new supply (>2% of stock underway) typically softens rents 12–24 months out; light construction supports rent growth.
Investment metrics
- 1% rule
- 1.12% ✓
- Cap rate
- 8.17%
- Cash-on-cash
- 6.70%
- DSCR
- 1.30
- GRM
- 7.5
CMA / ARV
- ARV (on-the-fly)
- $308,098
- Comps found
- 6
Show comp detail 6 sales within ~0.75 mi
| Address | Dist | Beds/Ba | Sqft | Sold | Price | $/sf | Match |
|---|---|---|---|---|---|---|---|
| 3762 Vine St | 0.22mi | 4/4.0 (-1) | 2,624 (+0%) | 3mo | $310,000 | $118 | 78 |
| 101 Glenwood Ave | 0.49mi | 4/— (-1) | 2,772 (+6%) | 3mo | $154,330 | $56 | 59 |
| 3552 Vine St | 0.34mi | 4/2.0 (-1) | 2,848 (+9%) | 3mo | $225,000 | $79 | 58 |
| 3450 Ruther Ave | 0.50mi | 4/4.0 (-1) | 2,800 (+7%) | 2mo | $352,000 | $126 | 54 |
| 138 Glenridge Pl | 0.50mi | 4/4.0 (-1) | 2,772 (+6%) | 15mo | $205,000 | $74 | 45 |
| 3400 Bishop St | 0.56mi | 6/4.5 (+1) | 2,938 (+12%) | 13mo | $513,000 | $175 | 32 |
Match score weights: distance 35% · size 25% · config 20% · recency 20%. Top-matched comps best support the ARV.
Projected returns pro-forma
-3.0% appreciation · 0.41% rent growth · sell at horizon
- IRR
- -9.1%
- Equity multiple
- 0.68×
- Total profit
- $-29,854
- Equity at exit
- $49,189
- IRR
- -3.6%
- Equity multiple
- 0.79×
- Total profit
- $-19,694
- Equity at exit
- $28,524
Cash invested: $92,372 (down + closing). Projections, not guarantees.
Landlord ↔ Tenant lean methodology
- Overall (STATE)
- 73 Landlord-Friendly
- State Ohio
- 73 Landlord-Friendly · R+6
- County
- — inherits STATE
- City
- — inherits STATE
ZIP-level market 45220
- Rents YoY
- 0.4%
- Active inventory
- 36
- Price-to-rent
- 14.9×
Monthly cashflow live
- Estimated rent
- $3,690 high interval (Pro) →
- Mortgage (P&I)
- −$1,730
- Tax from tax record
- −$532 /mo · $6,382/yr
- Insurance
- −$137
- HOA
- −$0
- Vacancy / Maint / Mgmt
- −$775
- Net cashflow
- $516
Break-even live
2-unit breakdown (identical units grouped — click to expand)
| Units | Beds | Baths | Est. rent |
|---|---|---|---|
| 2× units | 4 | 1.5 | $3,690 |
| #1 | 4 | 1.5 | $1,845 |
| #2 | 4 | 1.5 | $1,845 |
| Total (2 units) | $3,690 | ||
UW: 25.0% down · 7.5% · 30yr · 1.5% tax · 5.0% vac · 8.0% maint · 8.0% mgmt
Financing live
Cash to close
- Down payment
- $82,475
- Closing costs
- $9,897
- Reserves months
- —
- Total cash needed
- —
Loan-product check · same deal, 3 products live
Conventional
25% down · 7.5% · 30yr
- Down + closing
- —
- Monthly P&I
- —
- Monthly cashflow
- —
- DSCR
- —
- Eligible?
- —
Personal DTI + credit; lowest rate.
DSCR
20% down · 8.5% · 30yr
- Down + closing
- —
- Monthly P&I
- —
- Monthly cashflow
- —
- DSCR
- —
- Eligible?
- —
No personal income docs; deal must DSCR.
Hard money
10% down · 12.0% · 12mo
- Down + closing
- —
- Monthly P&I
- —
- Monthly cashflow
- —
- DSCR
- —
- Eligible?
- —
Short-term bridge; refi at stabilization.
Rent comps 5 comps
| Address | Beds | Baths | Sqft | Rent | $/sqft | DOM | Units | Dist |
|---|---|---|---|---|---|---|---|---|
| 223 Woolper Ave Cincinnati, OH | 6.0 | 3.0 | 3000 | $3,500 | $1.17 | 12d | 1 | 0.30mi |
| 3476 Cornell Pl Cincinnati, OH | 5.0 | 2.5 | 2930 | $3,095 | $1.06 | 4d | 1 | 0.79mi |
| 2800 Jefferson Ave Cincinnati, OH | 4.0 | 2.0 | 2500 | $625 | $0.25 | 19d | 1 | 1.39mi |
| 241 E University Ave Cincinnati, OH | 5.0 | 2.0 | 1836 | $4,000 | $2.18 | 23d | 1 | 1.41mi |
| 2813 Gerard St Unit 1540075P Cincinnati, OH | 4.0 | 3.0 | 2152 | $6,281 | $2.92 | 20d | 1 | 1.43mi |
Listing history 35 events
-
2026-06-18days on market $329,900 Active 121 DOM
-
2026-06-17days on market $329,900 Active 120 DOM
-
2026-06-16days on market $329,900 Active 119 DOM
-
2026-06-15days on market $329,900 Active 118 DOM
-
2026-06-13days on market $329,900 Active 116 DOM
-
2026-06-13days on market $329,900 Active 115 DOM
-
2026-06-09days on market $329,900 Active 112 DOM
-
2026-06-08days on market $329,900 Active 111 DOM
-
2026-06-07days on market $329,900 Active 110 DOM
-
2026-06-03days on market $329,900 Active 106 DOM
-
2026-06-02days on market $329,900 Active 105 DOM
-
2026-06-01days on market $329,900 Active 104 DOM
-
2026-05-31days on market $329,900 Active 103 DOM
-
2026-04-24price $339,900
-
2026-02-16$359,900 Active
-
2022-06-06soldstatus $287,500 Sold 514-char remark
Show marketing remark (514 chars)
Great investment opportunity with this nice brick 2 family! One side is partially furnished 5 bedroom, 2 tiled bath & other side is a 2 bedroom, 1 tiled bath! Beautiful dark laminate floors throughout! Every bedroom in the 5 bed has it's own a/c window unit & locks for tenant privacy! 2 bed has 3 a/c units. Very close to XU & UC. The entire building is per code & has fire proof insulation! Parking in driveway/street! New glass block windows being installed! Nothing to do but enjoy the income!
-
2022-05-04historical Contingency Pending 514-char remark
Show marketing remark (514 chars)
Great investment opportunity with this nice brick 2 family! One side is partially furnished 5 bedroom, 2 tiled bath & other side is a 2 bedroom, 1 tiled bath! Beautiful dark laminate floors throughout! Every bedroom in the 5 bed has it's own a/c window unit & locks for tenant privacy! 2 bed has 3 a/c units. Very close to XU & UC. The entire building is per code & has fire proof insulation! Parking in driveway/street! New glass block windows being installed! Nothing to do but enjoy the income!
-
2022-03-14$299,900 Active 514-char remark
Show marketing remark (514 chars)
Great investment opportunity with this nice brick 2 family! One side is partially furnished 5 bedroom, 2 tiled bath & other side is a 2 bedroom, 1 tiled bath! Beautiful dark laminate floors throughout! Every bedroom in the 5 bed has it's own a/c window unit & locks for tenant privacy! 2 bed has 3 a/c units. Very close to XU & UC. The entire building is per code & has fire proof insulation! Parking in driveway/street! New glass block windows being installed! Nothing to do but enjoy the income!
-
2007-05-21soldstatus $27,400
-
2007-05-01soldstatus $27,400 239-char remark
Show marketing remark (239 chars)
Opportunity Knocks! Close to UC-Large Brick 3 family -3 separate furnaces, updated elec./plumbing and a new roof! Property right next door listed for $165,000-Structurally/Mechanically solid-Owner does not have time to turn and lease apts-
-
2006-08-16$34,000 239-char remark
Show marketing remark (239 chars)
Opportunity Knocks! Close to UC-Large Brick 3 family -3 separate furnaces, updated elec./plumbing and a new roof! Property right next door listed for $165,000-Structurally/Mechanically solid-Owner does not have time to turn and lease apts-
-
2005-06-28soldstatus $47,000
-
2005-06-24soldstatus $47,000
-
2005-05-23$49,900
-
2004-12-01historical
-
2004-10-18$54,500
-
2002-06-24historical
-
2002-06-24historical
-
2001-07-30soldstatus $55,000
-
2001-07-25soldstatus $55,000
-
2001-04-24$60,000
-
1999-12-01$62,000
-
1999-01-28$60,000
-
1987-06-19soldstatus $35,000
-
1983-04-01soldstatus $35,500
ⓘ Source: listings_history table (triggers on properties + properties_extension) + one-shot
backfill from property_details.listing_events for pre-trigger history.
Tax reassessment forecast OH · Partial reset (capped growth)
- Current annual tax
- $6,382 · $532/mo
- Projected year-2 tax
- $6,382 · $532/mo
- Expected delta
- $0/yr ($0/mo · -0.0%)
ⓘ Screening estimate from a state-policy table — verify with the county assessor before closing.
Climate risk First Street
- Flood 1/10 Low FEMA zone X (unshaded) · 0% chance over 30 yrs
- Wildfire 1/10 Low
- Heat 5/10 Major 7 d/yr ≥103°F today · 19 d/yr by 30 yrs out
- Wind 2/10 Low 100% chance of damaging wind over 30 yrs
- Air quality 3/10 Moderate 2 unhealthy d/yr today · 3 by 30 yrs out
Nearby sold comps map
Loading sold comps map…
Walkable amenities ~0.75 mi
Loading nearby amenities…
Taxation est. · year 1
- Rental income
- $44,280
- − Mortgage interest
- −$18,480
- − Property taxes
- −$6,382
- − Insurance
- −$1,650
- − Repairs & maintenance
- −$3,542
- − Management
- −$3,542
- − Depreciation
- −$9,597
- Taxable income
- $1,087
- Est. tax owed @ 24.0%
- −$261
- After-tax cash flow
- $5,928/yr
For passive investors: Depreciation is non-cash, so a rental often shows a tax loss while cash-flowing — sheltering income. Rental losses are passive: they offset passive income freely, and up to $25,000/yr can offset ordinary (W-2) income if you actively participate and your MAGI is under $100k (phasing out to $0 by $150k); unused losses carry forward. On sale, claimed depreciation is recaptured at up to 25%, and gains may owe capital-gains tax (a 1031 exchange can defer both). Figures are a year-1 estimate at your 24.0% rate — not tax advice; consult a CPA.
Schools (NCES district)
- District
- Cincinnati Public Schools
- NCES district ID
- 3904375
- Math proficiency
- 25% ▼ -19.00%
- Reading proficiency
- 36% ▼ -14.00%
- Median HH income
- $35,743
- Composite
- 25.21/100
- National rank
- #7508
- State rank
- #581 of 656 in OH
Livability — Cincinnati
- Score
- 80/100
- State rank
- #130
- US rank
- #1856
Category grades
Schools grade is shown separately in the Schools card above.
Census & demographics
- Census place
- Cincinnati, OH
- County
- Hamilton County · 701,295 people
- City population
- 505,555
- Metro
- Cincinnati, OH-KY-IN
- Population (ZIP)
- 14,109
- Household income
- $53,440
- Rent vs Own
- Severe rent burden
- 1186.0
Population outlook (Hamilton County) Hauer SSP2
- Today (2025)
- 826,054 people
- By 2030
- 830,947 · +0.6%
- By 2040
- 832,319 · +0.8%
- By 2050
- 822,428 · -0.4%
- By 2075
- 788,688 · -4.5%
- By 2100
- 710,674 · -14.0%
Race, ethnicity, and origin ACS 2023
- Neighborhood character
- Diverse neighborhood (Simpson 0.58)
- Race & ethnicity
- White 60% Black 20% Asian 14% Hispanic / Latino 4% Two or more races 4%
- Common ancestry
- Lithuanian 2% Serbian 1% Italian 1%
- Foreign-born
- 19% · China, Canada, Vietnam
- Languages at home
- 80% English-only · Other Indo-European 6% Chinese 3% Spanish 2%
Political lean MEDSL · Hamilton
- 2024 margin
- D (+14.9) · D 57.0% · R 42.1%
- 2008→2024 swing
- +7.9pp toward D · 2008: 7.0pp · 2024: 14.9pp
- All cycles
- 2024: D+14.9 2020: D+15.9 2016: D+9.5 2012: D+4.9 2008: D+7.0
Not yet ingested
- Civics
- —
Market trends
- HPI YoY
- ▼ -196.81%
- Current HPI
- 246.0631
- Rent YoY
- ▲ 0.41%
- Metro
- Cincinnati, OH-KY-IN
- State GDP YoY
- ▲ 1.98%
- F500 in state
- 48
Industry mix (Fortune 500 HQ in OH)
| Industry | F500 HQs | Revenue |
|---|---|---|
| Insurance | 3 | $145B |
|
||
| Industrial Machinery | 3 | $49B |
|
||
| Financial Services | 3 | $24B |
|
||
| Consumer Goods | 2 | $93B |
|
||
| Aerospace / Defense | 2 | $47B |
|
||
| Utilities | 2 | $33B |
|
||
Price history
+857.5% since first listed22 events — show timeline
- 2026-04-24 Price Changed $339,900 Cincy MLS
- 2026-02-16 Listed $359,900 Cincy MLS
- 2022-06-06 Sold (MLS) $287,500 Cincy MLS
- 2022-05-04 Contingent — Cincy MLS
- 2022-03-14 Listed $299,900 Cincy MLS
- 2007-05-21 Sold (Public Records) $27,400 Public Records
- 2007-05-01 Sold (MLS) $27,400 Cincy MLS
- 2006-08-16 Listed $34,000 Cincy MLS
- 2005-06-28 Sold (Public Records) $47,000 Public Records
- 2005-06-24 Sold (MLS) $47,000 Cincy MLS
- 2005-05-23 Listed $49,900 Cincy MLS
- 2004-12-01 Listing Removed — Cincy MLS
- 2004-10-18 Listed $54,500 Cincy MLS
- 2002-06-24 Listing Removed — Cincy MLS
- 2002-06-24 Listing Removed — Cincy MLS
- 2001-07-30 Sold (Public Records) $55,000 Public Records
- 2001-07-25 Sold (MLS) $55,000 Cincy MLS
- 2001-04-24 Listed $60,000 Cincy MLS
- 1999-12-01 Listed $62,000 Cincy MLS
- 1999-01-28 Listed $60,000 Cincy MLS
- 1987-06-19 Sold (Public Records) $35,000 Public Records
- 1983-04-01 Sold (Public Records) $35,500 Public Records
Property tax history
+22.9%/yrLatest (2025): $6,382 · +0.1% YoY. Source: county tax records.
Cash-flow waterfall
monthlySold comps — $/sqft
last 12 mo · ≤1 miLoading sold comps…